The Jan. 7 brutal beating death of Tyre Nichols, a 29-year-old Black man, at the hands of five Memphis, Tennessee, police officers highlighted once again the longstanding U.S. problem of suspects, particularly Black suspects, ending up dead even when they are unarmed and stopped or pursued for suspected nonviolent criminal activity.
Nichols was ostensibly pulled over for reckless driving, but video footage shows the officers, all of them Black, knocking Nichols to the ground with punches, kicks, and a police baton while the suspect begs for mercy. Nichols died in hospital three days later from the injuries he sustained in the attack. The five officers are facing numerous felonies, including second-degree murder, and other officers, sheriff’s deputies, and Fire Department employees have been disciplined.
Nichols is one of at least 158 people who have been killed by police officers in the first two months of 2023, according to data from the nonprofit organization Mapping Police Violence. These people can be added to the estimated 11,200 people that have been killed by police during law enforcement actions in the 50 U.S. states from 2013 to 2022. (This is the state that spends the most on the police.)
Police killings are not even in each state. To determine the states with the most killings by police departments, 24/7 Wall St. reviewed data from Mapping Police Violence, a research collaborative that collects data on police killings across the nation from three large databases. Data includes all police department killings from 2013 through the end of 2022. Police killings per 100,000 were calculated using five-year 2021 population estimates from the U.S. Census Bureau’s American Community Survey.
In a dozen U.S. states, more than 40% of the suspects that have been killed by police in the 10 years through 2022 were Black, led by 65% in Maryland and 56% in Louisiana, largely due to the high levels of violent crime in the cities of Baltimore and New Orleans. In Maryland and New Jersey, the percentage of suspects killed by police who were unarmed was 56% and 64%, respectively. In Illinois, nearly 55% of suspects killed by police were Black, while 44% were fleeing at the time they were killed, and 43% were unarmed. (These are the most militarized local police departments in America.)
In 13 U.S. states, no police officer was disciplined or fired for their involvement in these killings. Only two states have fired or disciplined at least one in 10 officers involved in these killings: South Carolina and Virginia.
Here are the states with the most police killings per capita.
Click here to read our detailed methodology.
50. Rhode Island
> Documented police killings per 100,000 people (2013-2022): 0.8 (total: 9 — the fewest)
> Worst year for documented killings: tied — 2016, 2021: 2
> % of those killed who were Black: 33.3% (total: 3)
> % of those killed who did not have a gun: 44.4% (total: 4)
> % of those killed who were fleeing: 66.7% (total: 4)
> % of cases officer was disciplined or charged with a crime: 0.0% (total: 0)
[in-text-ad]
49. Massachusetts
> Documented police killings per 100,000 people (2013-2022): 1.1 (total: 78 — 15th fewest)
> Worst year for documented killings: tied — 2013, 2022: 13
> % of those killed who were Black: 30.1% (total: 22)
> % of those killed who did not have a gun: 57.3% (total: 43)
> % of those killed who were fleeing: 31.0% (total: 18)
> % of cases officer was disciplined or charged with a crime: 3.8% (total: 2)
[recirclink id=1207113]

48. New York
> Documented police killings per 100,000 people (2013-2022): 1.2 (total: 235 — 15th most)
> Worst year for documented killings: 2020: 29
> % of those killed who were Black: 48.3% (total: 100)
> % of those killed who did not have a gun: 59.3% (total: 134)
> % of those killed who were fleeing: 28.9% (total: 44)
> % of cases officer was disciplined or charged with a crime: 4.7% (total: 7)
47. Connecticut
> Documented police killings per 100,000 people (2013-2022): 1.3 (total: 46 — 8th fewest)
> Worst year for documented killings: 2013: 12
> % of those killed who were Black: 23.8% (total: 10)
> % of those killed who did not have a gun: 61.4% (total: 27)
> % of those killed who were fleeing: 33.3% (total: 9)
> % of cases officer was disciplined or charged with a crime: 2.8% (total: 1)
[in-text-ad-2]

46. New Jersey
> Documented police killings per 100,000 people (2013-2022): 1.5 (total: 139 — 21st fewest)
> Worst year for documented killings: 2015: 18
> % of those killed who were Black: 50.8% (total: 62)
> % of those killed who did not have a gun: 64.1% (total: 84)
> % of those killed who were fleeing: 23.3% (total: 20)
> % of cases officer was disciplined or charged with a crime: 9.1% (total: 9)

45. Michigan
> Documented police killings per 100,000 people (2013-2022): 1.9 (total: 189 — 21st most)
> Worst year for documented killings: 2021: 28
> % of those killed who were Black: 40.7% (total: 66)
> % of those killed who did not have a gun: 42.4% (total: 78)
> % of those killed who were fleeing: 22.5% (total: 29)
> % of cases officer was disciplined or charged with a crime: 3.3% (total: 4)
[in-text-ad]

44. Pennsylvania
> Documented police killings per 100,000 people (2013-2022): 1.9 (total: 245 — 14th most)
> Worst year for documented killings: 2013: 37
> % of those killed who were Black: 35.7% (total: 74)
> % of those killed who did not have a gun: 48.1% (total: 114)
> % of those killed who were fleeing: 26.3% (total: 41)
> % of cases officer was disciplined or charged with a crime: 5.9% (total: 10)
[recirclink id=1207114]
43. New Hampshire
> Documented police killings per 100,000 people (2013-2022): 2.0 (total: 27 — 5th fewest)
> Worst year for documented killings: tied — 2015, 2020: 4
> % of those killed who were Black: 0.0% (total: 0)
> % of those killed who did not have a gun: 45.5% (total: 10)
> % of those killed who were fleeing: 11.8% (total: 2)
> % of cases officer was disciplined or charged with a crime: 0.0% (total: 0)
42. Illinois
> Documented police killings per 100,000 people (2013-2022): 2.0 (total: 257 — 13th most)
> Worst year for documented killings: 2014: 33
> % of those killed who were Black: 54.5% (total: 128)
> % of those killed who did not have a gun: 42.7% (total: 105)
> % of those killed who were fleeing: 43.6% (total: 72)
> % of cases officer was disciplined or charged with a crime: 6.3% (total: 10)
[in-text-ad-2]
41. Minnesota
> Documented police killings per 100,000 people (2013-2022): 2.1 (total: 117 — 19th fewest)
> Worst year for documented killings: tied — 2015: 14
> % of those killed who were Black: 23.5% (total: 27)
> % of those killed who did not have a gun: 46.9% (total: 53)
> % of those killed who were fleeing: 26.9% (total: 21)
> % of cases officer was disciplined or charged with a crime: 7.8% (total: 7)
40. Iowa
> Documented police killings per 100,000 people (2013-2022): 2.1 (total: 66 — 14th fewest)
> Worst year for documented killings: 2018: 10
> % of those killed who were Black: 18.6% (total: 11)
> % of those killed who did not have a gun: 45.2% (total: 28)
> % of those killed who were fleeing: 40.5% (total: 17)
> % of cases officer was disciplined or charged with a crime: 0.0% (total: 0)
[in-text-ad]
39. Virginia
> Documented police killings per 100,000 people (2013-2022): 2.2 (total: 191 — 19th most)
> Worst year for documented killings: 2022: 29
> % of those killed who were Black: 42.3% (total: 71)
> % of those killed who did not have a gun: 49.5% (total: 91)
> % of those killed who were fleeing: 26.5% (total: 36)
> % of cases officer was disciplined or charged with a crime: 11.1% (total: 15)
[recirclink id=1196191]
38. Ohio
> Documented police killings per 100,000 people (2013-2022): 2.6 (total: 310 — 8th most)
> Worst year for documented killings: 2022: 41
> % of those killed who were Black: 42.2% (total: 125)
> % of those killed who did not have a gun: 48.8% (total: 144)
> % of those killed who were fleeing: 28.1% (total: 61)
> % of cases officer was disciplined or charged with a crime: 4.6% (total: 10)
37. Delaware
> Documented police killings per 100,000 people (2013-2022): 2.6 (total: 26 — 4th fewest)
> Worst year for documented killings: 2017: 7
> % of those killed who were Black: 52.2% (total: 12)
> % of those killed who did not have a gun: 42.3% (total: 11)
> % of those killed who were fleeing: 38.1% (total: 8)
> % of cases officer was disciplined or charged with a crime: 0.0% (total: 0)
[in-text-ad-2]
36. Vermont
> Documented police killings per 100,000 people (2013-2022): 2.6 (total: 17 — 2nd fewest)
> Worst year for documented killings: 2019: 4
> % of those killed who were Black: 0.0% (total: 0)
> % of those killed who did not have a gun: 70.6% (total: 12)
> % of those killed who were fleeing: 38.5% (total: 5)
> % of cases officer was disciplined or charged with a crime: 0.0% (total: 0)
35. Wisconsin
> Documented police killings per 100,000 people (2013-2022): 2.7 (total: 156 — 23rd fewest)
> Worst year for documented killings: 2017: 26
> % of those killed who were Black: 28.6% (total: 42)
> % of those killed who did not have a gun: 49.7% (total: 75)
> % of those killed who were fleeing: 29.2% (total: 33)
> % of cases officer was disciplined or charged with a crime: 1.8% (total: 2)
[in-text-ad]
34. North Dakota
> Documented police killings per 100,000 people (2013-2022): 2.7 (total: 21 — 3rd fewest)
> Worst year for documented killings: tied — 2018, 2021: 4
> % of those killed who were Black: 0.0% (total: 0)
> % of those killed who did not have a gun: 47.4% (total: 9)
> % of those killed who were fleeing: 35.7% (total: 5)
> % of cases officer was disciplined or charged with a crime: 0.0% (total: 0)
[recirclink id=1194031]
33. Indiana
> Documented police killings per 100,000 people (2013-2022): 2.8 (total: 190 — 20th most)
> Worst year for documented killings: 2020: 27
> % of those killed who were Black: 32.8% (total: 57)
> % of those killed who did not have a gun: 36.9% (total: 69)
> % of those killed who were fleeing: 29.9% (total: 41)
> % of cases officer was disciplined or charged with a crime: 1.6% (total: 2)
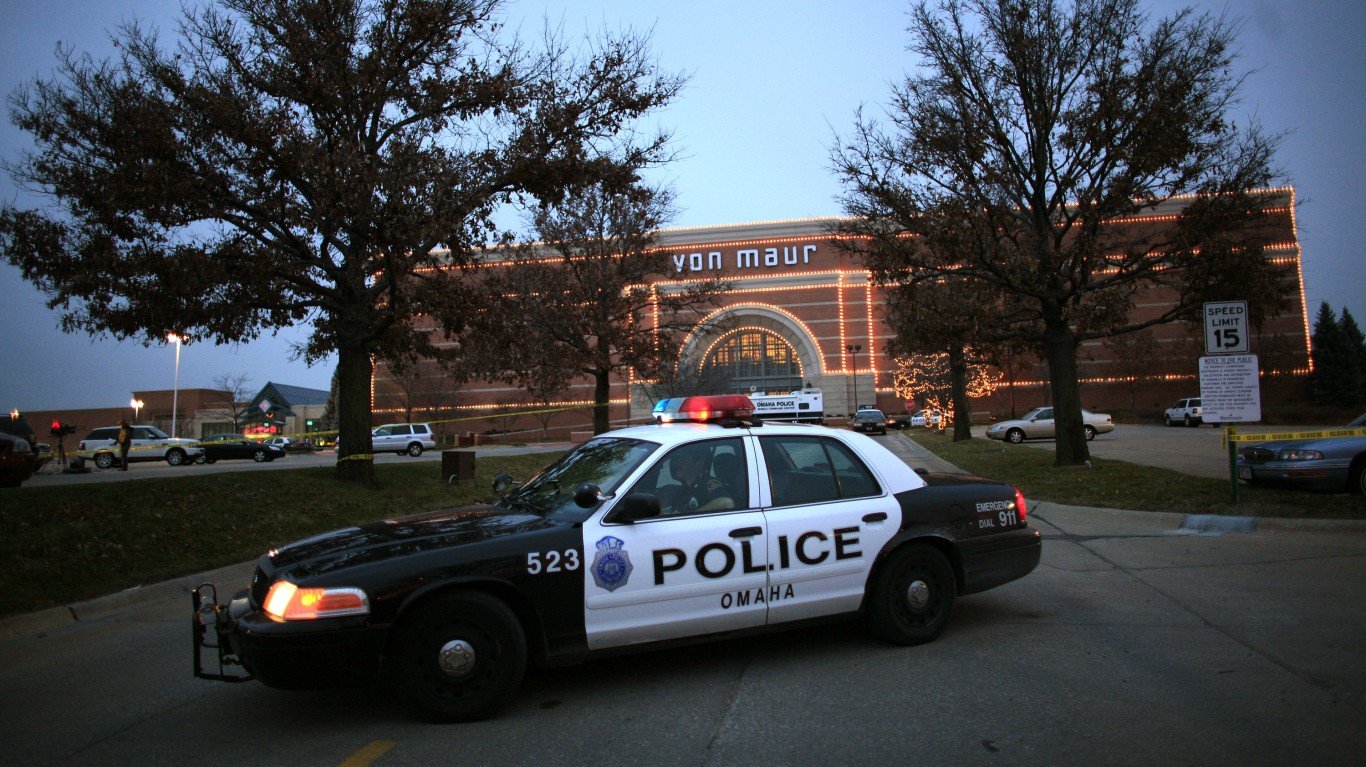
32. Nebraska
> Documented police killings per 100,000 people (2013-2022): 2.9 (total: 56 — 11th fewest)
> Worst year for documented killings: 2021: 12
> % of those killed who were Black: 17.0% (total: 9)
> % of those killed who did not have a gun: 47.2% (total: 25)
> % of those killed who were fleeing: 18.4% (total: 7)
> % of cases officer was disciplined or charged with a crime: 2.9% (total: 1)
[in-text-ad-2]
31. Maryland
> Documented police killings per 100,000 people (2013-2022): 2.9 (total: 178 — 25th most)
> Worst year for documented killings: 2013: 24
> % of those killed who were Black: 65.1% (total: 108)
> % of those killed who did not have a gun: 55.7% (total: 98)
> % of those killed who were fleeing: 24.8% (total: 28)
> % of cases officer was disciplined or charged with a crime: 6.1% (total: 7)
30. North Carolina
> Documented police killings per 100,000 people (2013-2022): 3.0 (total: 312 — 7th most)
> Worst year for documented killings: 2022: 38
> % of those killed who were Black: 37.9% (total: 107)
> % of those killed who did not have a gun: 40.5% (total: 120)
> % of those killed who were fleeing: 26.2% (total: 56)
> % of cases officer was disciplined or charged with a crime: 4.1% (total: 9)
[in-text-ad]
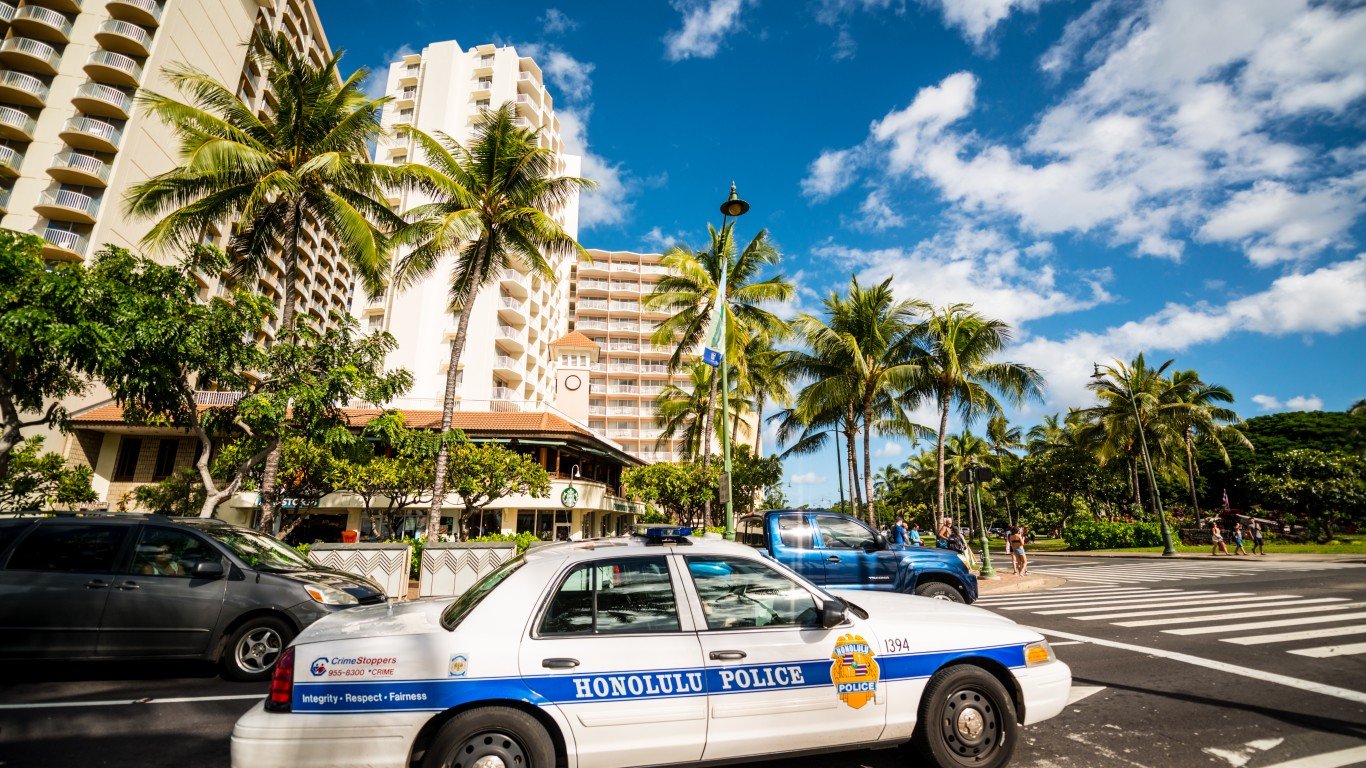
29. Hawaii
> Documented police killings per 100,000 people (2013-2022): 3.3 (total: 48 — 10th fewest)
> Worst year for documented killings: 2018: 11
> % of those killed who were Black: 4.4% (total: 2)
> % of those killed who did not have a gun: 68.8% (total: 33)
> % of those killed who were fleeing: 25.0% (total: 9)
> % of cases officer was disciplined or charged with a crime: 2.6% (total: 1)
[recirclink id=1192219]
28. Maine
> Documented police killings per 100,000 people (2013-2022): 3.5 (total: 47 — 9th fewest)
> Worst year for documented killings: 2017: 10
> % of those killed who were Black: 2.3% (total: 1)
> % of those killed who did not have a gun: 42.9% (total: 18)
> % of those killed who were fleeing: 20.7% (total: 6)
> % of cases officer was disciplined or charged with a crime: 0.0% (total: 0)
27. South Carolina
> Documented police killings per 100,000 people (2013-2022): 3.6 (total: 181 — 23rd most)
> Worst year for documented killings: 2022: 26
> % of those killed who were Black: 40.8% (total: 64)
> % of those killed who did not have a gun: 42.3% (total: 71)
> % of those killed who were fleeing: 32.5% (total: 39)
> % of cases officer was disciplined or charged with a crime: 10.1% (total: 12)
[in-text-ad-2]

26. Texas
> Documented police killings per 100,000 people (2013-2022): 3.6 (total: 1,038 — 2nd most)
> Worst year for documented killings: 2022: 125
> % of those killed who were Black: 25.4% (total: 240)
> % of those killed who did not have a gun: 44.5% (total: 440)
> % of those killed who were fleeing: 33.2% (total: 223)
> % of cases officer was disciplined or charged with a crime: 6.3% (total: 39)
25. Florida
> Documented police killings per 100,000 people (2013-2022): 3.6 (total: 769 — 3rd most)
> Worst year for documented killings: 2020: 98
> % of those killed who were Black: 34.7% (total: 236)
> % of those killed who did not have a gun: 48.0% (total: 353)
> % of those killed who were fleeing: 28.5% (total: 142)
> % of cases officer was disciplined or charged with a crime: 2.2% (total: 10)
[in-text-ad]
24. Kansas
> Documented police killings per 100,000 people (2013-2022): 3.6 (total: 107 — 18th fewest)
> Worst year for documented killings: tied — 2014, 2022: 15
> % of those killed who were Black: 15.2% (total: 15)
> % of those killed who did not have a gun: 41.0% (total: 43)
> % of those killed who were fleeing: 38.2% (total: 29)
> % of cases officer was disciplined or charged with a crime: 1.5% (total: 1)
[recirclink id=1207113]
23. Utah
> Documented police killings per 100,000 people (2013-2022): 3.9 (total: 126 — 20th fewest)
> Worst year for documented killings: 2018: 19
> % of those killed who were Black: 9.6% (total: 11)
> % of those killed who did not have a gun: 49.2% (total: 58)
> % of those killed who were fleeing: 36.4% (total: 32)
> % of cases officer was disciplined or charged with a crime: 1.2% (total: 1)
22. Oregon
> Documented police killings per 100,000 people (2013-2022): 4.0 (total: 168 — 25th fewest)
> Worst year for documented killings: 2022: 23
> % of those killed who were Black: 8.1% (total: 12)
> % of those killed who did not have a gun: 44.3% (total: 70)
> % of those killed who were fleeing: 30.6% (total: 33)
> % of cases officer was disciplined or charged with a crime: 0.0% (total: 0)
[in-text-ad-2]

21. Georgia
> Documented police killings per 100,000 people (2013-2022): 4.0 (total: 430 — 5th most)
> Worst year for documented killings: 2022: 62
> % of those killed who were Black: 48.2% (total: 175)
> % of those killed who did not have a gun: 46.6% (total: 191)
> % of those killed who were fleeing: 34.9% (total: 103)
> % of cases officer was disciplined or charged with a crime: 4.7% (total: 12)
20. Tennessee
> Documented police killings per 100,000 people (2013-2022): 4.1 (total: 279 — 12th most)
> Worst year for documented killings: 2021: 39
> % of those killed who were Black: 28.6% (total: 68)
> % of those killed who did not have a gun: 48.0% (total: 129)
> % of those killed who were fleeing: 34.3% (total: 69)
> % of cases officer was disciplined or charged with a crime: 3.0% (total: 5)
[in-text-ad]
19. Washington
> Documented police killings per 100,000 people (2013-2022): 4.1 (total: 310 — 8th most)
> Worst year for documented killings: 2022: 42
> % of those killed who were Black: 13.8% (total: 35)
> % of those killed who did not have a gun: 53.4% (total: 159)
> % of those killed who were fleeing: 34.0% (total: 71)
> % of cases officer was disciplined or charged with a crime: 1.5% (total: 3)
[recirclink id=1207114]
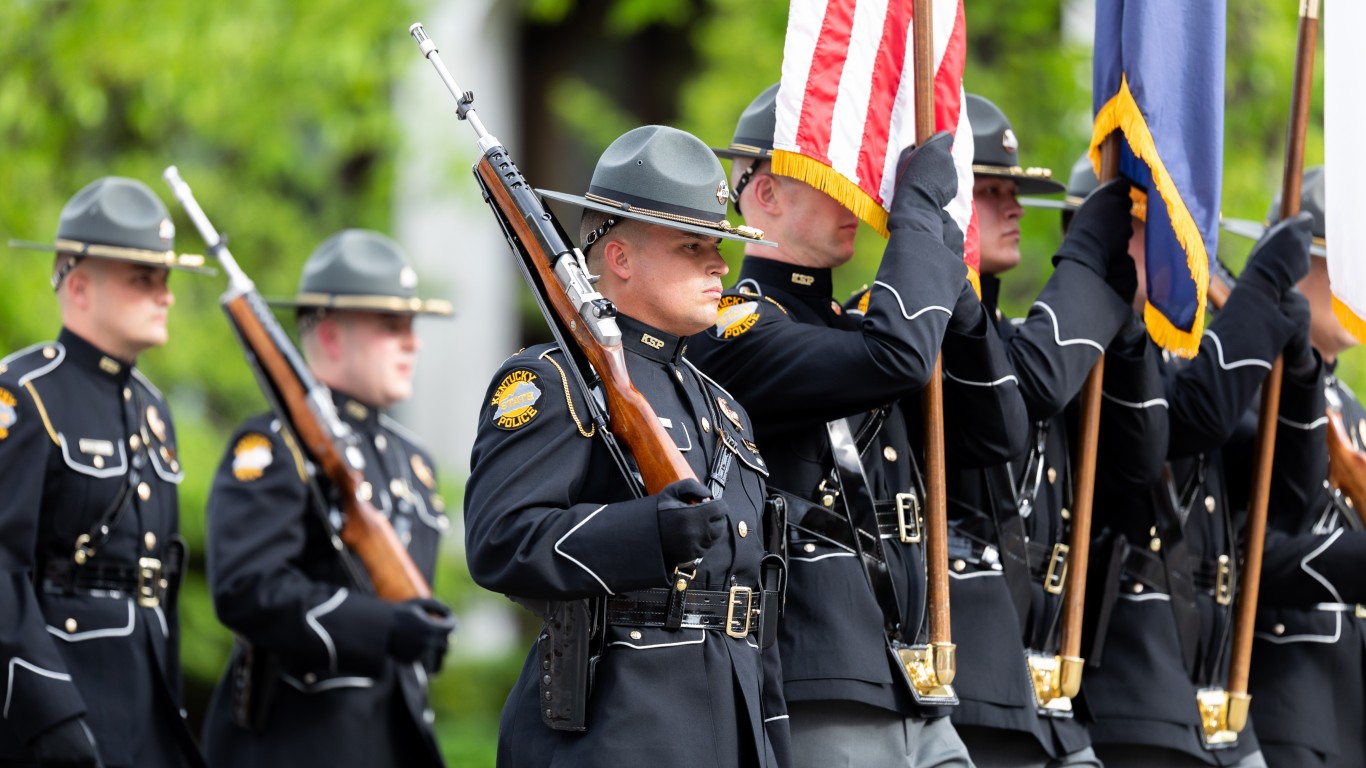
18. Kentucky
> Documented police killings per 100,000 people (2013-2022): 4.1 (total: 183 — 22nd most)
> Worst year for documented killings: 2021: 23
> % of those killed who were Black: 18.1% (total: 28)
> % of those killed who did not have a gun: 40.2% (total: 66)
> % of those killed who were fleeing: 33.1% (total: 40)
> % of cases officer was disciplined or charged with a crime: 2.8% (total: 3)

17. California
> Documented police killings per 100,000 people (2013-2022): 4.2 (total: 1,656 — the most)
> Worst year for documented killings: 2015: 201
> % of those killed who were Black: 16.6% (total: 240)
> % of those killed who did not have a gun: 59.9% (total: 947)
> % of those killed who were fleeing: 31.6% (total: 344)
> % of cases officer was disciplined or charged with a crime: 2.3% (total: 22)
[in-text-ad-2]
16. Alabama
> Documented police killings per 100,000 people (2013-2022): 4.2 (total: 211 — 18th most)
> Worst year for documented killings: 2021: 27
> % of those killed who were Black: 38.7% (total: 75)
> % of those killed who did not have a gun: 44.3% (total: 89)
> % of those killed who were fleeing: 33.8% (total: 49)
> % of cases officer was disciplined or charged with a crime: 4.7% (total: 6)
15. South Dakota
> Documented police killings per 100,000 people (2013-2022): 4.3 (total: 38 — 7th fewest)
> Worst year for documented killings: 2022: 7
> % of those killed who were Black: 0.0% (total: 0)
> % of those killed who did not have a gun: 45.5% (total: 15)
> % of those killed who were fleeing: 24.0% (total: 6)
> % of cases officer was disciplined or charged with a crime: 0.0% (total: 0)
[in-text-ad]

14. Idaho
> Documented police killings per 100,000 people (2013-2022): 4.4 (total: 79 — 16th fewest)
> Worst year for documented killings: 2021: 14
> % of those killed who were Black: 1.5% (total: 1)
> % of those killed who did not have a gun: 33.3% (total: 25)
> % of those killed who were fleeing: 32.2% (total: 19)
> % of cases officer was disciplined or charged with a crime: 2.1% (total: 1)
[recirclink id=1196191]

13. Louisiana
> Documented police killings per 100,000 people (2013-2022): 4.7 (total: 219 — 17th most)
> Worst year for documented killings: 2015: 29
> % of those killed who were Black: 55.6% (total: 110)
> % of those killed who did not have a gun: 44.4% (total: 92)
> % of those killed who were fleeing: 30.9% (total: 46)
> % of cases officer was disciplined or charged with a crime: 7.1% (total: 10)
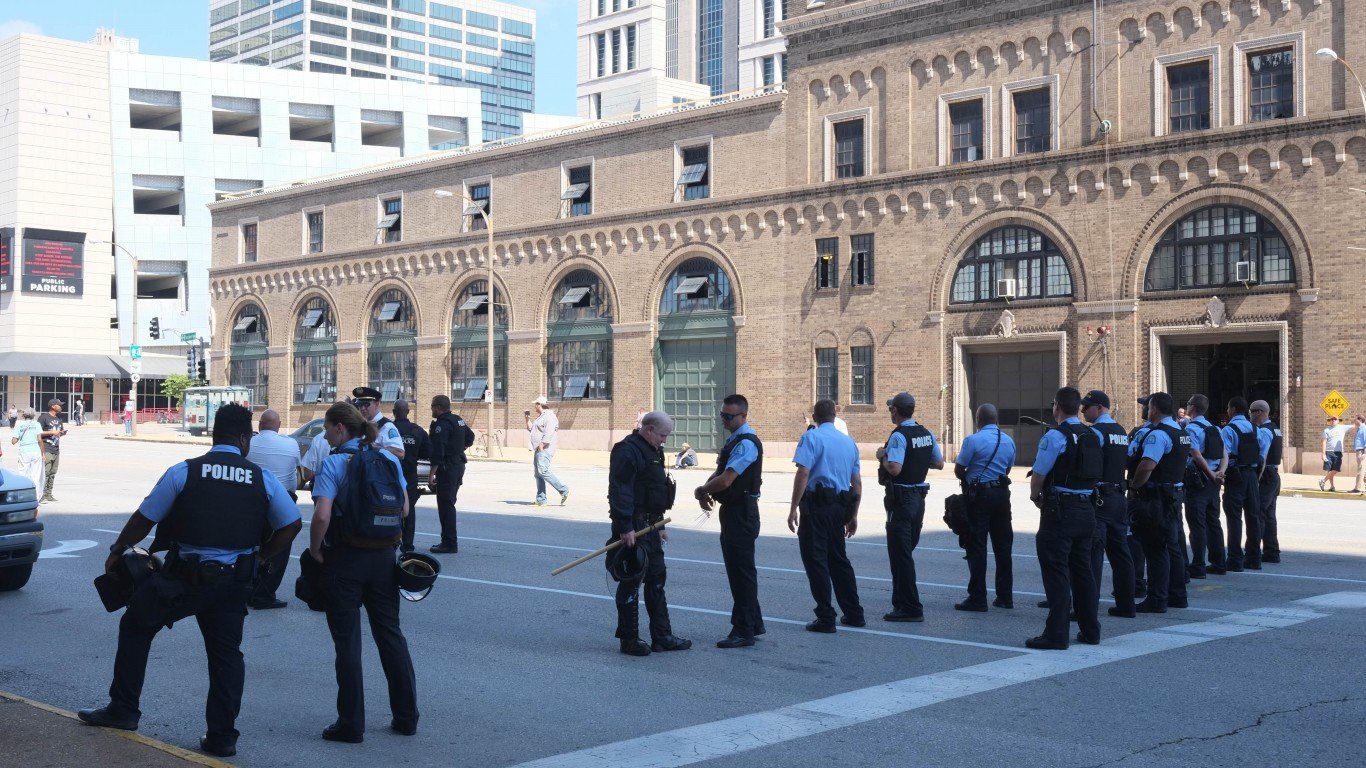
12. Missouri
> Documented police killings per 100,000 people (2013-2022): 4.8 (total: 295 — 11th most)
> Worst year for documented killings: tied — 2017, 2019: 35
> % of those killed who were Black: 39.4% (total: 95)
> % of those killed who did not have a gun: 37.2% (total: 106)
> % of those killed who were fleeing: 38.4% (total: 73)
> % of cases officer was disciplined or charged with a crime: 2.7% (total: 5)
[in-text-ad-2]
11. Arkansas
> Documented police killings per 100,000 people (2013-2022): 4.9 (total: 147 — 22nd fewest)
> Worst year for documented killings: tied — 2018, 2019: 21
> % of those killed who were Black: 31.5% (total: 41)
> % of those killed who did not have a gun: 45.0% (total: 63)
> % of those killed who were fleeing: 26.9% (total: 29)
> % of cases officer was disciplined or charged with a crime: 1.8% (total: 2)
10. Mississippi
> Documented police killings per 100,000 people (2013-2022): 5.3 (total: 158 — 24th fewest)
> Worst year for documented killings: 2019: 28
> % of those killed who were Black: 47.8% (total: 64)
> % of those killed who did not have a gun: 44.8% (total: 64)
> % of those killed who were fleeing: 42.1% (total: 40)
> % of cases officer was disciplined or charged with a crime: 7.1% (total: 7)
[in-text-ad]
9. West Virginia
> Documented police killings per 100,000 people (2013-2022): 5.4 (total: 98 — 17th fewest)
> Worst year for documented killings: tied — 2019, 2022: 13
> % of those killed who were Black: 13.8% (total: 11)
> % of those killed who did not have a gun: 41.1% (total: 37)
> % of those killed who were fleeing: 37.9% (total: 25)
> % of cases officer was disciplined or charged with a crime: 0.0% (total: 0)
[recirclink id=1194031]
8. Nevada
> Documented police killings per 100,000 people (2013-2022): 5.9 (total: 179 — 24th most)
> Worst year for documented killings: 2020: 26
> % of those killed who were Black: 18.9% (total: 30)
> % of those killed who did not have a gun: 42.9% (total: 73)
> % of those killed who were fleeing: 34.7% (total: 43)
> % of cases officer was disciplined or charged with a crime: 1.9% (total: 2)
7. Montana
> Documented police killings per 100,000 people (2013-2022): 6.0 (total: 65 — 13th fewest)
> Worst year for documented killings: 2020: 11
> % of those killed who were Black: 3.7% (total: 2)
> % of those killed who did not have a gun: 38.3% (total: 23)
> % of those killed who were fleeing: 41.5% (total: 17)
> % of cases officer was disciplined or charged with a crime: 0.0% (total: 0)
[in-text-ad-2]
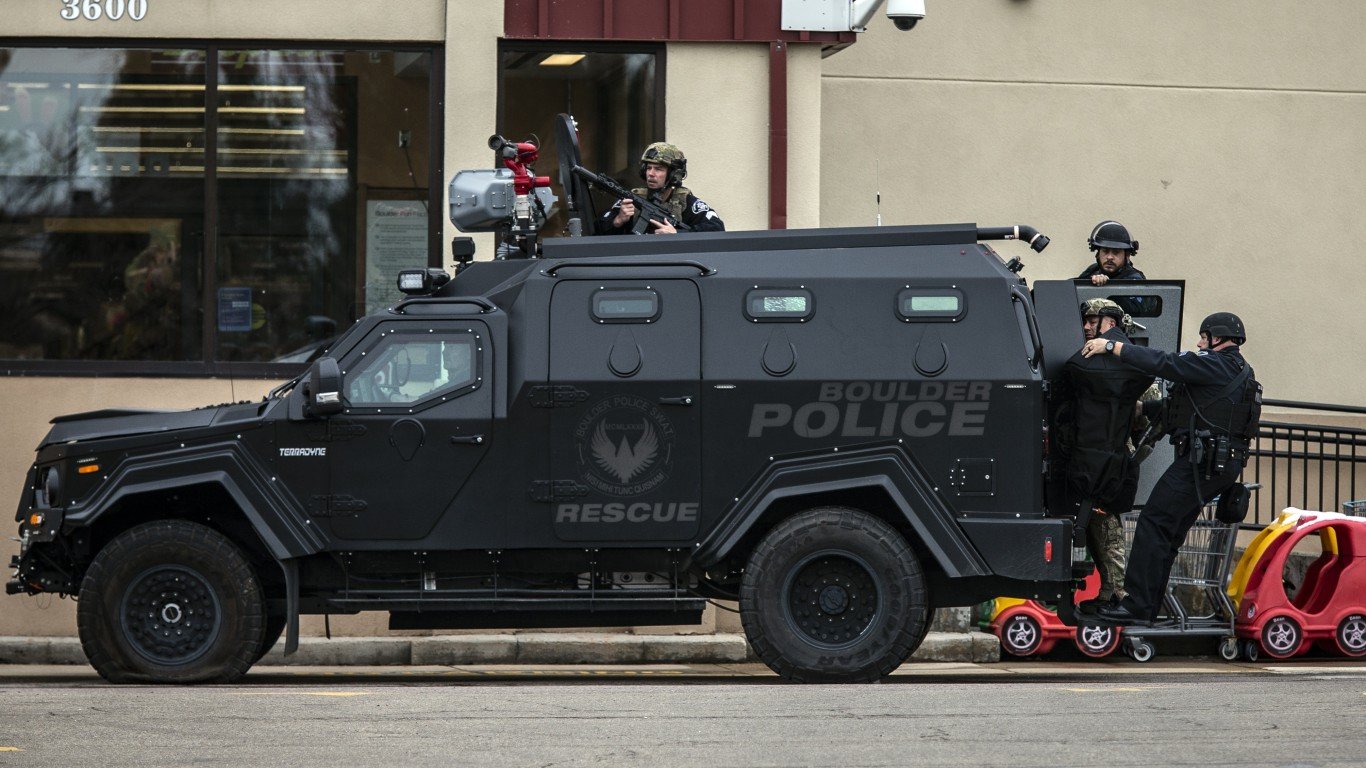
6. Colorado
> Documented police killings per 100,000 people (2013-2022): 6.2 (total: 352 — 6th most)
> Worst year for documented killings: 2018: 48
> % of those killed who were Black: 11.1% (total: 34)
> % of those killed who did not have a gun: 38.7% (total: 129)
> % of those killed who were fleeing: 41.9% (total: 108)
> % of cases officer was disciplined or charged with a crime: 1.5% (total: 4)
5. Wyoming
> Documented police killings per 100,000 people (2013-2022): 6.2 (total: 36 — 6th fewest)
> Worst year for documented killings: 2022: 10
> % of those killed who were Black: 10.3% (total: 3)
> % of those killed who did not have a gun: 48.5% (total: 16)
> % of those killed who were fleeing: 34.6% (total: 9)
> % of cases officer was disciplined or charged with a crime: 0.0% (total: 0)
[in-text-ad]
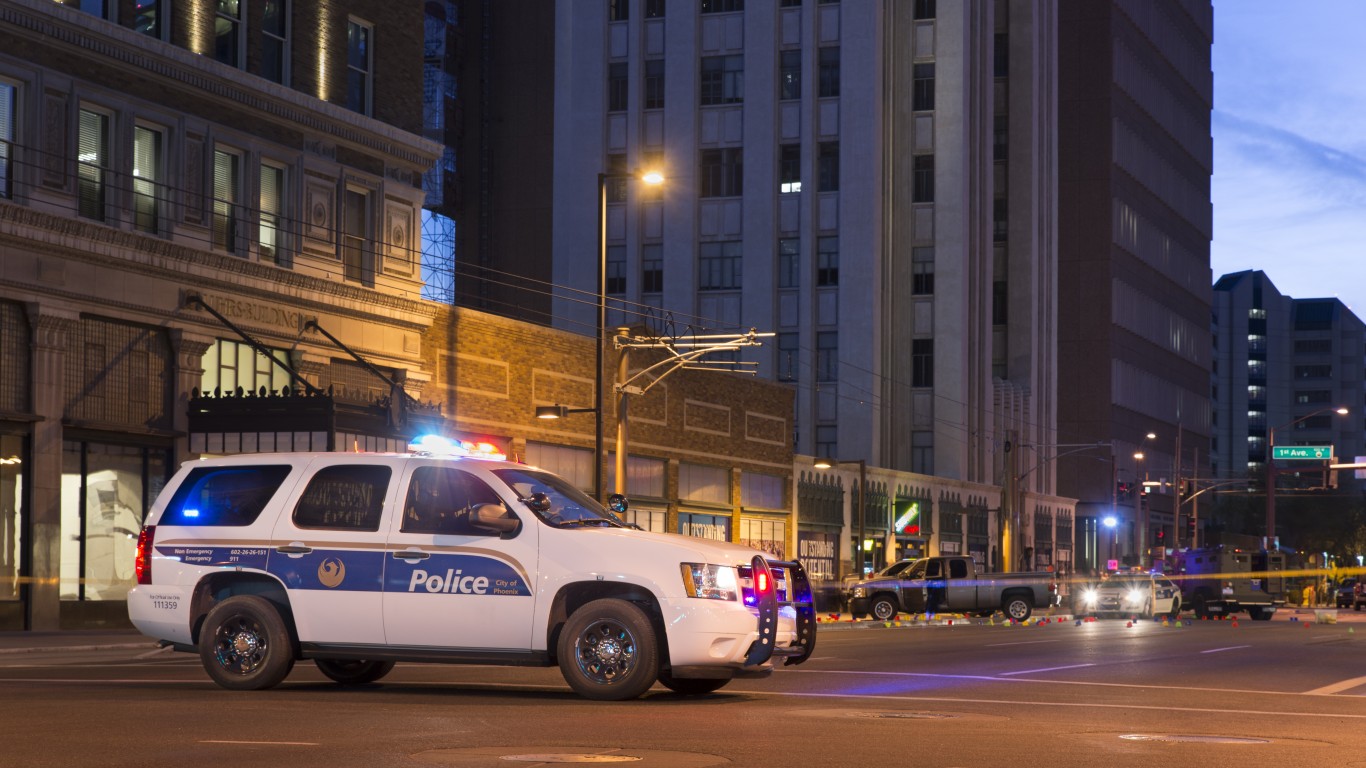
4. Arizona
> Documented police killings per 100,000 people (2013-2022): 6.9 (total: 492 — 4th most)
> Worst year for documented killings: 2018: 67
> % of those killed who were Black: 11.9% (total: 49)
> % of those killed who did not have a gun: 46.5% (total: 220)
> % of those killed who were fleeing: 30.5% (total: 103)
> % of cases officer was disciplined or charged with a crime: 1.1% (total: 3)
[recirclink id=1192219]
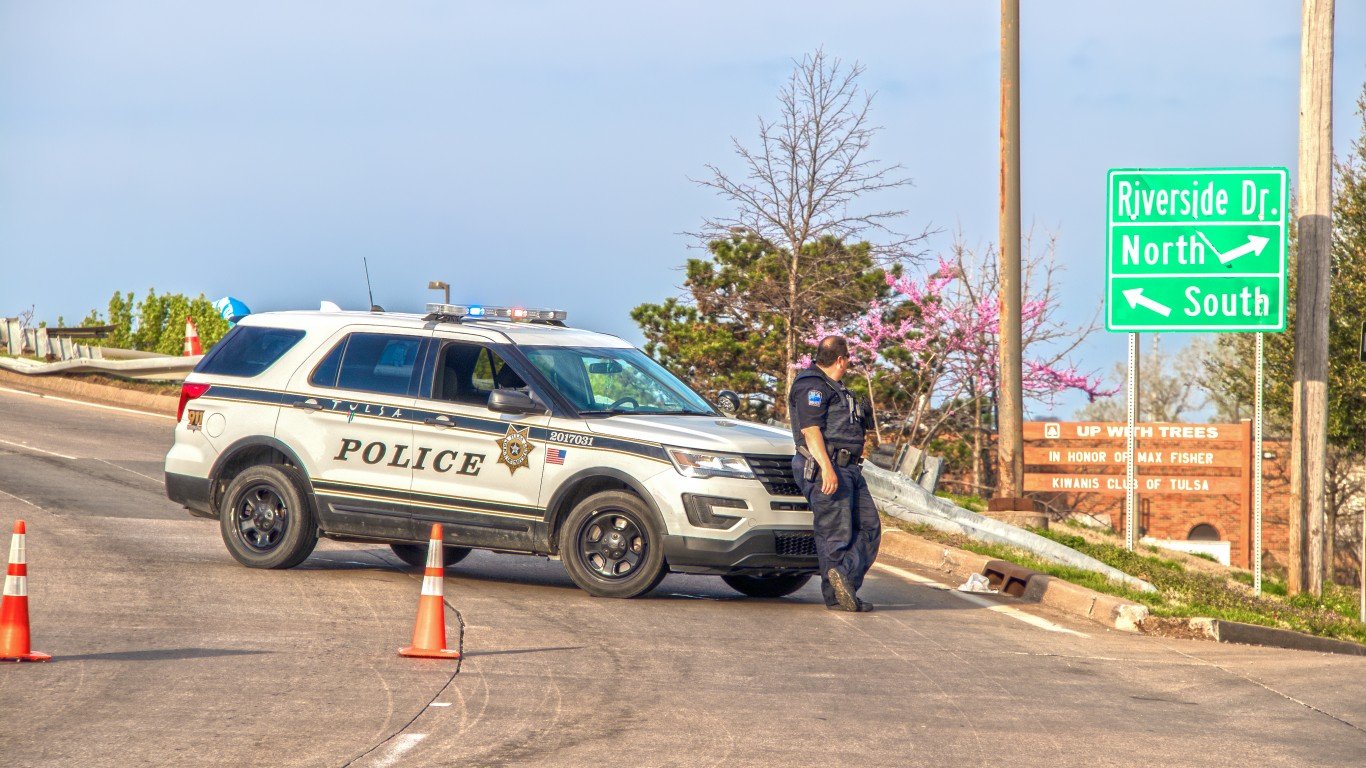
3. Oklahoma
> Documented police killings per 100,000 people (2013-2022): 7.5 (total: 296 — 10th most)
> Worst year for documented killings: tied — 2015, 2019: 37
> % of those killed who were Black: 22.7% (total: 63)
> % of those killed who did not have a gun: 50.3% (total: 144)
> % of those killed who were fleeing: 35.4% (total: 74)
> % of cases officer was disciplined or charged with a crime: 4.4% (total: 9)
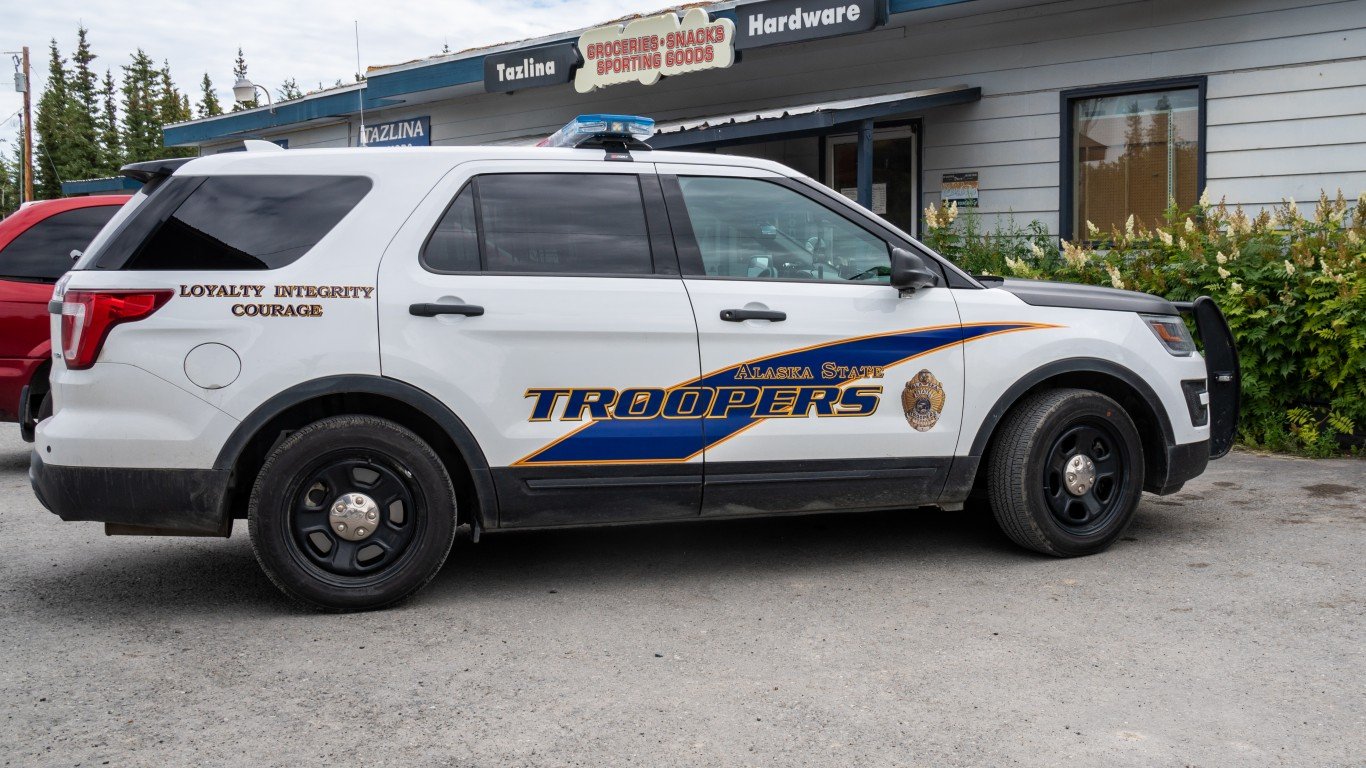
2. Alaska
> Documented police killings per 100,000 people (2013-2022): 8.8 (total: 65 — 13th fewest)
> Worst year for documented killings: 2020: 9
> % of those killed who were Black: 9.4% (total: 5)
> % of those killed who did not have a gun: 43.8% (total: 28)
> % of those killed who were fleeing: 37.3% (total: 19)
> % of cases officer was disciplined or charged with a crime: 0.0% (total: 0)
[in-text-ad-2]
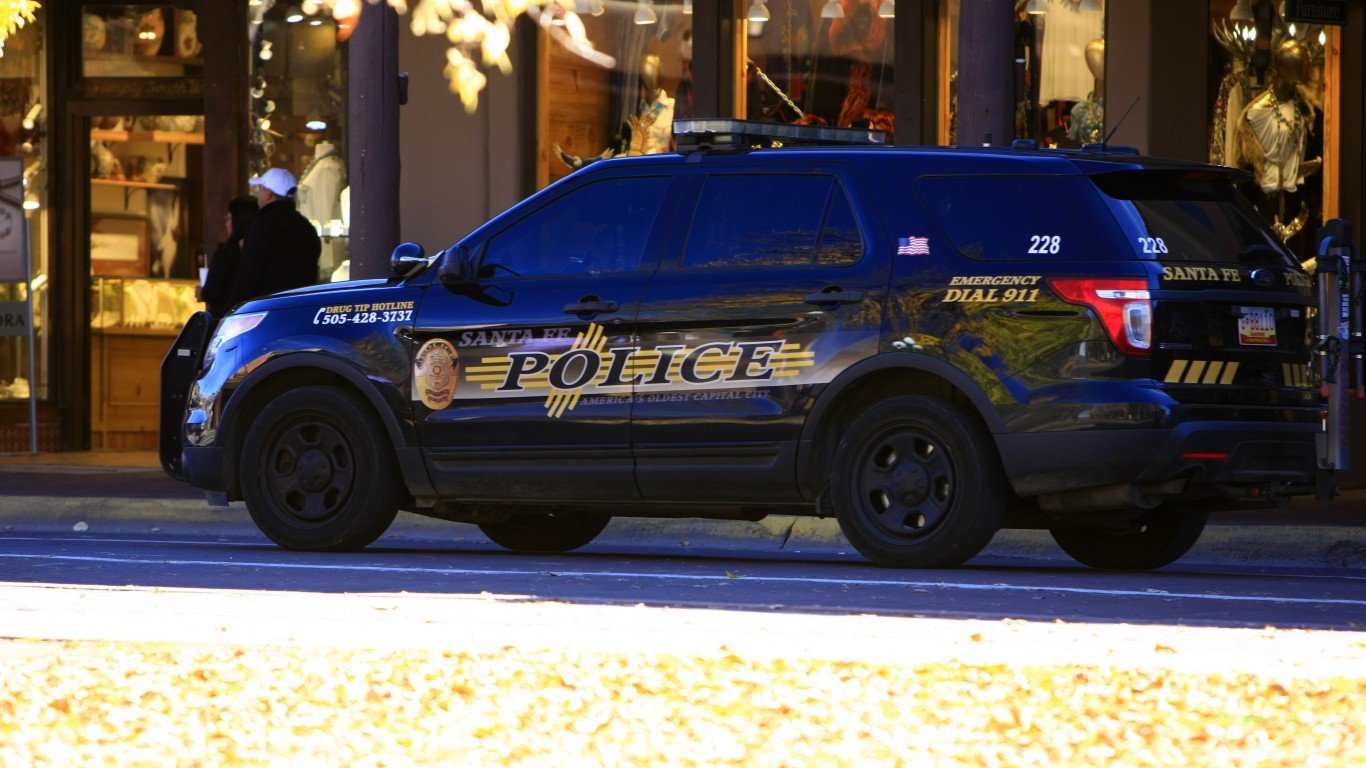
1. New Mexico
> Documented police killings per 100,000 people (2013-2022): 10.6 (total: 223 — 16th most)
> Worst year for documented killings: 2022: 32
> % of those killed who were Black: 5.1% (total: 10)
> % of those killed who did not have a gun: 38.1% (total: 80)
> % of those killed who were fleeing: 40.3% (total: 62)
> % of cases officer was disciplined or charged with a crime: 2.4% (total: 3)
Methodology
To determine the states with the most killings by police departments, 24/7 Wall St. reviewed data from Mapping Police Violence, a research collaborative that collects data on police killings across the nation from the country’s three largest comprehensive and impartial crowdsourced databases. Data was accessed on February 22, 2023 and includes all police department killings from 2013 through the end of 2022. Police killings per 100,000 were calculated using five-year 2021 population estimates from the U.S. Census Bureau’s American Community Survey.
The percentages of incidents in which the person killed was Black, did not have a gun, was fleeing, and in which the officer was disciplined or faced criminal charges, the figures were calculated as a percentage of incidents for which information was available in the report rather than all incidents.
Contact [email protected] for any questions or corrections.