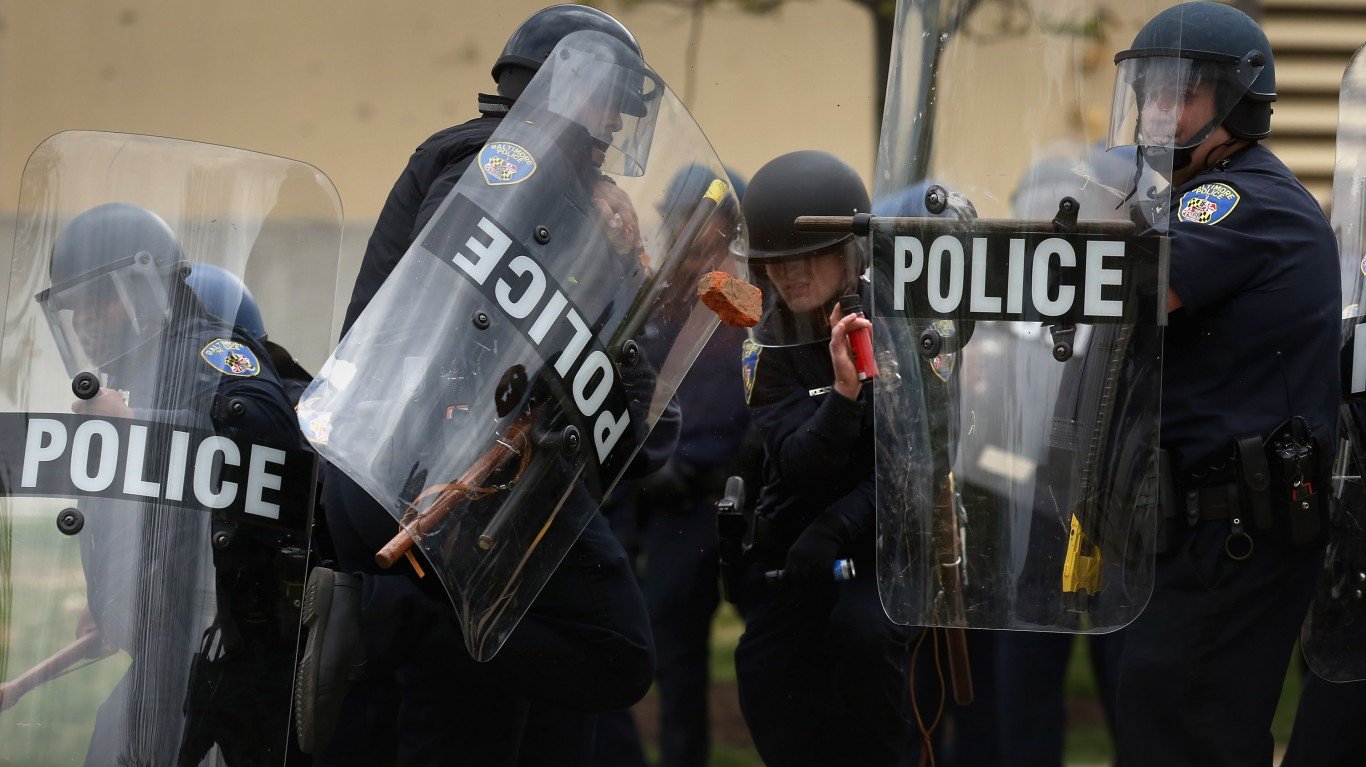
The duties of a police officer in the United States generally include preventing crime, enforcing laws, and arresting suspects. These responsibilities regularly put law enforcement officers in potentially volatile and dangerous situations. As a result, police typically carry a firearm – and they are authorized to use deadly force in cases where a person poses an imminent physical threat to the officer or other individuals.
Of course, such an assessment is often subjective, and whether or not the use of deadly force is justified can be open to interpretation. Some cases are clear cut, whether right or wrong, and others are not. Since 2020, when the murder of George Floyd by a Minneapolis police officer was captured on camera, the use of deadly force by law enforcement agencies across the country has come under intense scrutiny.
Representing an extreme case of the improper police use of deadly force, George Floyd’s murder was the target of widespread media attention and public outrage. But each year in the United States, over 1,000 people are killed by law enforcement, and the majority of those killings are deemed to be justified by oversight officials.
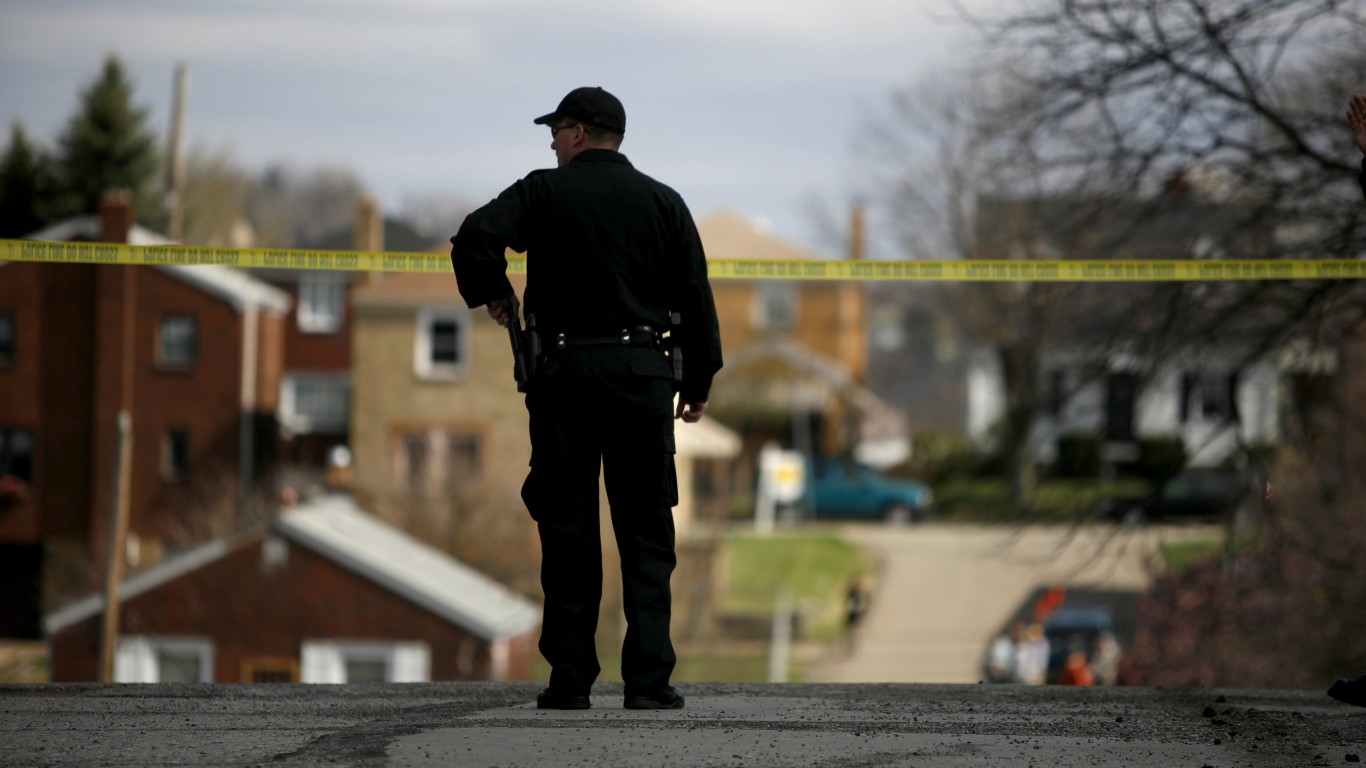
From 2013 to through May 2023, a reported 11,706 people were killed by police officers – both on and off duty – in the United States, according to Mapping Police Violence, a research collaborative that collects data on police killings. Adjusting for population, this comes out to around 3.5 police killings for every 100,000 people. However, in many major U.S. cities, the rate of police killings is far higher.
Using data from Mapping Police Violence, 24/7 Wall St. identified the 30 cities with the most police killings. Cities were ranked by the number of people killed by police officers from 2013 through May 2023 for every 100,000 people. To focus on large to mid-size cities, only cities with populations of at least 100,000 were considered. In every city on this list, there were at least 10 people killed by police for every 100,000 city residents.
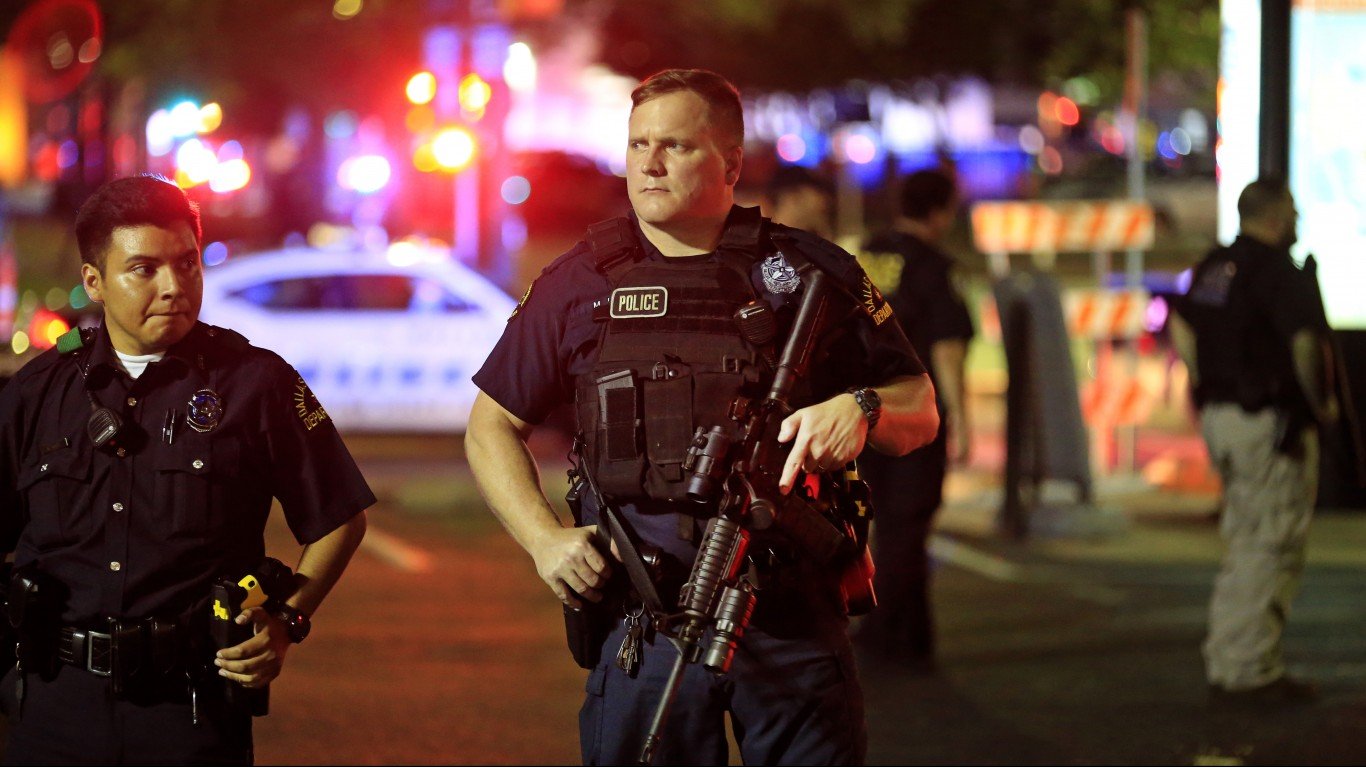
Across the 30 cities on this list, a total of 941 people have been killed by law enforcement since 2013. Of them, 118 were reported to be unarmed and 158 showed signs of a mental illness. Officers involved in those killings, however, are known to have faced consequences – whether professional, civil, or criminal – in only 32 cases. (Here is a look at 25 American cities where police are better funded than health and social services.)
In each of these cities, over 85% of those killed were men. Additionally, while the largest cumulative share of those killed by police in these places were white, in six cities on this list, at least half of all those killed were Black, and in four, over half were Hispanic. (This is how many people your state sends to jail every year.)
Click here to see cities where police have killed the most people since 2013.
Click here to see our detailed methodology.
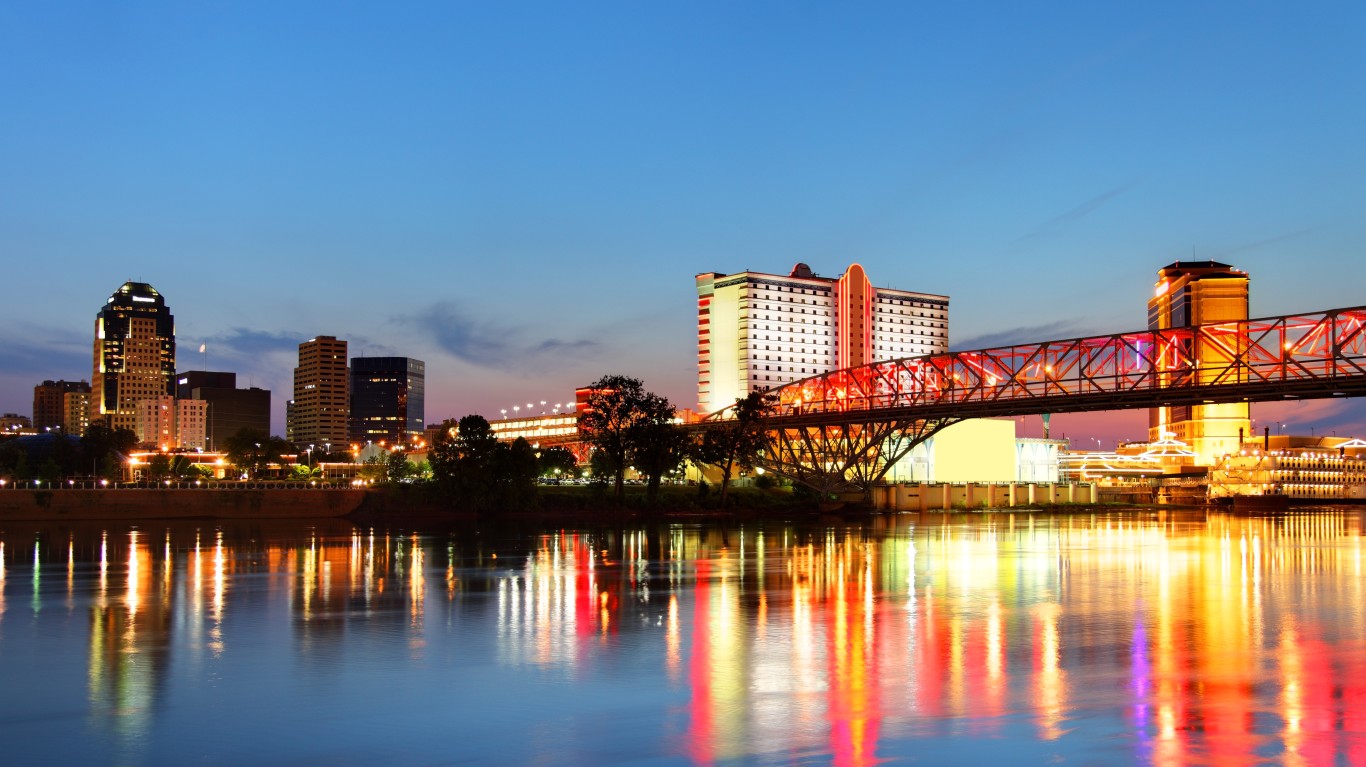
30. Shreveport, LA
> Documented police killings, 2013-2023: 10.0 per 100,000 people (19 total)
> Cases where officers are known to have faced professional/criminal/civil consequences: 1
> Gender of those killed: 100% male
> Race/ethnicity of those killed: 26.3% White, 57.9% Black, 5.3% Hispanic, 5.3% Asian, 0% Native American
> Share of those killed with signs of a mental illness: 10.5%
> Share of those killed who were unarmed: 15.8%
> Population: 189,374
[in-text-ad]
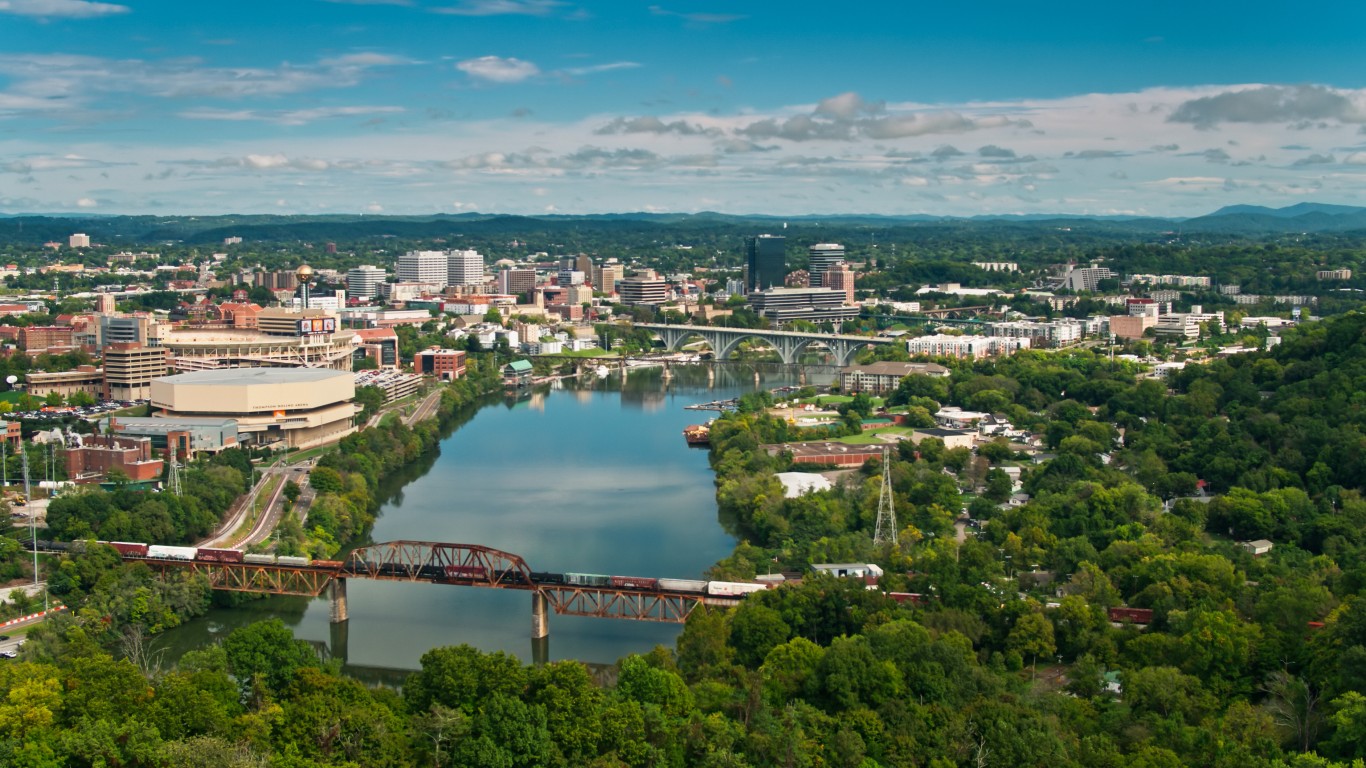
29. Knoxville, TN
> Documented police killings, 2013-2023: 10.0 per 100,000 people (19 total)
> Cases where officers are known to have faced professional/criminal/civil consequences: 1
> Gender of those killed: 94.7% male, 5.3% female
> Race/ethnicity of those killed: 57.9% White, 26.3% Black, 10.5% Hispanic, 0% Asian, 0% Native American
> Share of those killed with signs of a mental illness: 26.3%
> Share of those killed who were unarmed: 21.1%
> Population: 189,339
[recirclink id=1244184]
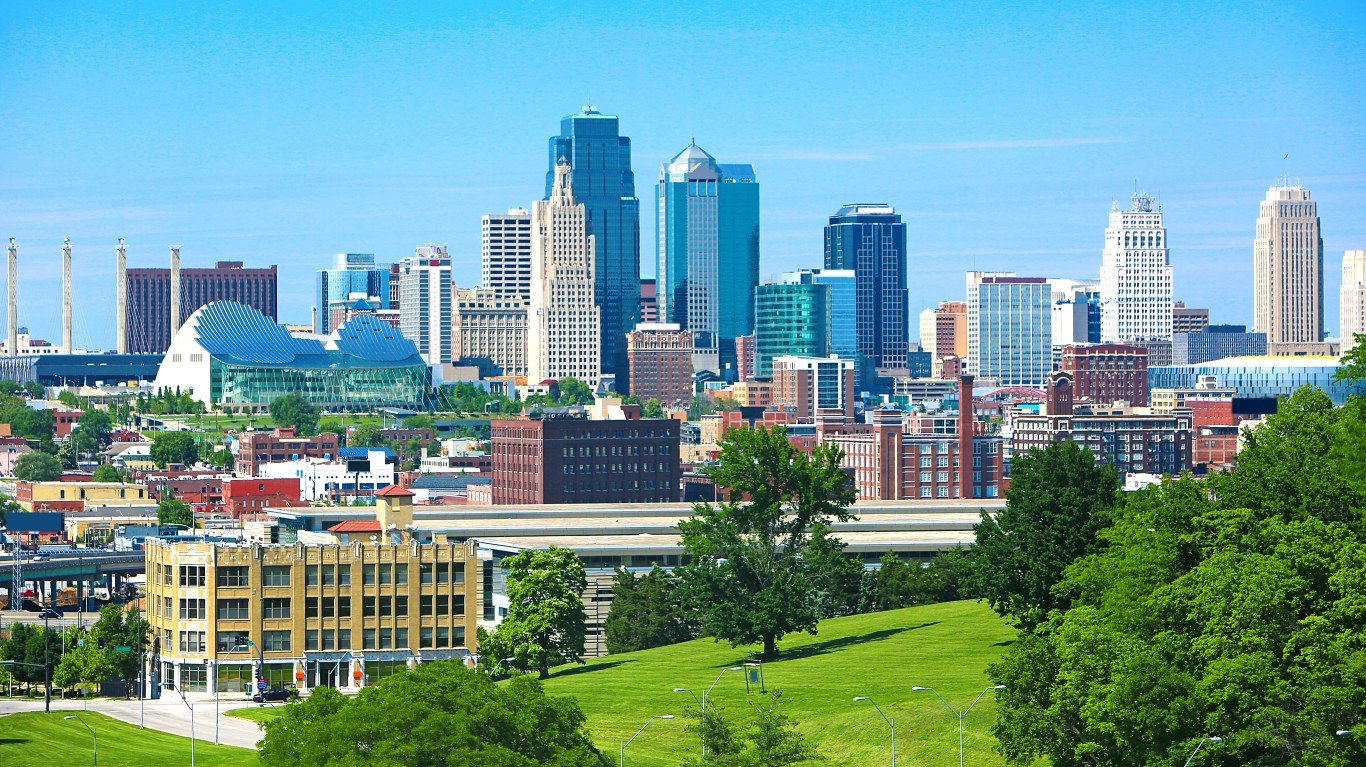
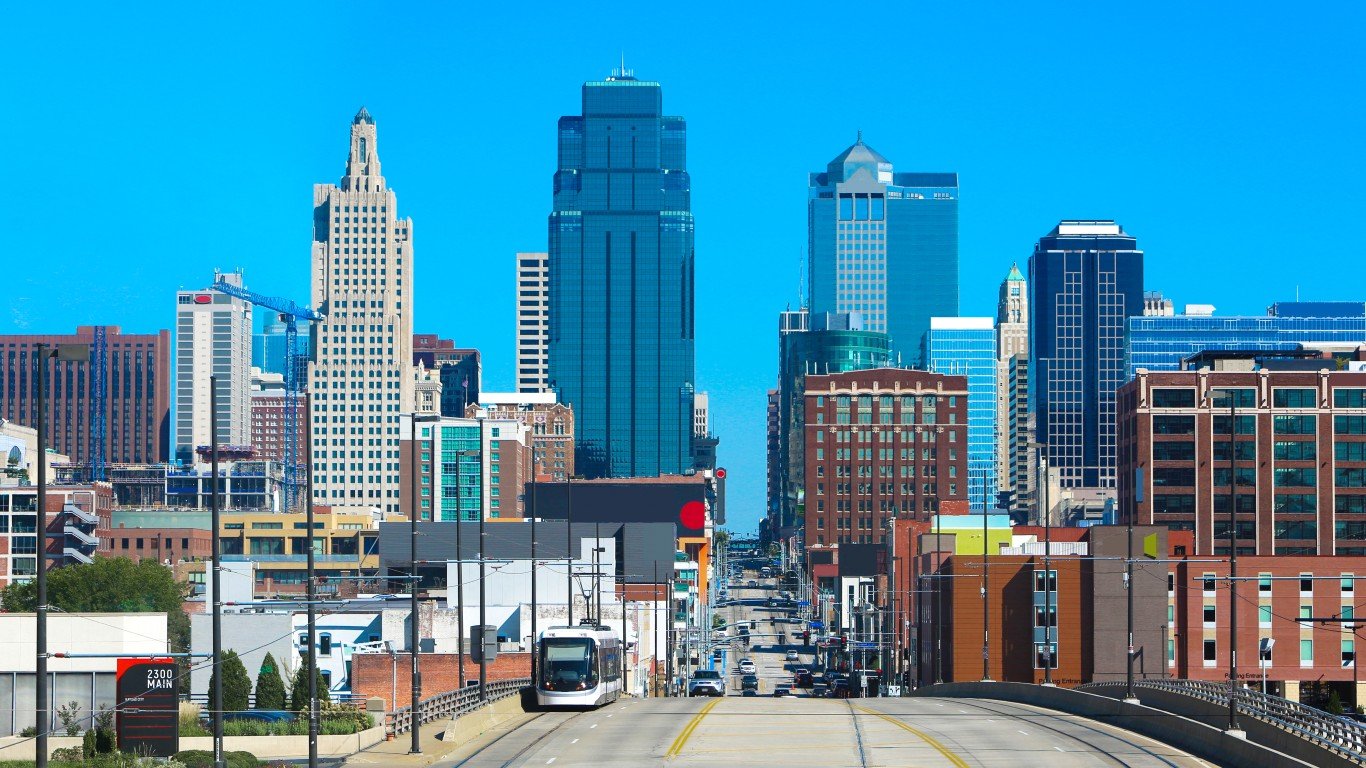
28. Kansas CIty, MO
> Documented police killings, 2013-2023: 10.1 per 100,000 people (51 total)
> Cases where officers are known to have faced professional/criminal/civil consequences: 1
> Gender of those killed: 98.0% male, 2.0% female
> Race/ethnicity of those killed: 33.3% White, 45.1% Black, 2.0% Hispanic, 0% Asian, 0% Native American
> Share of those killed with signs of a mental illness: 15.7%
> Share of those killed who were unarmed: 11.8%
> Population: 502,597
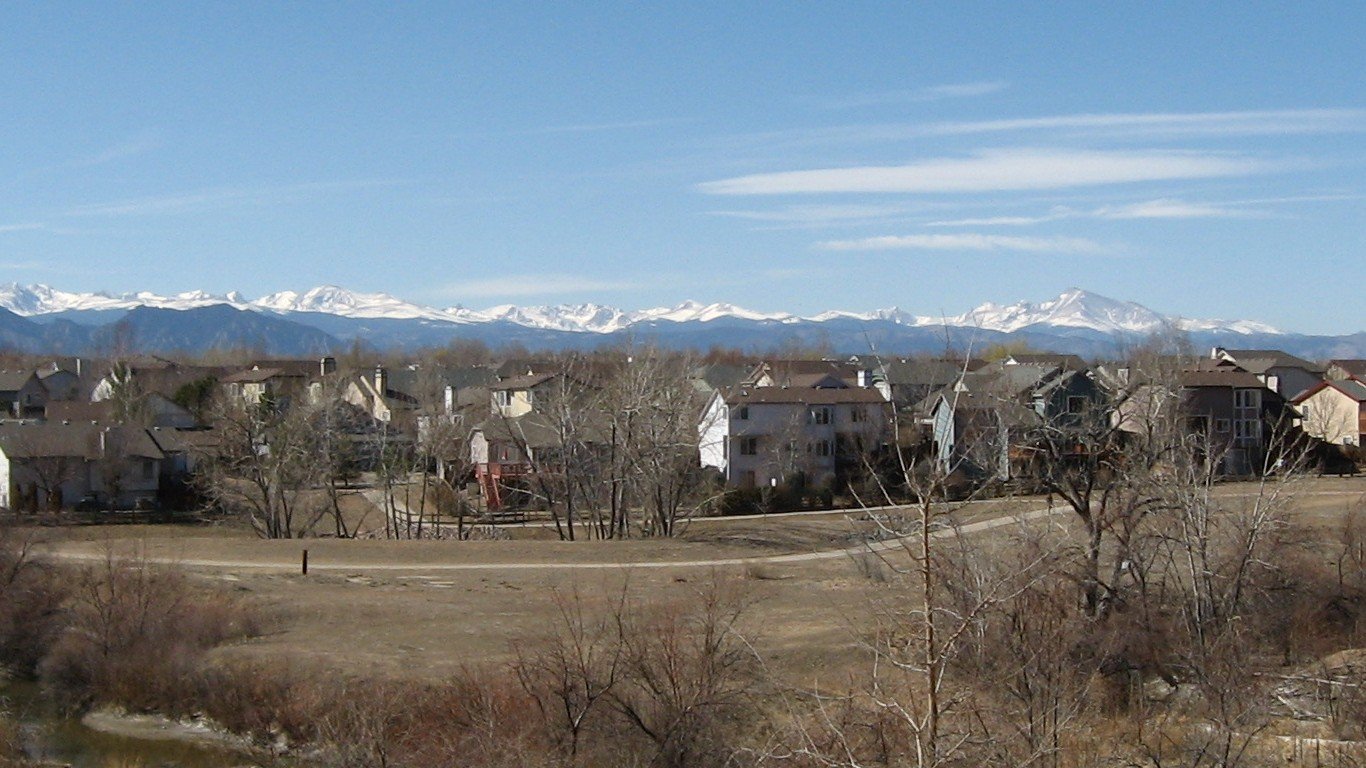
27. Westminster, CO
> Documented police killings, 2013-2023: 10.4 per 100,000 people (12 total)
> Cases where officers are known to have faced professional/criminal/civil consequences: 0
> Gender of those killed: 100% male
> Race/ethnicity of those killed: 66.7% White, 0% Black, 16.7% Hispanic, 0% Asian, 0% Native American
> Share of those killed with signs of a mental illness: 0%
> Share of those killed who were unarmed: 8.3%
> Population: 115,535
[in-text-ad-2]

26. Midland, TX
> Documented police killings, 2013-2023: 10.7 per 100,000 people (14 total)
> Cases where officers are known to have faced professional/criminal/civil consequences: 0
> Gender of those killed: 85.7% male, 14.3% female
> Race/ethnicity of those killed: 35.7% White, 7.1% Black, 35.7% Hispanic, 0% Asian, 7.1% Native American
> Share of those killed with signs of a mental illness: 7.1%
> Share of those killed who were unarmed: 14.3%
> Population: 130,765

25. Birmingham, AL
> Documented police killings, 2013-2023: 10.9 per 100,000 people (22 total)
> Cases where officers are known to have faced professional/criminal/civil consequences: 1
> Gender of those killed: 95.5% male, 4.5% female
> Race/ethnicity of those killed: 36.4% White, 59.1% Black, 4.5% Hispanic, 0% Asian, 0% Native American
> Share of those killed with signs of a mental illness: 4.5%
> Share of those killed who were unarmed: 18.2%
> Population: 202,234
[in-text-ad]
24. Kansas City, KS
> Documented police killings, 2013-2023: 10.9 per 100,000 people (17 total)
> Cases where officers are known to have faced professional/criminal/civil consequences: 0
> Gender of those killed: 100% male
> Race/ethnicity of those killed: 47.1% White, 23.5% Black, 23.5% Hispanic, 0% Asian, 0% Native American
> Share of those killed with signs of a mental illness: 0%
> Share of those killed who were unarmed: 11.8%
> Population: 155,745
[recirclink id=1245064]
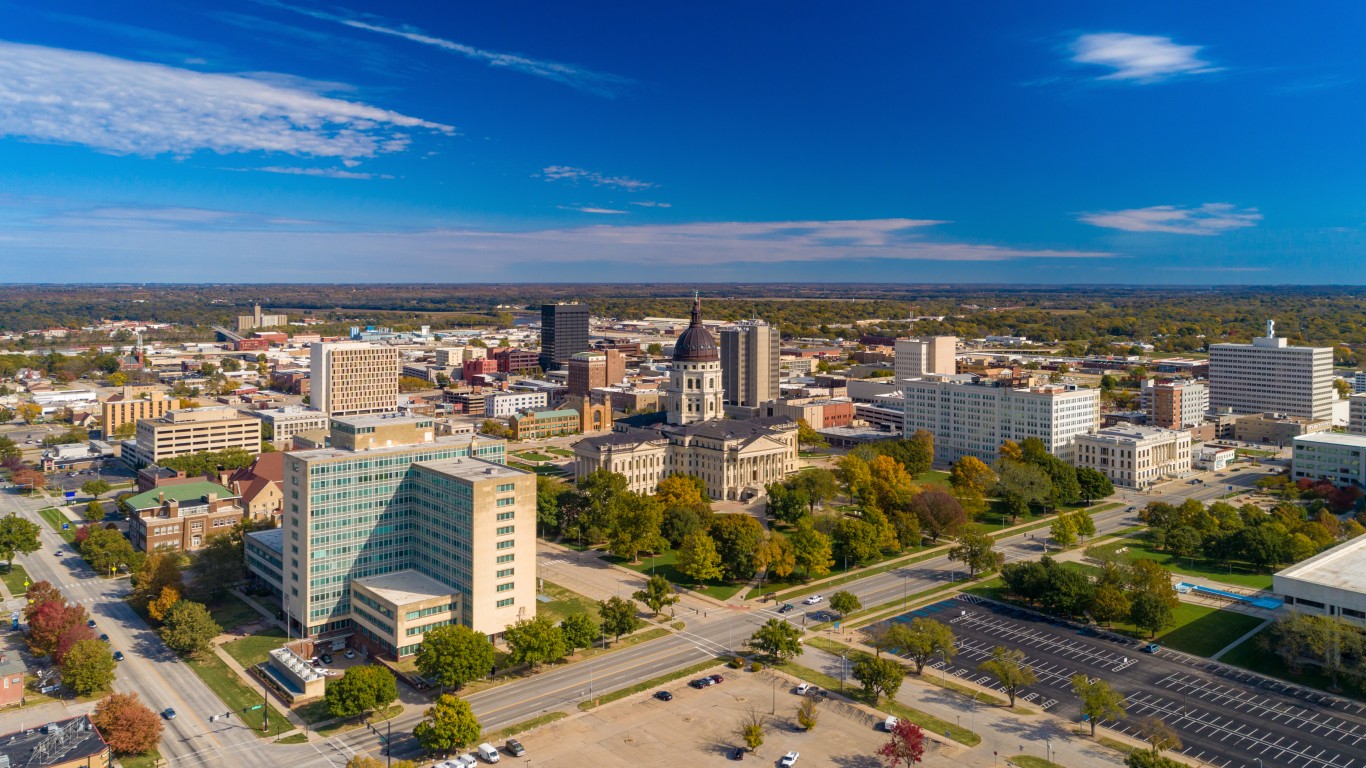
23. Topeka, KS
> Documented police killings, 2013-2023: 11.0 per 100,000 people (14 total)
> Cases where officers are known to have faced professional/criminal/civil consequences: 0
> Gender of those killed: 100% male
> Race/ethnicity of those killed: 42.9% White, 35.7% Black, 14.3% Hispanic, 0% Asian, 0% Native American
> Share of those killed with signs of a mental illness: 14.3%
> Share of those killed who were unarmed: 0%
> Population: 126,802

22. Tempe, AZ
> Documented police killings, 2013-2023: 11.2 per 100,000 people (20 total)
> Cases where officers are known to have faced professional/criminal/civil consequences: 0
> Gender of those killed: 95.0% male, 5.0% female
> Race/ethnicity of those killed: 15.0% White, 25.0% Black, 40% Hispanic, 0% Asian, 5.0% Native American
> Share of those killed with signs of a mental illness: 10%
> Share of those killed who were unarmed: 25.0%
> Population: 178,862
[in-text-ad-2]
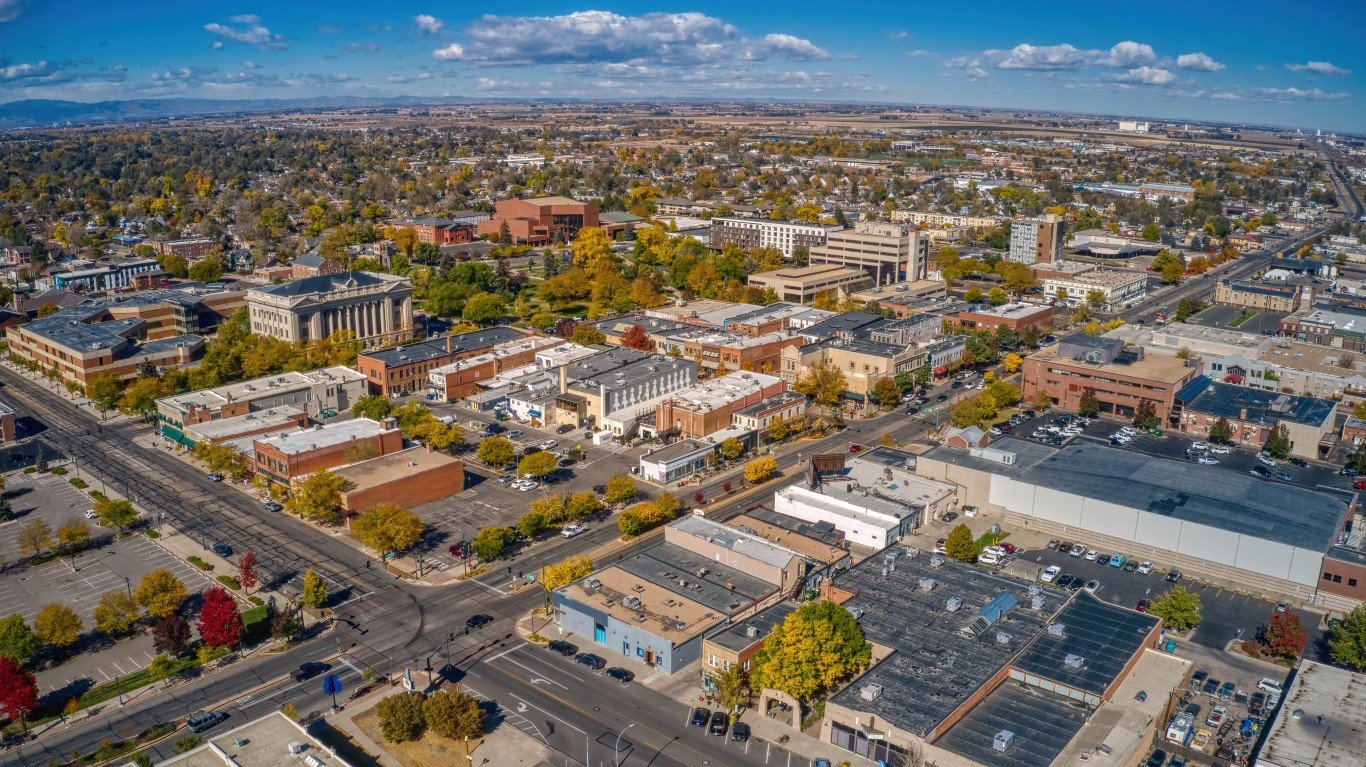
21. Greeley, CO
> Documented police killings, 2013-2023: 11.2 per 100,000 people (12 total)
> Cases where officers are known to have faced professional/criminal/civil consequences: 0
> Gender of those killed: 100% male
> Race/ethnicity of those killed: 8.3% White, 0% Black, 83.3% Hispanic, 0% Asian, 0% Native American
> Share of those killed with signs of a mental illness: 8.3%
> Share of those killed who were unarmed: 8.3%
> Population: 107,014
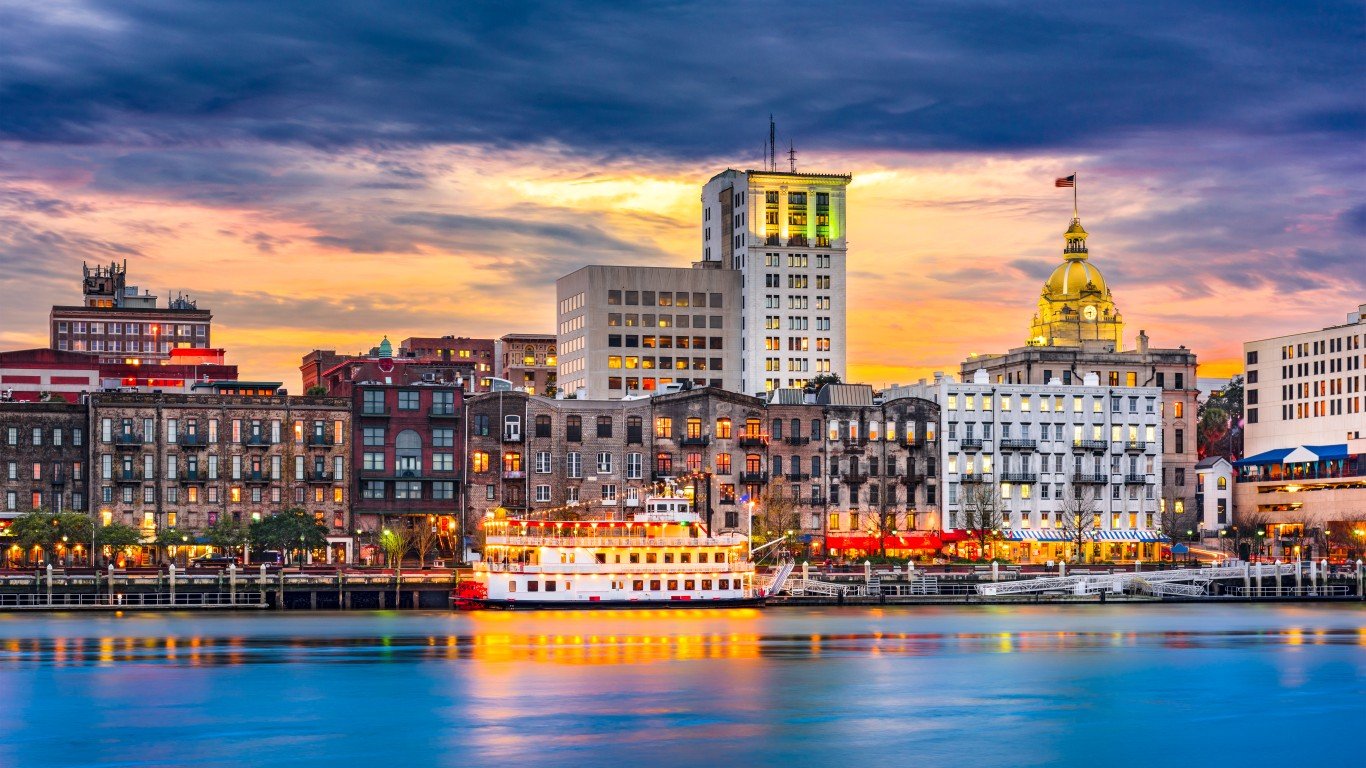
20. Savannah, GA
> Documented police killings, 2013-2023: 11.5 per 100,000 people (17 total)
> Cases where officers are known to have faced professional/criminal/civil consequences: 0
> Gender of those killed: 94.1% male, 5.9% female
> Race/ethnicity of those killed: 17.6% White, 64.7% Black, 0% Hispanic, 0% Asian, 0% Native American
> Share of those killed with signs of a mental illness: 0%
> Share of those killed who were unarmed: 5.9%
> Population: 147,930
[in-text-ad]

19. Spokane, WA
> Documented police killings, 2013-2023: 11.5 per 100,000 people (26 total)
> Cases where officers are known to have faced professional/criminal/civil consequences: 3
> Gender of those killed: 96.2% male, 3.8% female
> Race/ethnicity of those killed: 69.2% White, 3.8% Black, 0% Hispanic, 0% Asian, 7.7% Native American
> Share of those killed with signs of a mental illness: 7.7%
> Share of those killed who were unarmed: 7.7%
> Population: 225,709
[recirclink id=1258960]
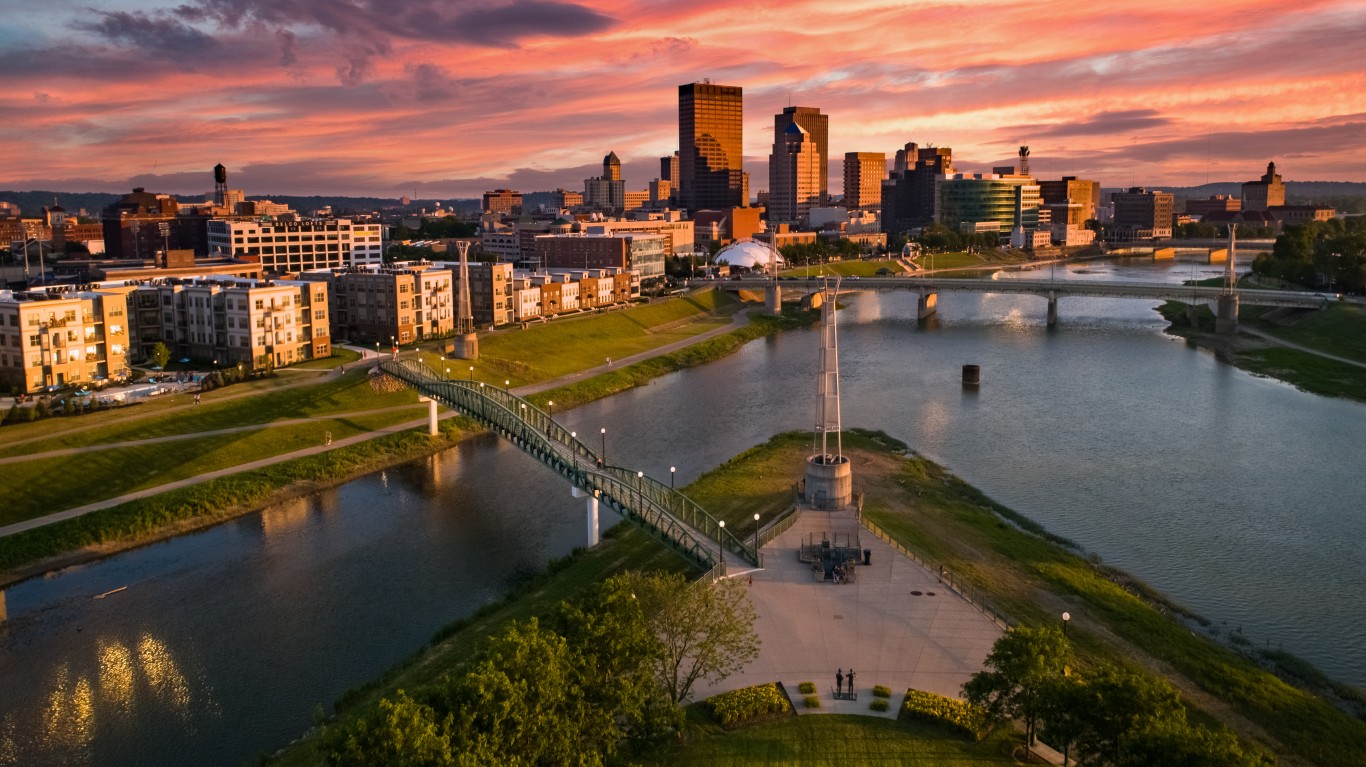
18. Dayton, OH
> Documented police killings, 2013-2023: 11.6 per 100,000 people (16 total)
> Cases where officers are known to have faced professional/criminal/civil consequences: 0
> Gender of those killed: 87.5% male, 12.5% female
> Race/ethnicity of those killed: 50% White, 50% Black, 0% Hispanic, 0% Asian, 0% Native American
> Share of those killed with signs of a mental illness: 18.8%
> Share of those killed who were unarmed: 0%
> Population: 138,416
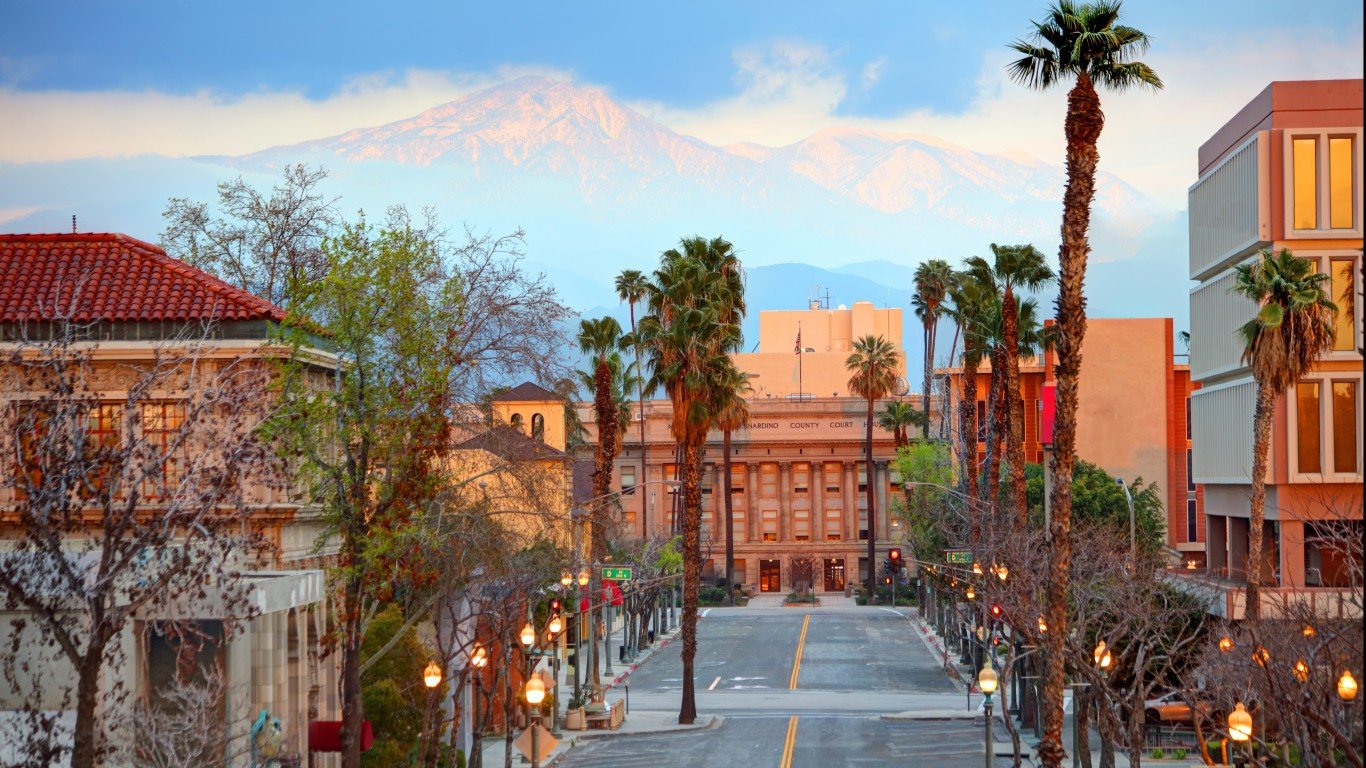
17. San Bernardino, CA
> Documented police killings, 2013-2023: 11.8 per 100,000 people (26 total)
> Cases where officers are known to have faced professional/criminal/civil consequences: 1
> Gender of those killed: 100% male
> Race/ethnicity of those killed: 23.1% White, 11.5% Black, 38.5% Hispanic, 3.8% Asian, 0% Native American
> Share of those killed with signs of a mental illness: 7.7%
> Share of those killed who were unarmed: 3.8%
> Population: 220,821
[in-text-ad-2]

16. Lakeland, FL
> Documented police killings, 2013-2023: 11.8 per 100,000 people (13 total)
> Cases where officers are known to have faced professional/criminal/civil consequences: 0
> Gender of those killed: 92.3% male, 7.7% female
> Race/ethnicity of those killed: 61.5% White, 15.4% Black, 7.7% Hispanic, 0% Asian, 0% Native American
> Share of those killed with signs of a mental illness: 38.5%
> Share of those killed who were unarmed: 0%
> Population: 110,401
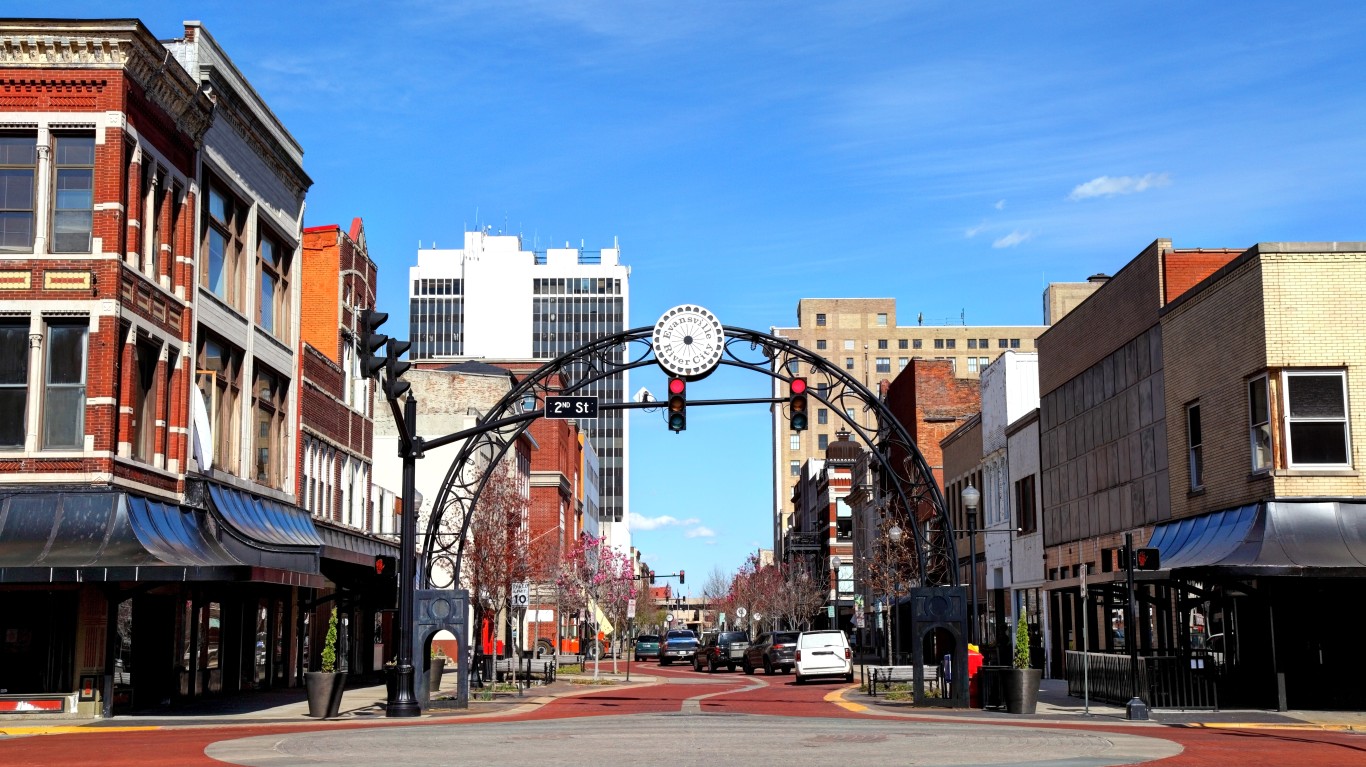
15. Evansville, IN
> Documented police killings, 2013-2023: 11.9 per 100,000 people (14 total)
> Cases where officers are known to have faced professional/criminal/civil consequences: 1
> Gender of those killed: 100% male
> Race/ethnicity of those killed: 57.1% White, 14.3% Black, 14.3% Hispanic, 0% Asian, 0% Native American
> Share of those killed with signs of a mental illness: 35.7%
> Share of those killed who were unarmed: 21.4%
> Population: 117,184
[in-text-ad]

14. Sparks, NV
> Documented police killings, 2013-2023: 12.2 per 100,000 people (13 total)
> Cases where officers are known to have faced professional/criminal/civil consequences: 0
> Gender of those killed: 92.3% male, 7.7% female
> Race/ethnicity of those killed: 30.8% White, 7.7% Black, 46.2% Hispanic, 0% Asian, 7.7% Native American
> Share of those killed with signs of a mental illness: 23.1%
> Share of those killed who were unarmed: 0%
> Population: 106,900
[recirclink id=1194031]
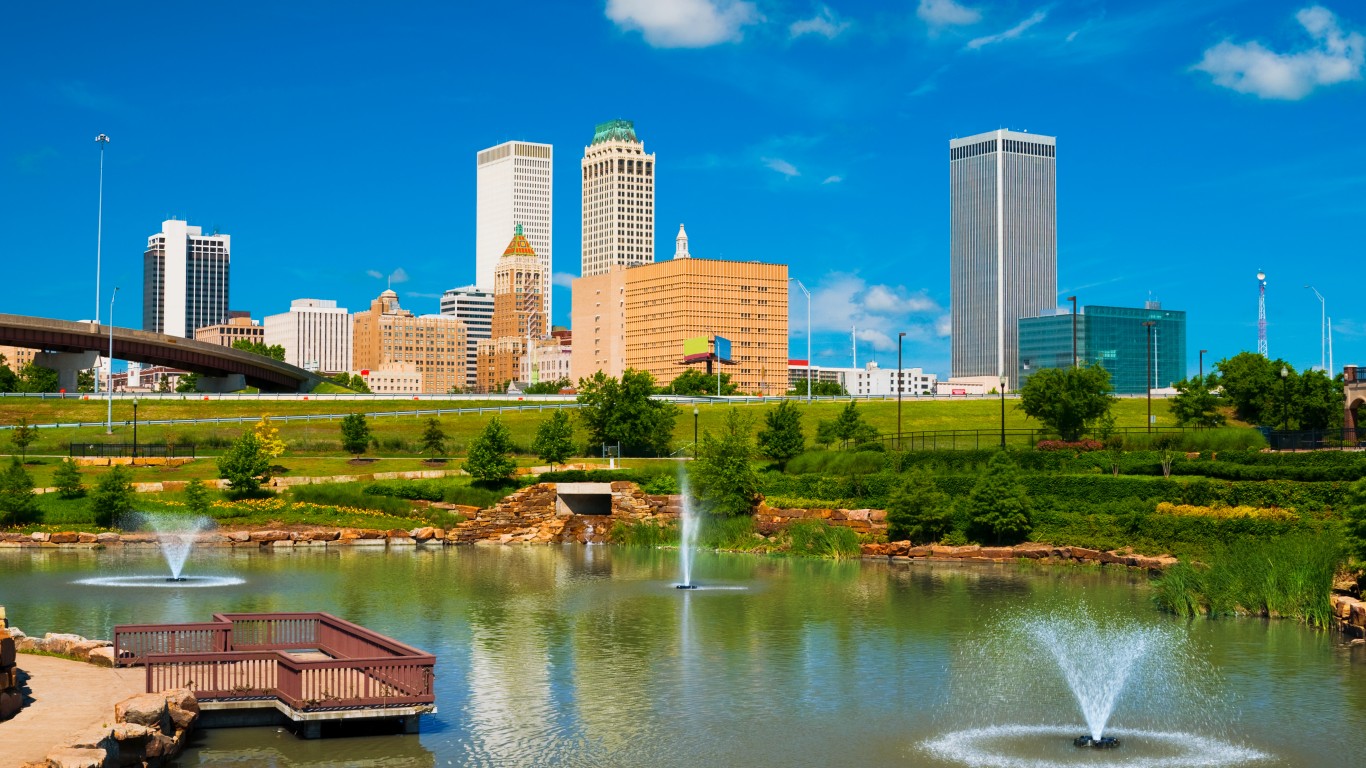
13. Tulsa, OK
> Documented police killings, 2013-2023: 12.4 per 100,000 people (51 total)
> Cases where officers are known to have faced professional/criminal/civil consequences: 5
> Gender of those killed: 96.1% male, 3.9% female
> Race/ethnicity of those killed: 51.0% White, 25.5% Black, 13.7% Hispanic, 2.0% Asian, 0% Native American
> Share of those killed with signs of a mental illness: 21.6%
> Share of those killed who were unarmed: 21.6%
> Population: 410,652
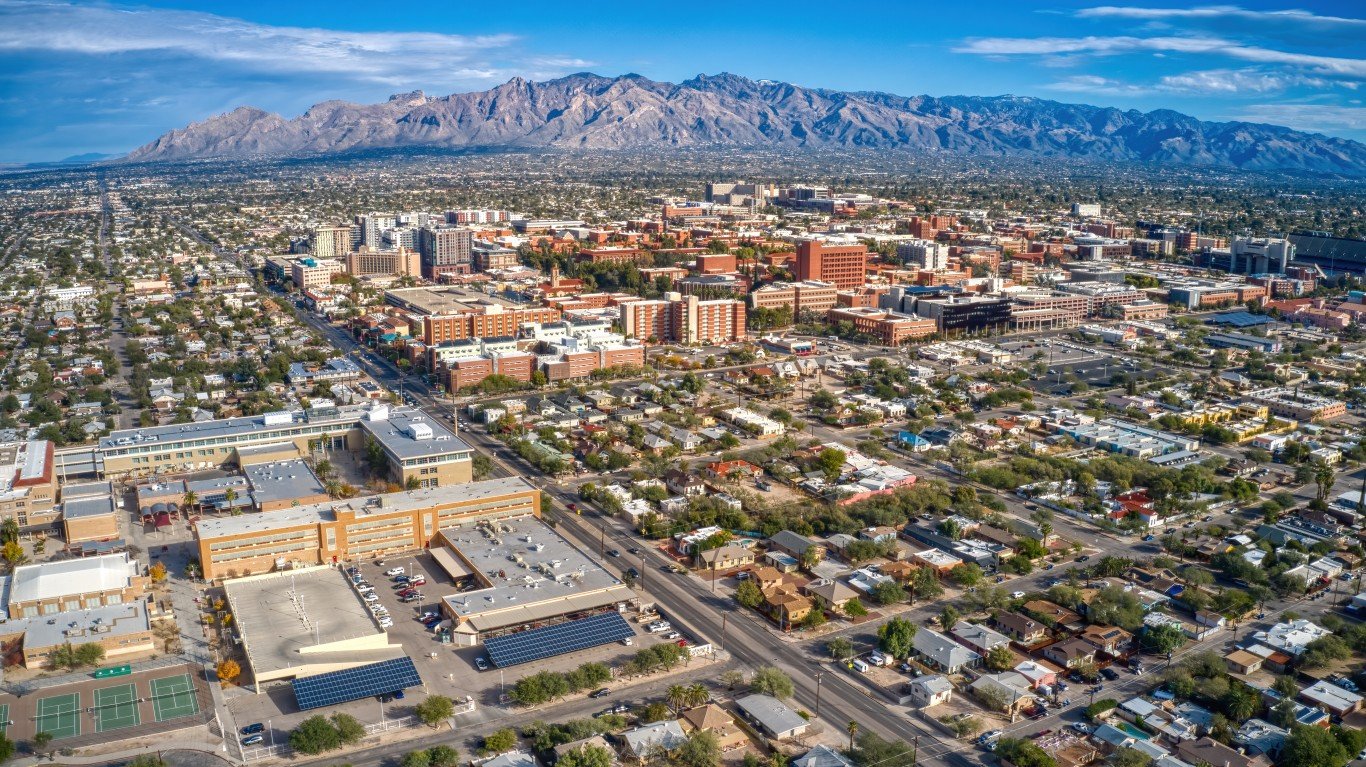
12. Tucson, AZ
> Documented police killings, 2013-2023: 12.4 per 100,000 people (67 total)
> Cases where officers are known to have faced professional/criminal/civil consequences: 2
> Gender of those killed: 95.5% male, 4.5% female
> Race/ethnicity of those killed: 28.4% White, 13.4% Black, 41.8% Hispanic, 0% Asian, 0% Native American
> Share of those killed with signs of a mental illness: 20.9%
> Share of those killed who were unarmed: 11.9%
> Population: 538,167
[in-text-ad-2]
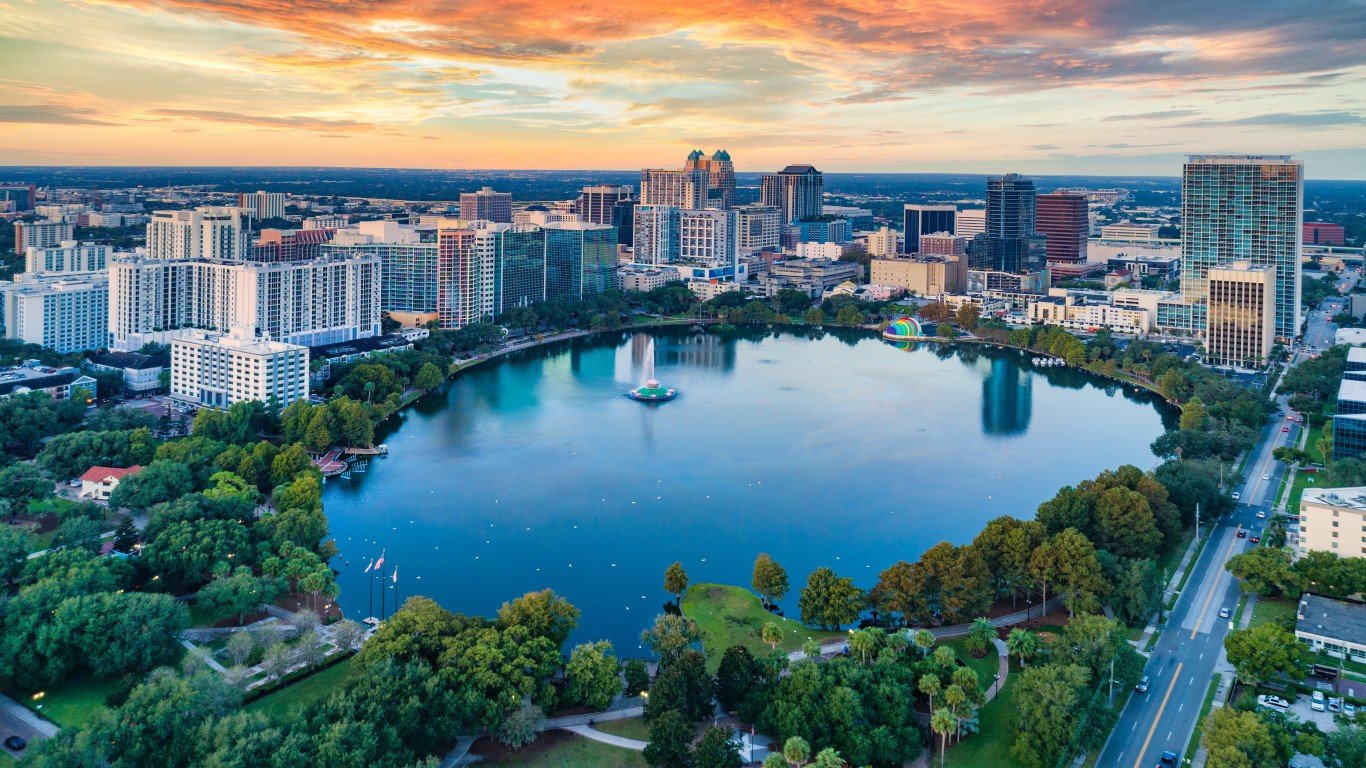
11. Orlando, FL
> Documented police killings, 2013-2023: 12.9 per 100,000 people (39 total)
> Cases where officers are known to have faced professional/criminal/civil consequences: 1
> Gender of those killed: 94.9% male, 5.1% female
> Race/ethnicity of those killed: 25.6% White, 51.3% Black, 17.9% Hispanic, 2.6% Asian, 0% Native American
> Share of those killed with signs of a mental illness: 17.9%
> Share of those killed who were unarmed: 17.9%
> Population: 302,968
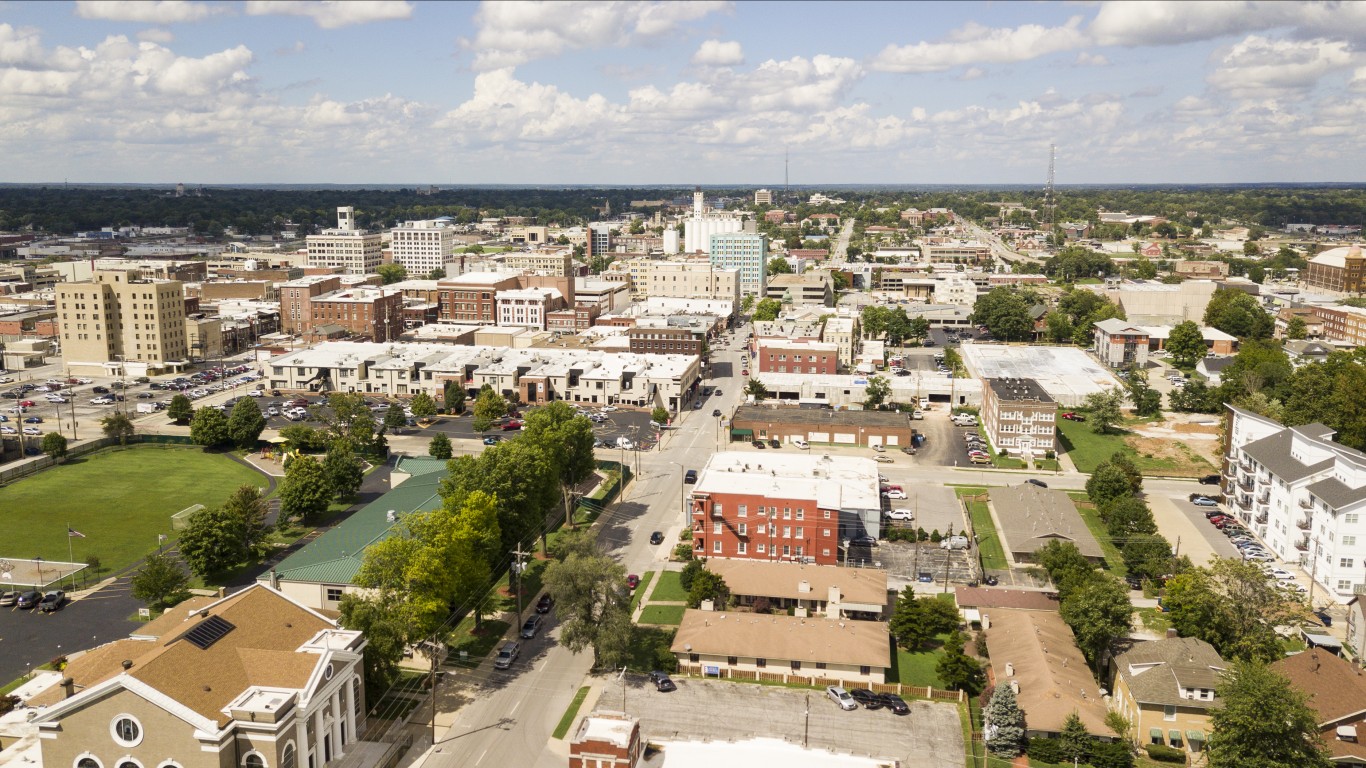
10. Springfield, MO
> Documented police killings, 2013-2023: 13.0 per 100,000 people (22 total)
> Cases where officers are known to have faced professional/criminal/civil consequences: 0
> Gender of those killed: 95.5% male, 4.5% female
> Race/ethnicity of those killed: 59.1% White, 4.5% Black, 0% Hispanic, 0% Asian, 0% Native American
> Share of those killed with signs of a mental illness: 13.6%
> Share of those killed who were unarmed: 9.1%
> Population: 168,603
[in-text-ad]
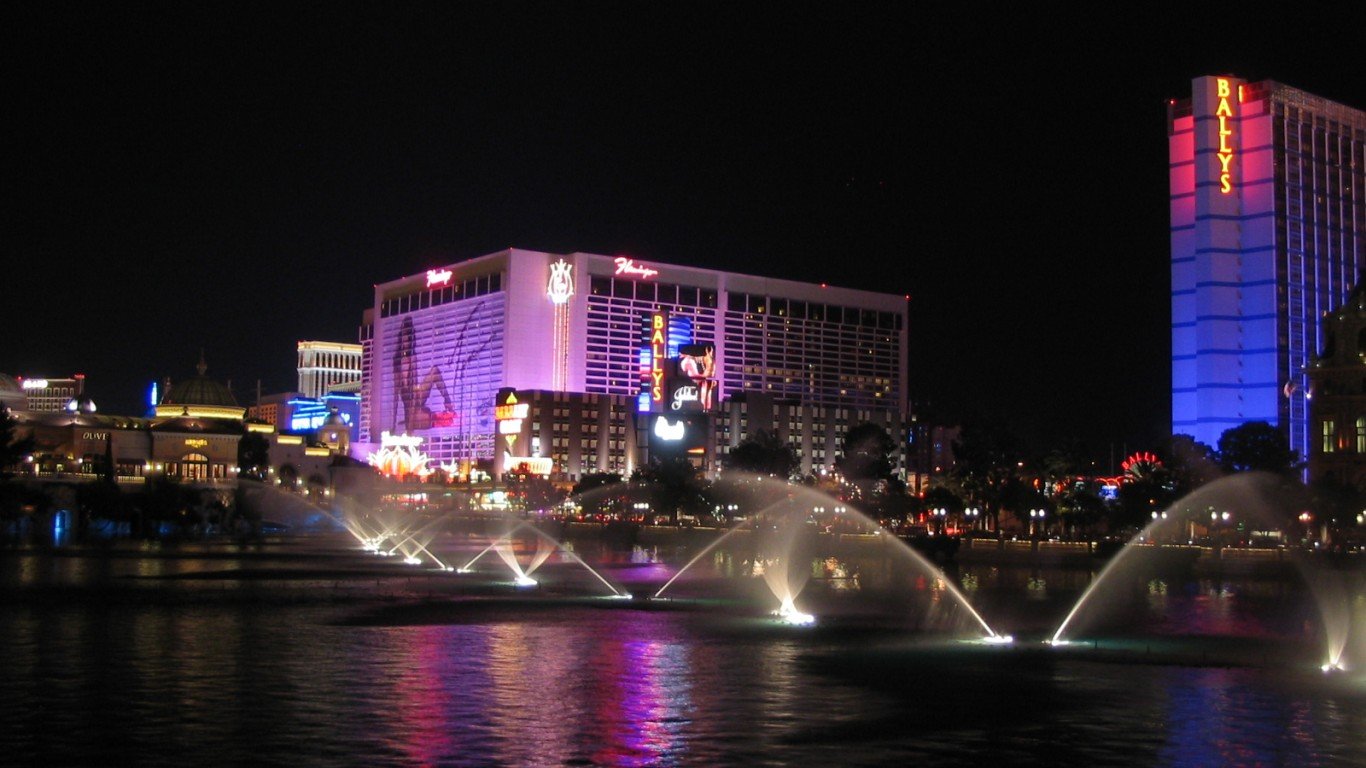
9. Las Vegas, NV
> Documented police killings, 2013-2023: 13.2 per 100,000 people (84 total)
> Cases where officers are known to have faced professional/criminal/civil consequences: 3
> Gender of those killed: 95.2% male, 4.8% female
> Race/ethnicity of those killed: 41.7% White, 21.4% Black, 25.0% Hispanic, 1.2% Asian, 1.2% Native American
> Share of those killed with signs of a mental illness: 28.6%
> Share of those killed who were unarmed: 10.7%
> Population: 634,786
[recirclink id=1189795]
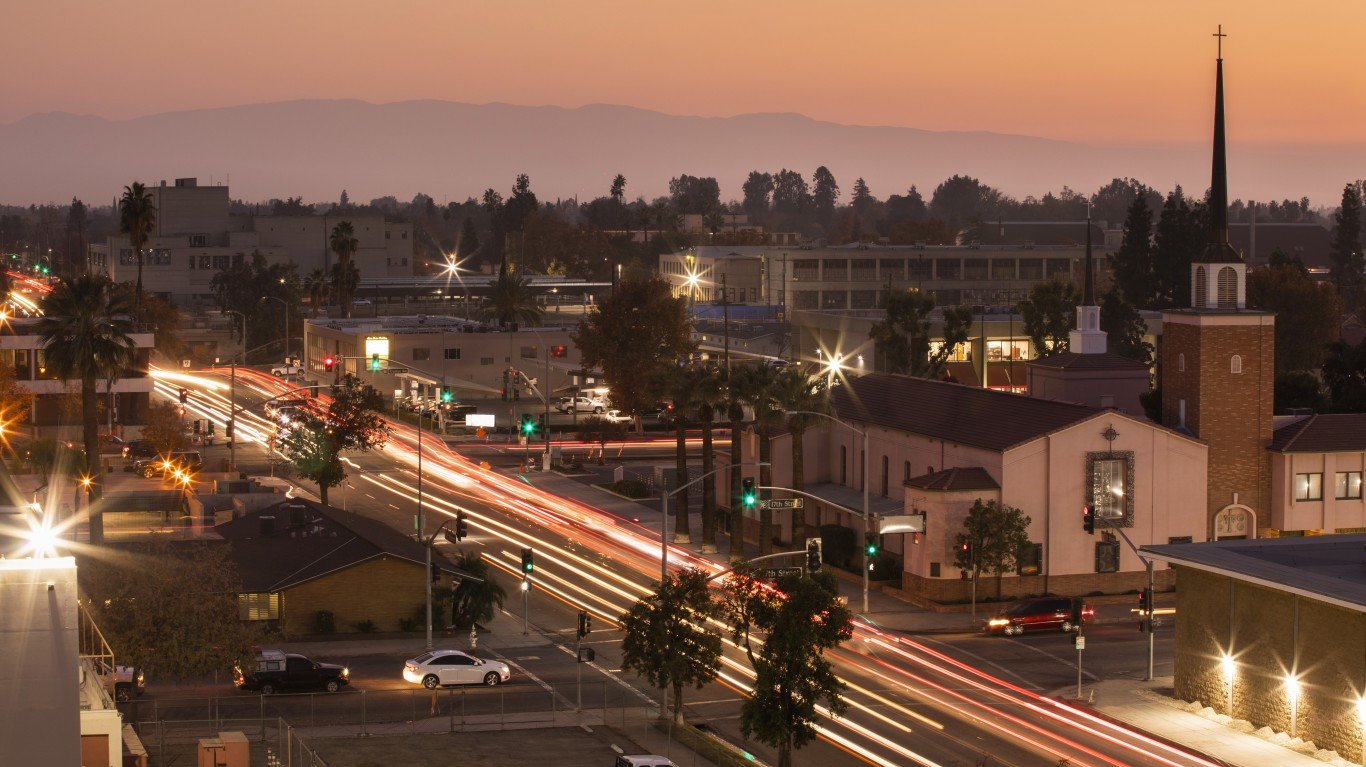
8. Bakersfield, CA
> Documented police killings, 2013-2023: 13.5 per 100,000 people (54 total)
> Cases where officers are known to have faced professional/criminal/civil consequences: 5
> Gender of those killed: 94.4% male, 5.6% female
> Race/ethnicity of those killed: 20.4% White, 7.4% Black, 64.8% Hispanic, 1.9% Asian, 0% Native American
> Share of those killed with signs of a mental illness: 13.0%
> Share of those killed who were unarmed: 24.1%
> Population: 398,756
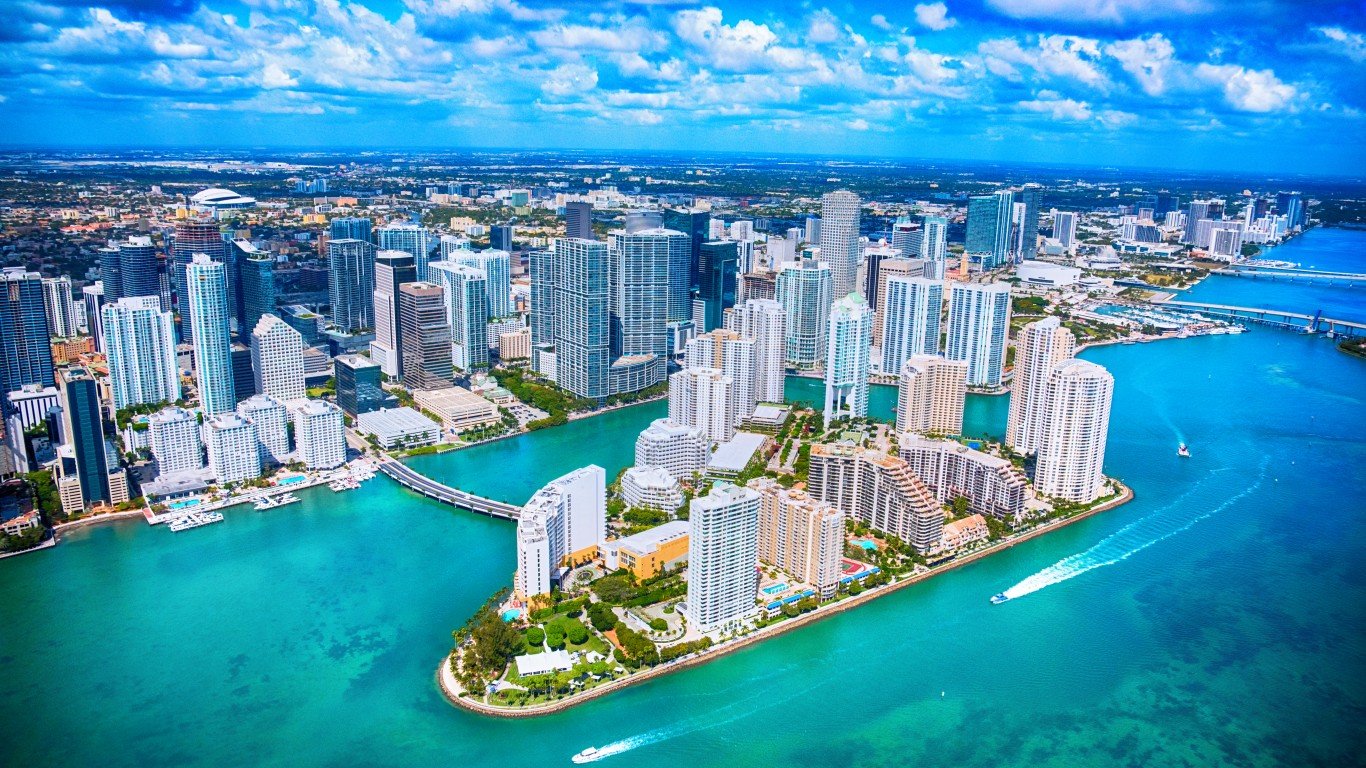
7. Miami, FL
> Documented police killings, 2013-2023: 13.8 per 100,000 people (61 total)
> Cases where officers are known to have faced professional/criminal/civil consequences: 1
> Gender of those killed: 96.7% male, 3.3% female
> Race/ethnicity of those killed: 9.8% White, 32.8% Black, 47.5% Hispanic, 0% Asian, 0% Native American
> Share of those killed with signs of a mental illness: 14.8%
> Share of those killed who were unarmed: 13.1%
> Population: 440,807
[in-text-ad-2]

6. Salt Lake City, UT
> Documented police killings, 2013-2023: 14.1 per 100,000 people (28 total)
> Cases where officers are known to have faced professional/criminal/civil consequences: 0
> Gender of those killed: 92.9% male, 7.1% female
> Race/ethnicity of those killed: 50% White, 17.9% Black, 14.3% Hispanic, 0% Asian, 3.6% Native American
> Share of those killed with signs of a mental illness: 17.9%
> Share of those killed who were unarmed: 10.7%
> Population: 199,153
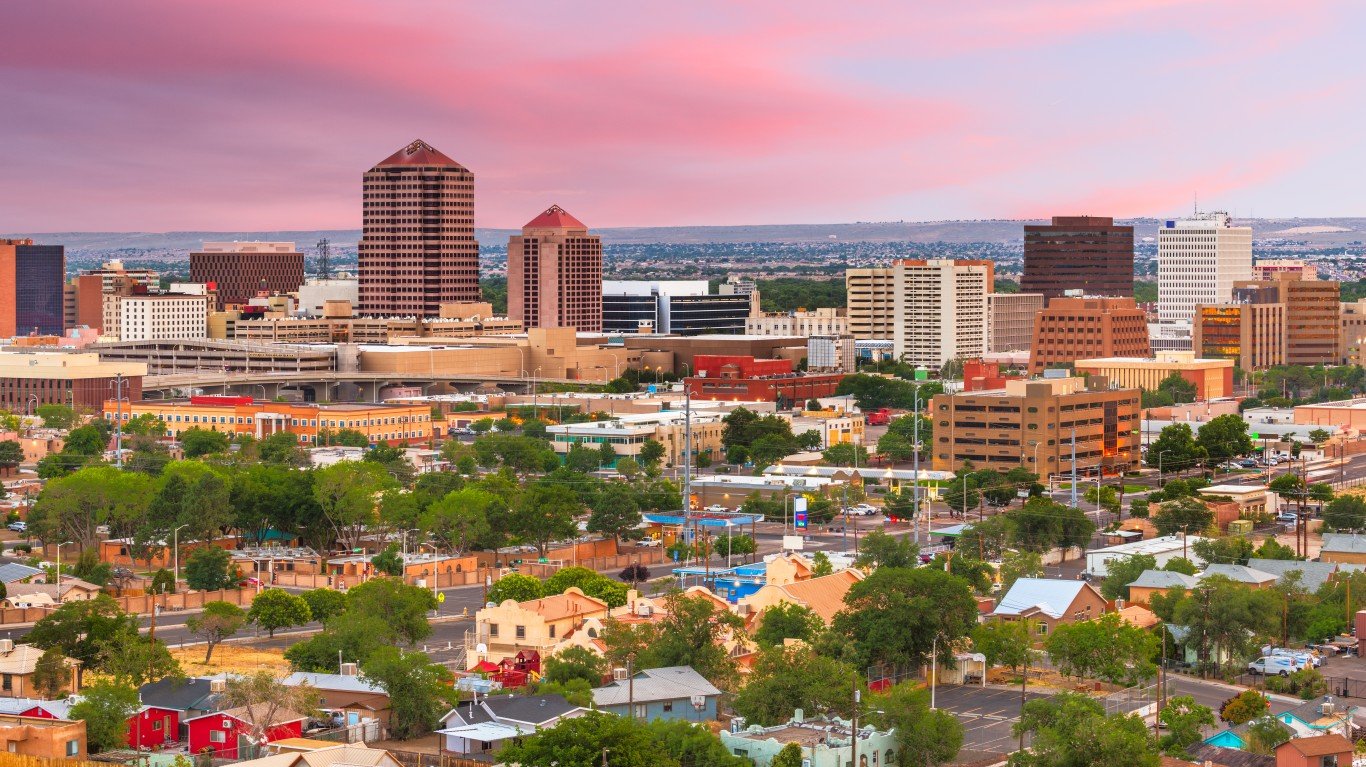
5. Albuquerque, NM
> Documented police killings, 2013-2023: 14.4 per 100,000 people (81 total)
> Cases where officers are known to have faced professional/criminal/civil consequences: 1
> Gender of those killed: 96.3% male, 3.7% female
> Race/ethnicity of those killed: 28.4% White, 9.9% Black, 51.9% Hispanic, 0% Asian, 1.2% Native American
> Share of those killed with signs of a mental illness: 22.2%
> Share of those killed who were unarmed: 9.9%
> Population: 562,336
[in-text-ad]
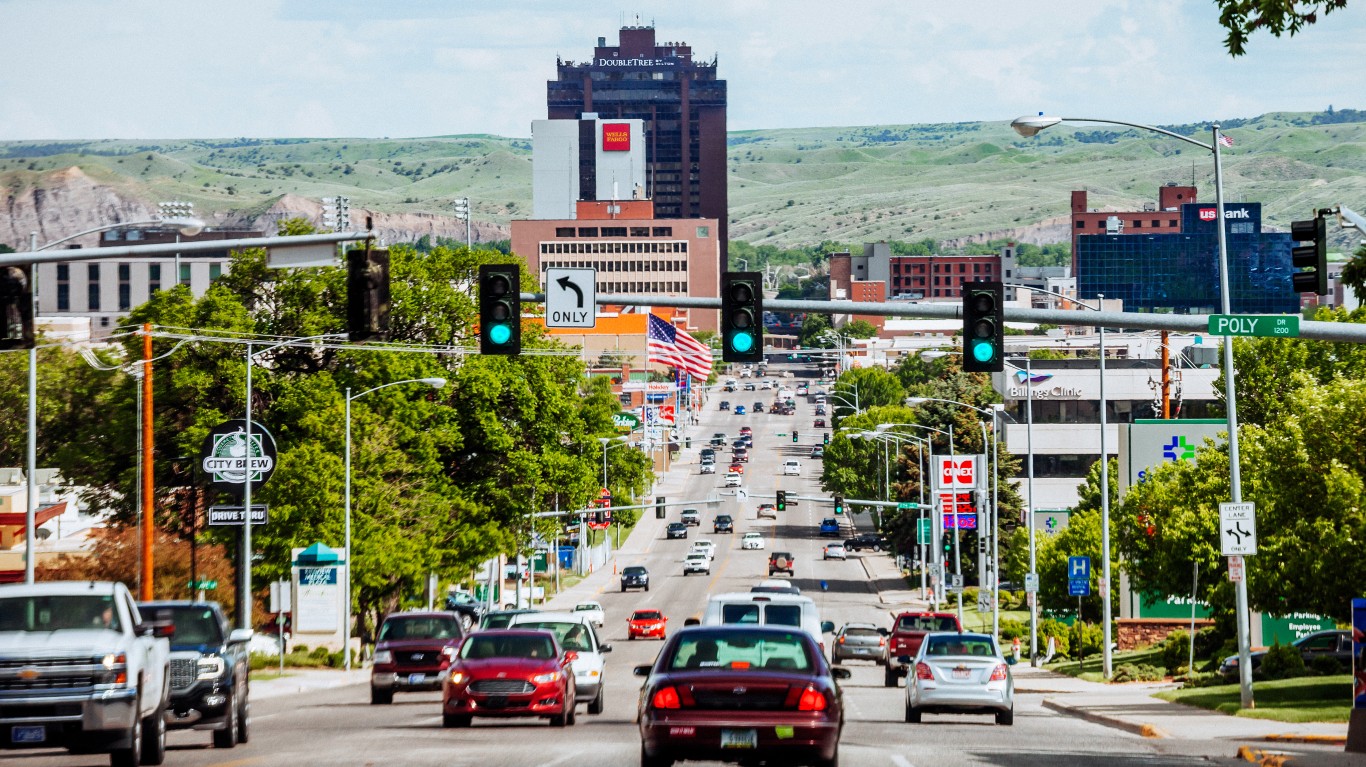
4. Billings, MT
> Documented police killings, 2013-2023: 16.4 per 100,000 people (19 total)
> Cases where officers are known to have faced professional/criminal/civil consequences: 0
> Gender of those killed: 94.7% male, 5.3% female
> Race/ethnicity of those killed: 68.4% White, 5.3% Black, 5.3% Hispanic, 0% Asian, 21.1% Native American
> Share of those killed with signs of a mental illness: 15.8%
> Share of those killed who were unarmed: 15.8%
> Population: 115,689
[recirclink id=1244184]
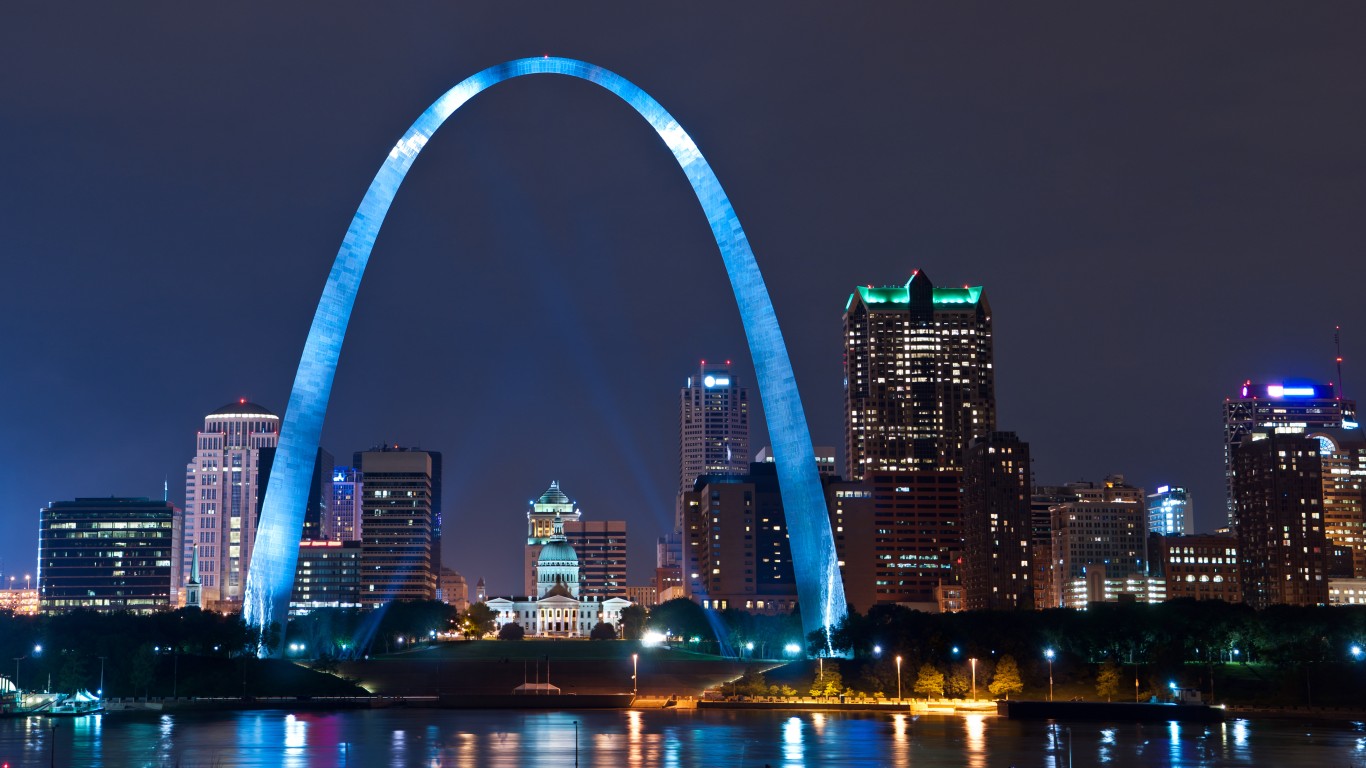
3. St. Louis, MO
> Documented police killings, 2013-2023: 18.2 per 100,000 people (55 total)
> Cases where officers are known to have faced professional/criminal/civil consequences: 2
> Gender of those killed: 96.4% male, 3.6% female
> Race/ethnicity of those killed: 12.7% White, 80% Black, 1.8% Hispanic, 0% Asian, 0% Native American
> Share of those killed with signs of a mental illness: 12.7%
> Share of those killed who were unarmed: 10.9%
> Population: 302,787
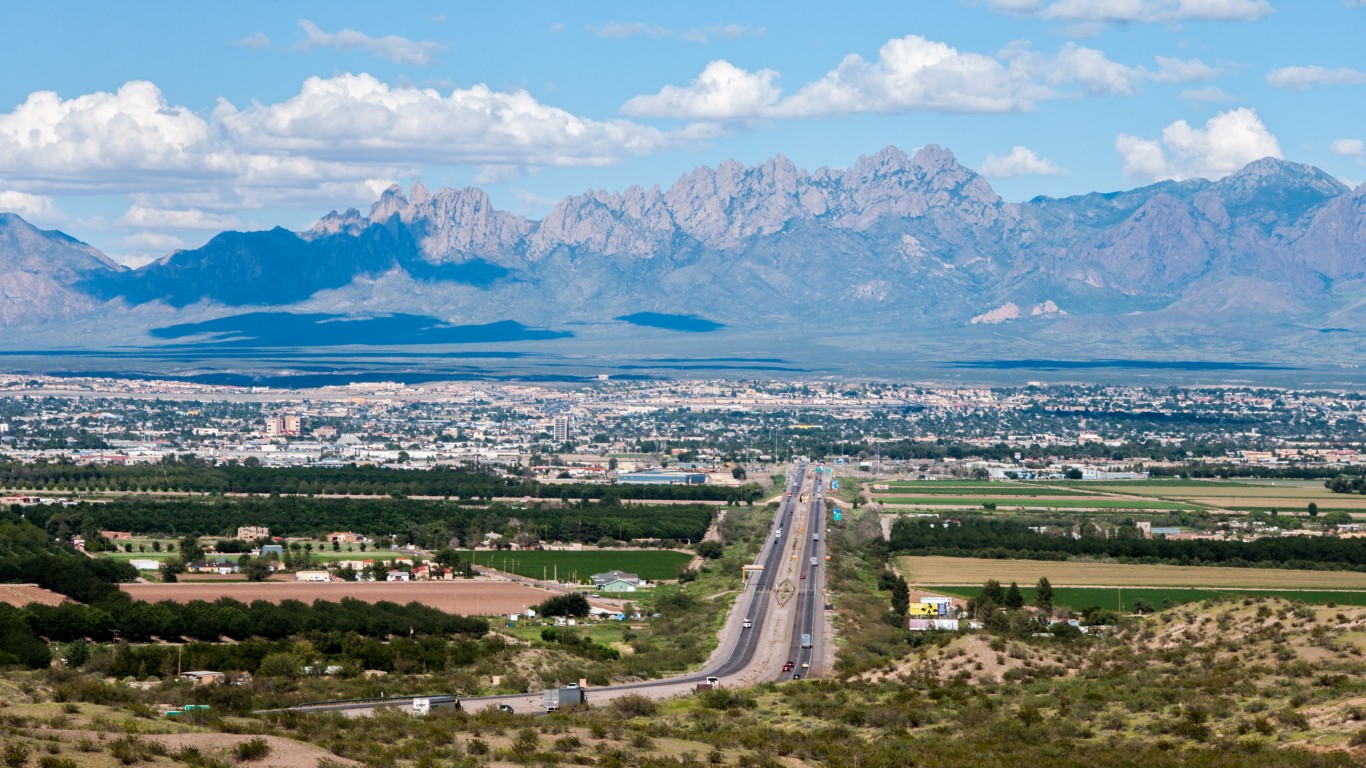
2. Las Cruces, NM
> Documented police killings, 2013-2023: 23.7 per 100,000 people (26 total)
> Cases where officers are known to have faced professional/criminal/civil consequences: 3
> Gender of those killed: 92.3% male, 7.7% female
> Race/ethnicity of those killed: 15.4% White, 0% Black, 65.4% Hispanic, 3.8% Asian, 0% Native American
> Share of those killed with signs of a mental illness: 23.1%
> Share of those killed who were unarmed: 7.7%
> Population: 109,934
[in-text-ad-2]

1. Pueblo, CO
> Documented police killings, 2013-2023: 26.0 per 100,000 people (29 total)
> Cases where officers are known to have faced professional/criminal/civil consequences: 0
> Gender of those killed: 96.6% male, 3.4% female
> Race/ethnicity of those killed: 27.6% White, 3.4% Black, 48.3% Hispanic, 0% Asian, 3.4% Native American
> Share of those killed with signs of a mental illness: 6.9%
> Share of those killed who were unarmed: 10.3%
> Population: 111,424
Methodology
To identify the cities where the most people are killed by law enforcement, 24/7 Wall St. reviewed data from Mapping Police Violence, a research collaborative that collects data on police killings across the nation from the country’s three largest comprehensive and impartial crowdsourced databases. We only considered cities with populations of at least 100,000 people.
Cities were ranked by the number of reported police killings from the beginning of 2013 through the end of May 2023 for every 100,000 people. Population data used to calculate the number of killings per 100,000 came from the U.S. Census Bureau’s 2021 American Community Survey. The total number of killings includes those carried out by off-duty law enforcement officers.
All supplemental data came from the Mapping Police Violence database, including demographic data on the gender and race or ethnicity of those killed, the share of those killed who showed signs of mental illness, killings by specific law enforcement agencies, and the share of those killed who were armed, whether with a firearm, edged weapon, blunt object, or vehicle.
Law enforcement officers involved in these cases were only considered to have faced official consequences if they are known to have been charged with a crime (regardless of whether or not they were convicted), sued in civil court, fired, ticketed, or put on leave.
Cases in which an investigation is still pending, or where the actions of a law enforcement officer were deemed justified by a grand jury or official state or local attorney were not counted among the total cases that resulted in official consequences.
Contact [email protected] for any questions or corrections.