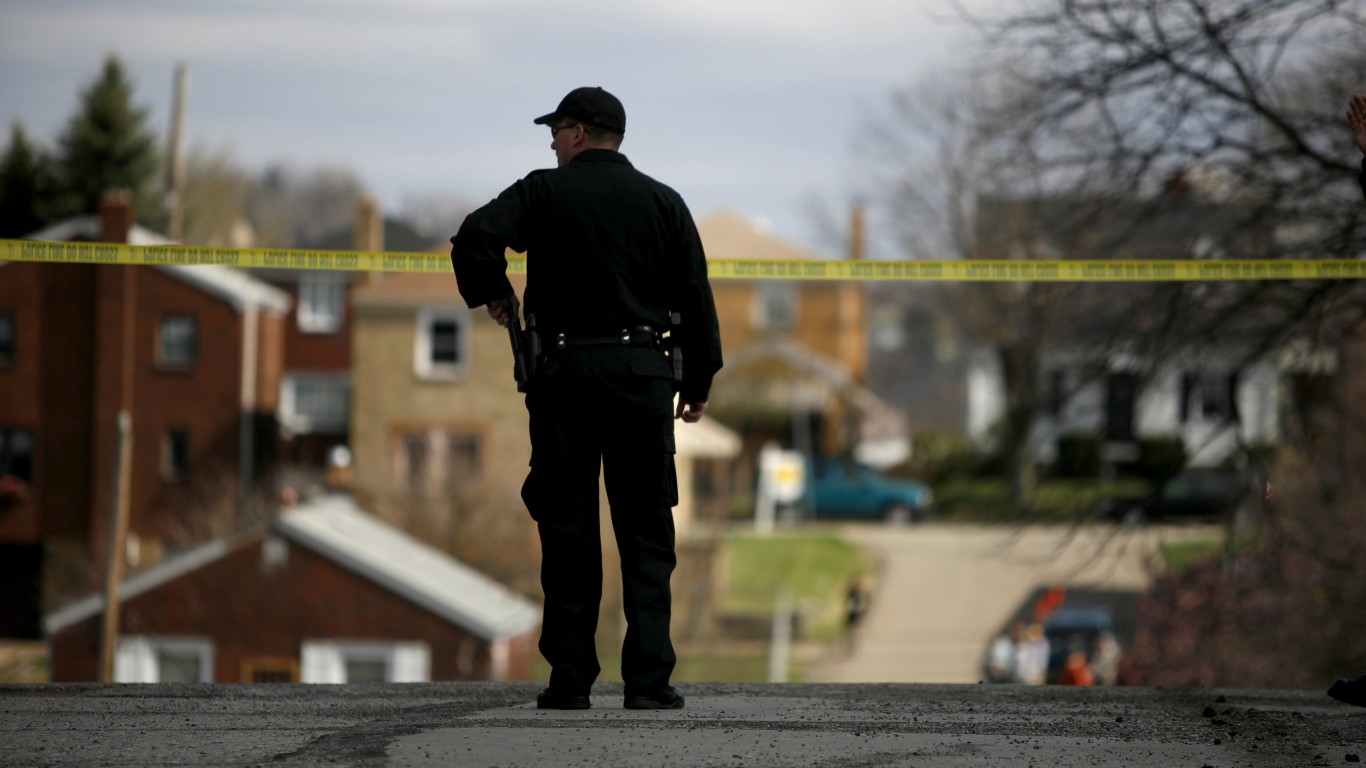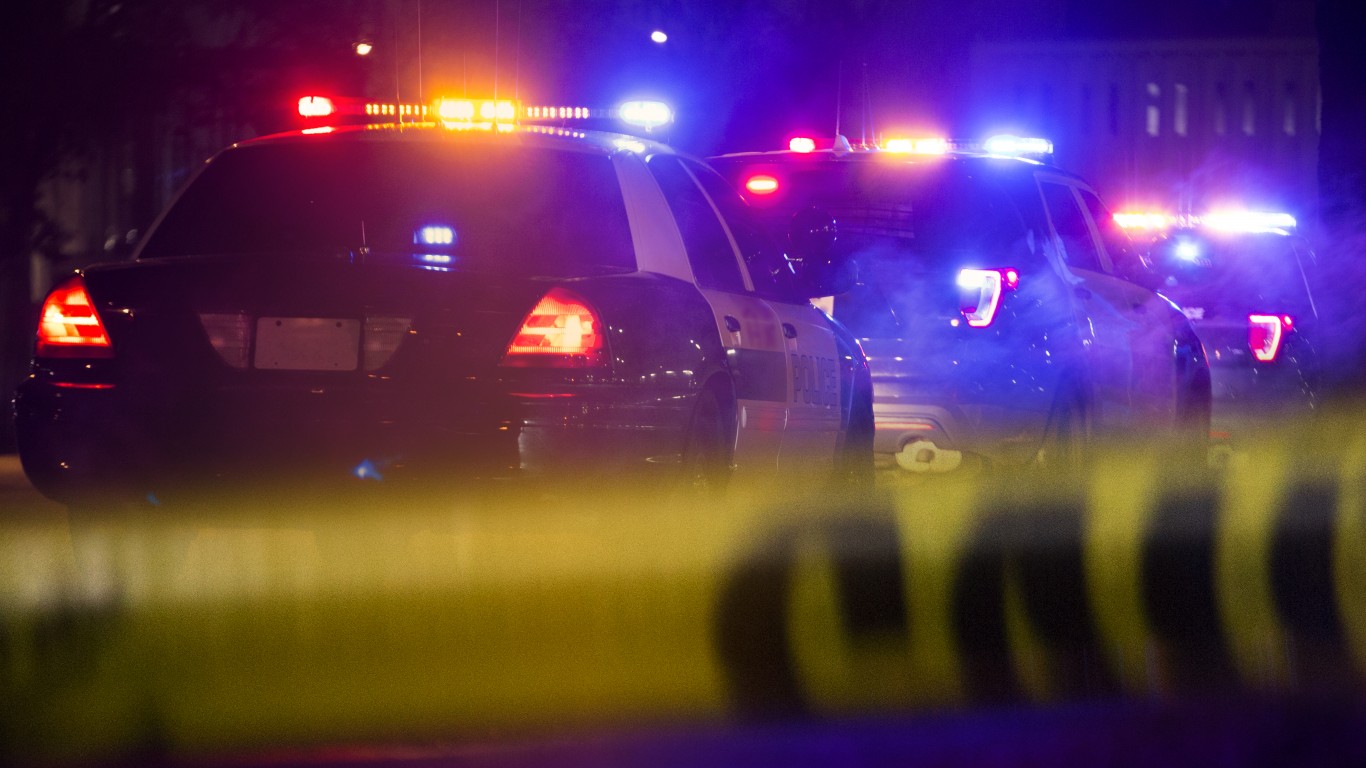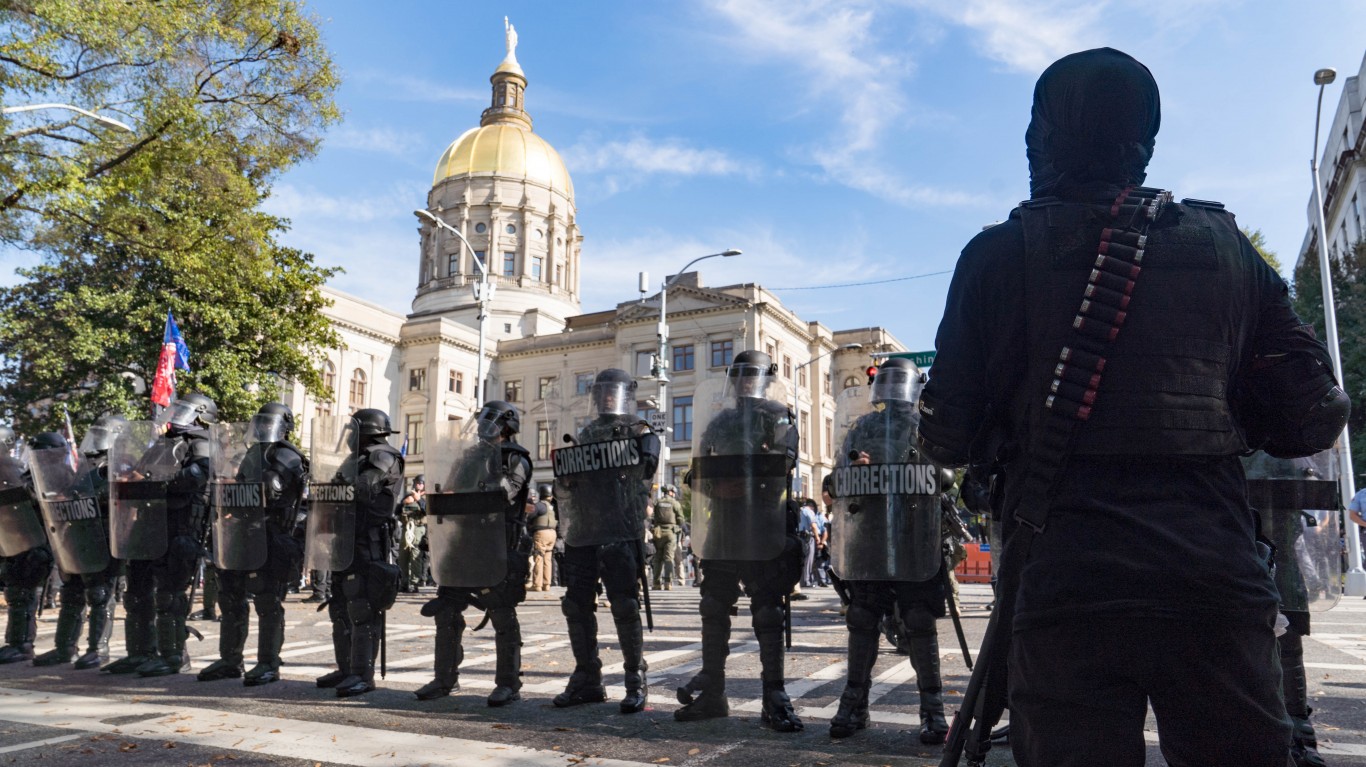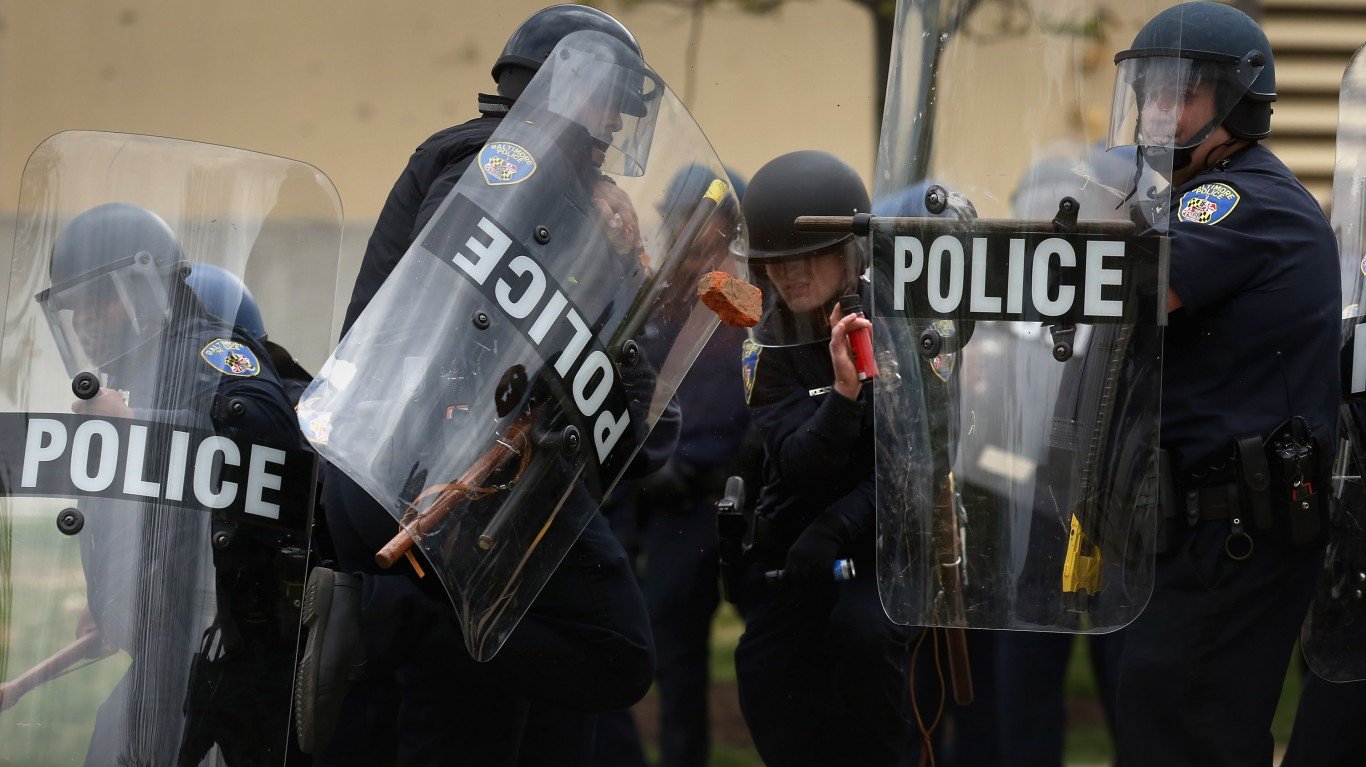
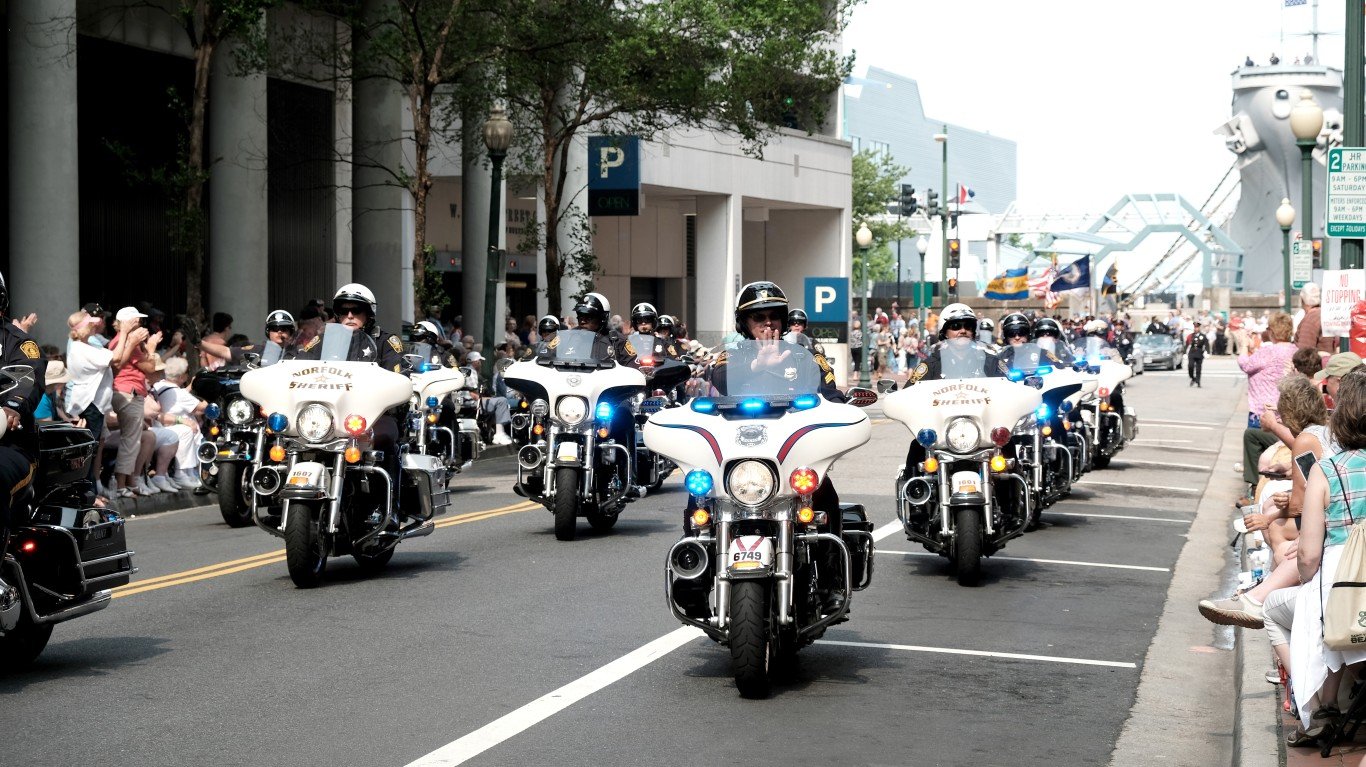
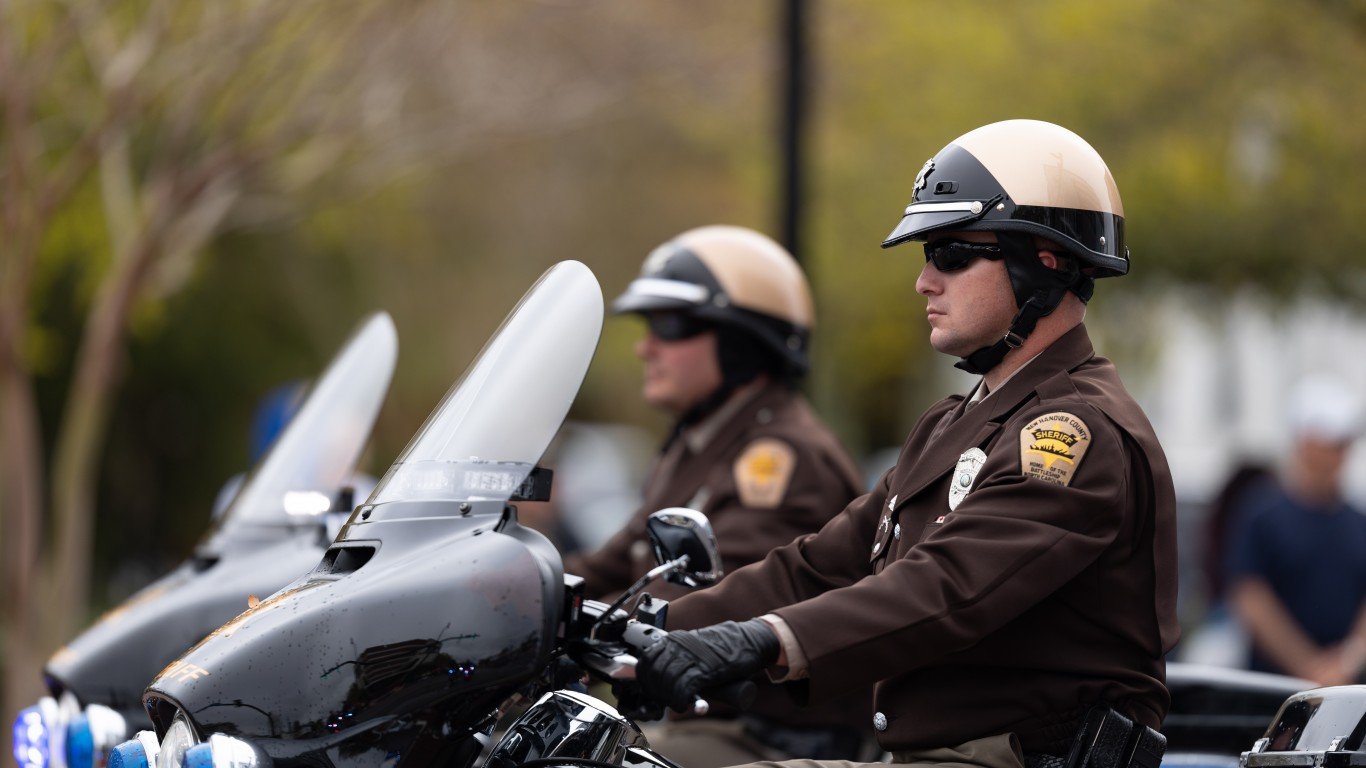
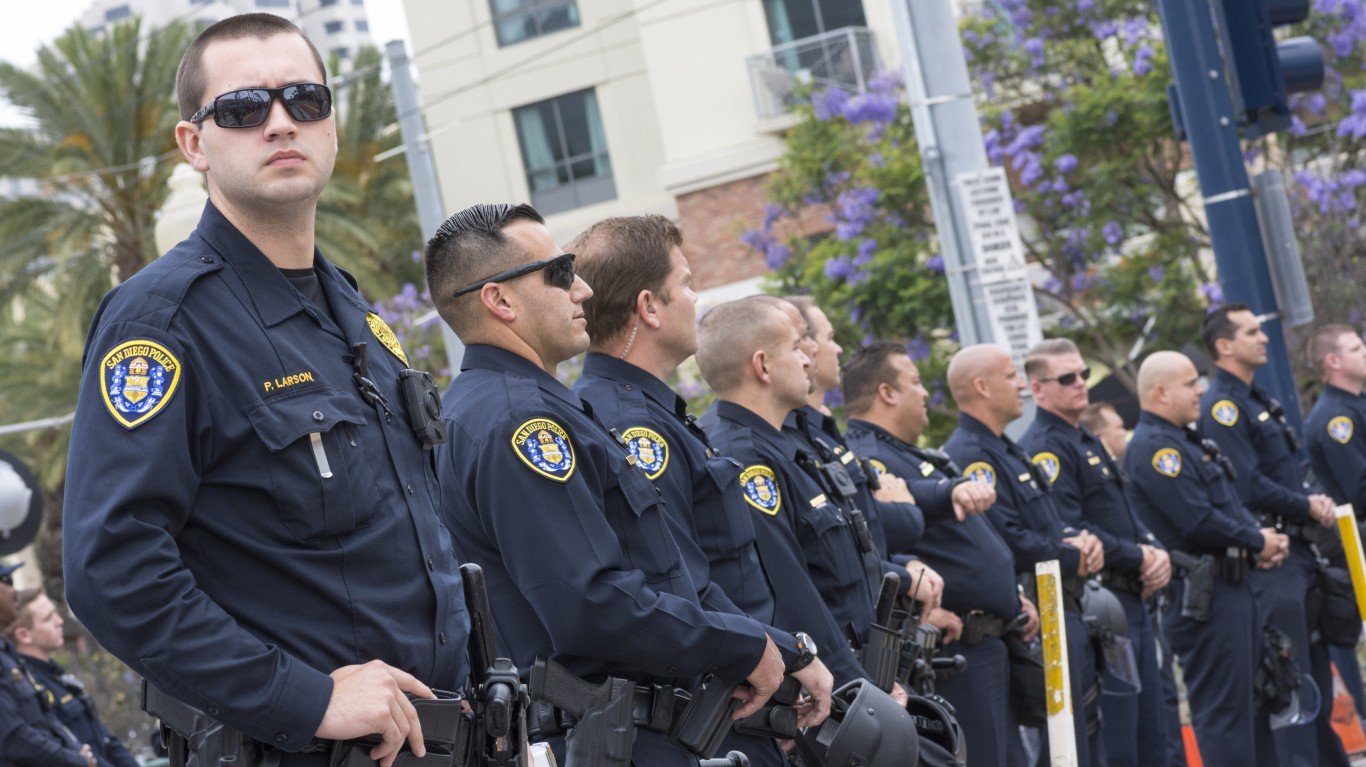
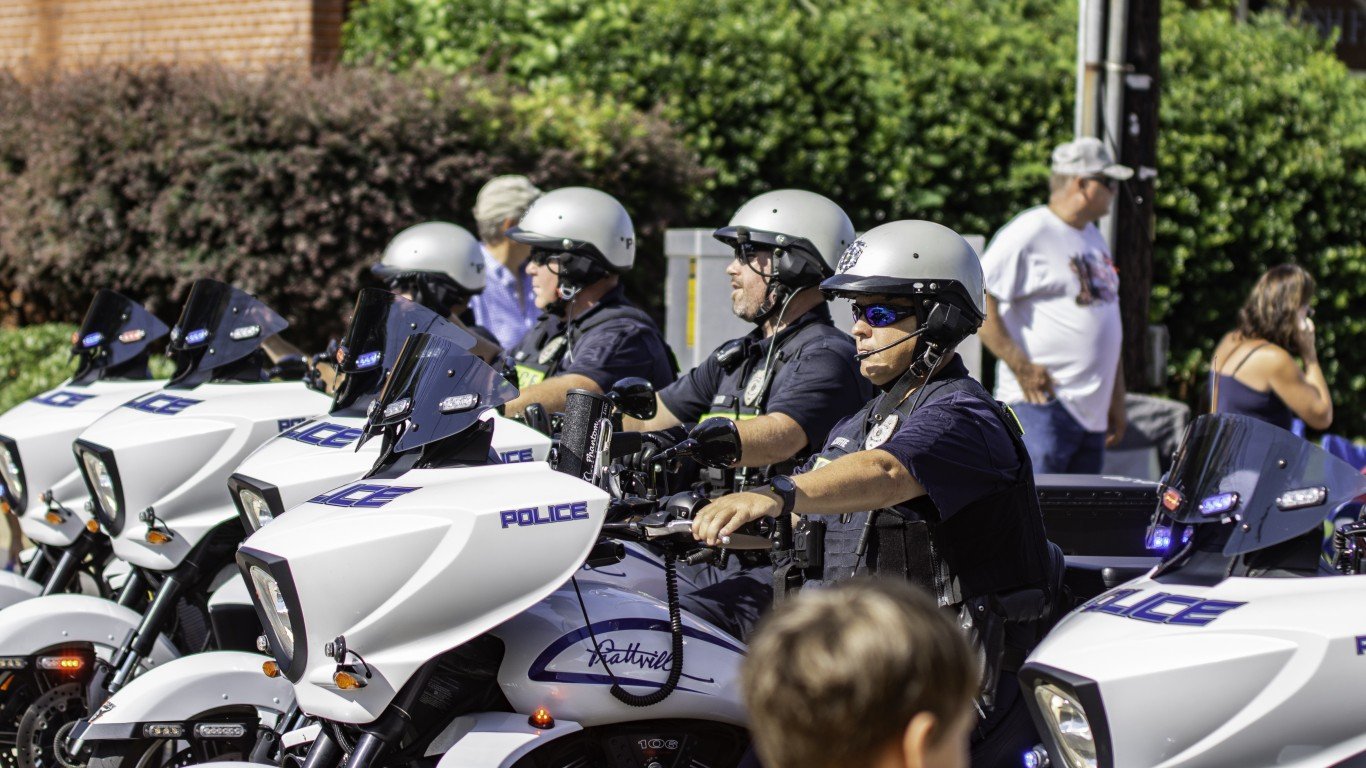
The amount of people killed by law enforcement every year in the United States has been on a steady increase in the past decade. More than 1,000 people have perished in police-involved fatalities each year. The majority of these killings are thought to be justified by oversight officials, but many are not. Footage of the murder of George Floyd by a Minneapolis police officer in 2020 sparked nationwide protests, calls for fundamental police reform, and increased scrutiny over the use of deadly force and other abuses of power, as did the 2014 death of Eric Garner in NYC.
According to Mapping Police Violence, a research collaborative that collects data on police killings across the nation, a reported 11,706 people were killed by police officers – both on and off duty – in the United States, from 2013 to May 2023. Adjusting for population, this comes out to around 3.5 police killings for every 100,000 people. However, the number of police killings in the last 10 years varies considerably from state to state.
The rate of police killings in recent years ranges from about 1 for every 100,000 people to 11 per 100,000. Using data from Mapping Police Violence, 24/7 Wall St. identified the states with the highest number of police-involved fatalities. States are ranked by the number of people killed by police officers from 2013 through May 2023 for every 100,000 people.
As for the demographics of those who were killed, the vast majority – 94% – were men. Racially, the largest share of those killed by police were white. However, deaths of Black Americans at the hands of police are disproportionately high. According to the U.S. Census Bureau, 76% of the U.S. population identifies as white, and 14% identify as Black. Meanwhile, whites accounted for 43% of police killings, and Black Americans for 25%.
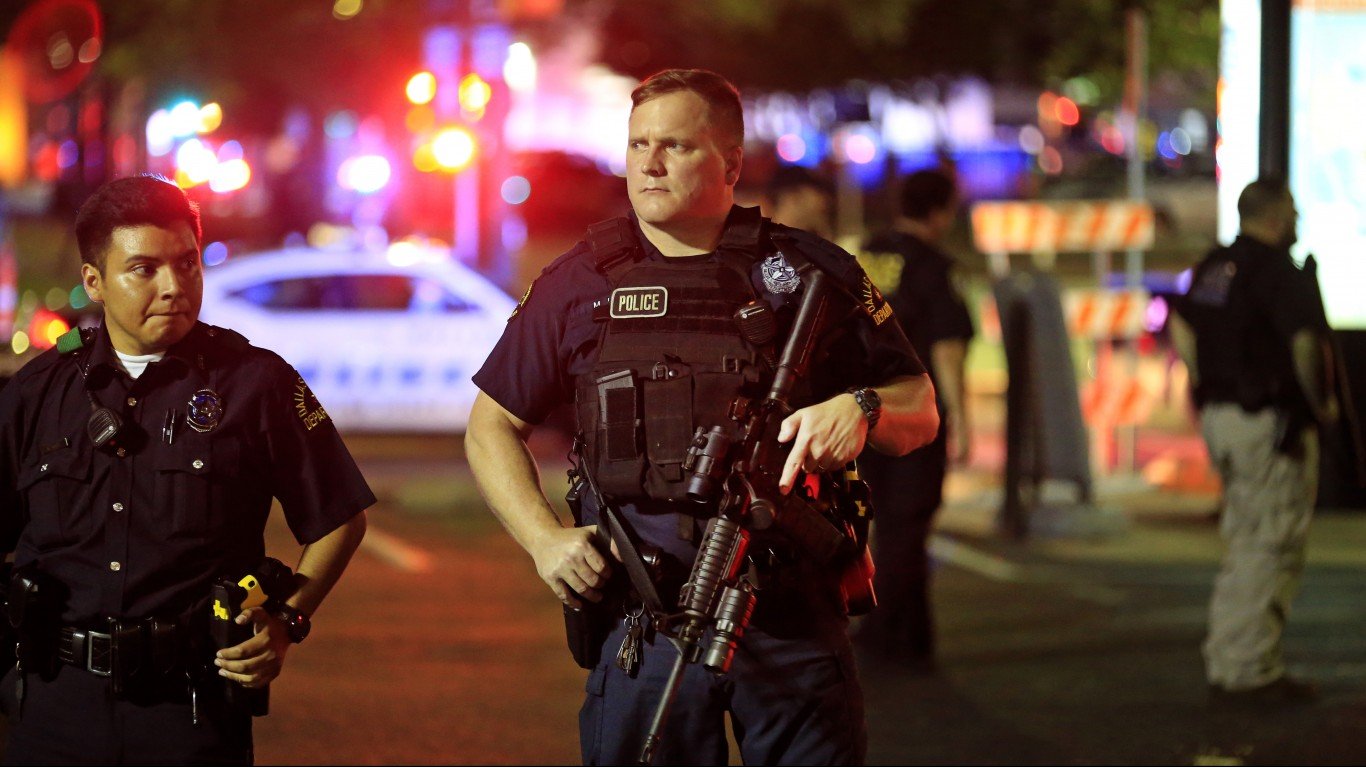
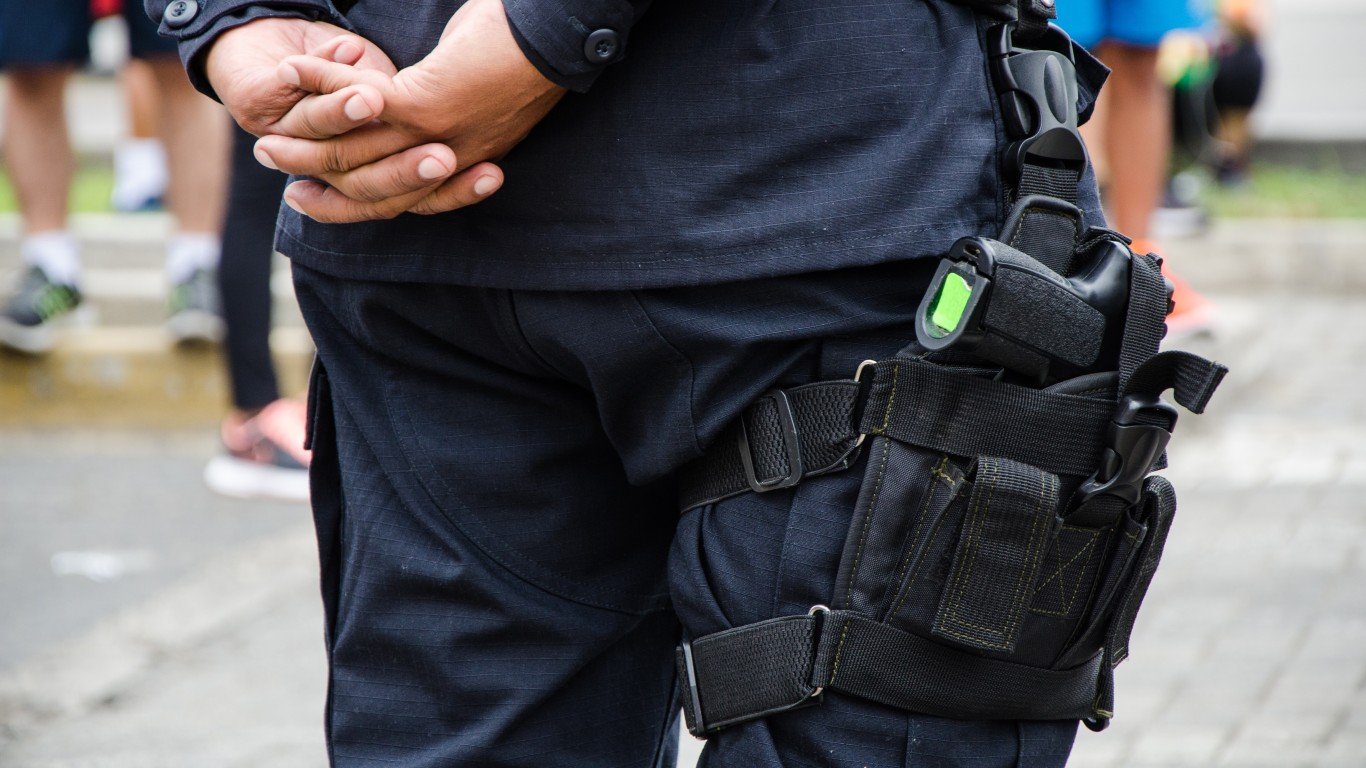
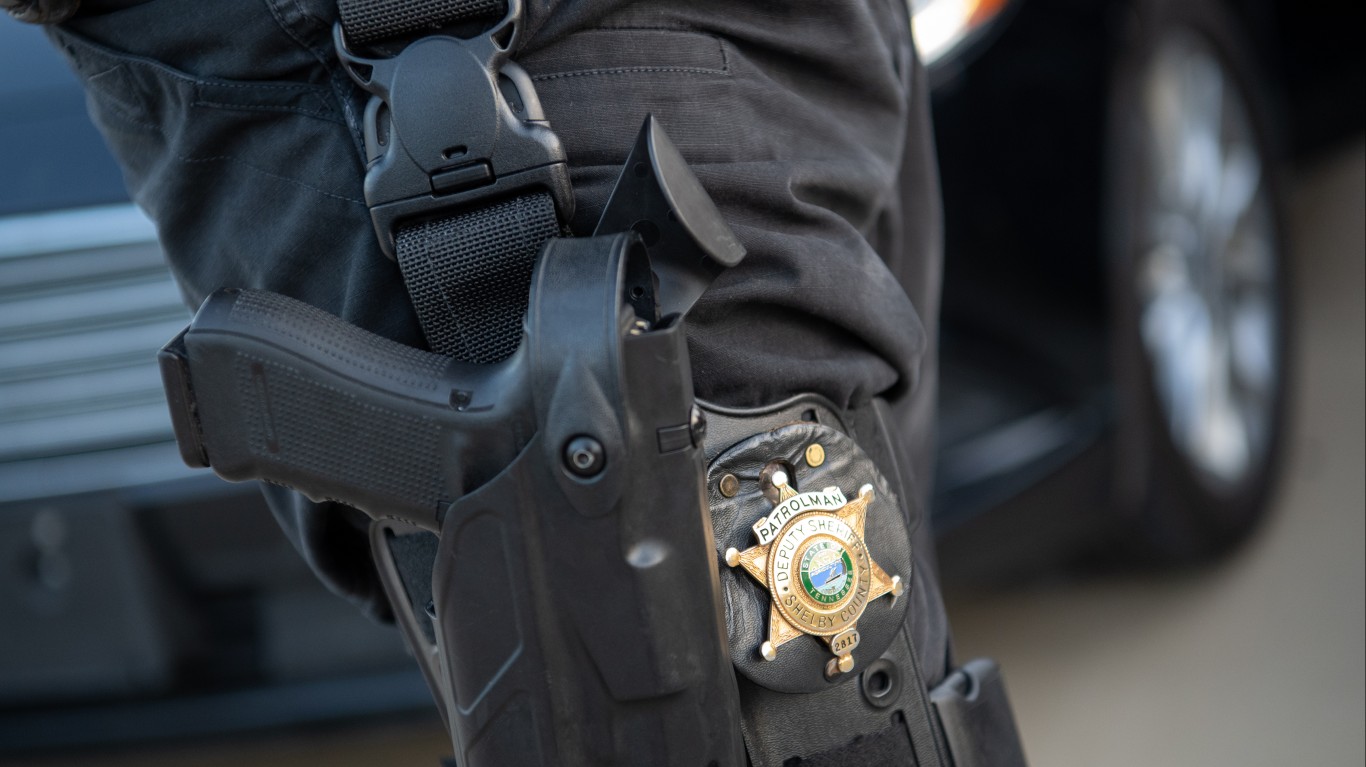
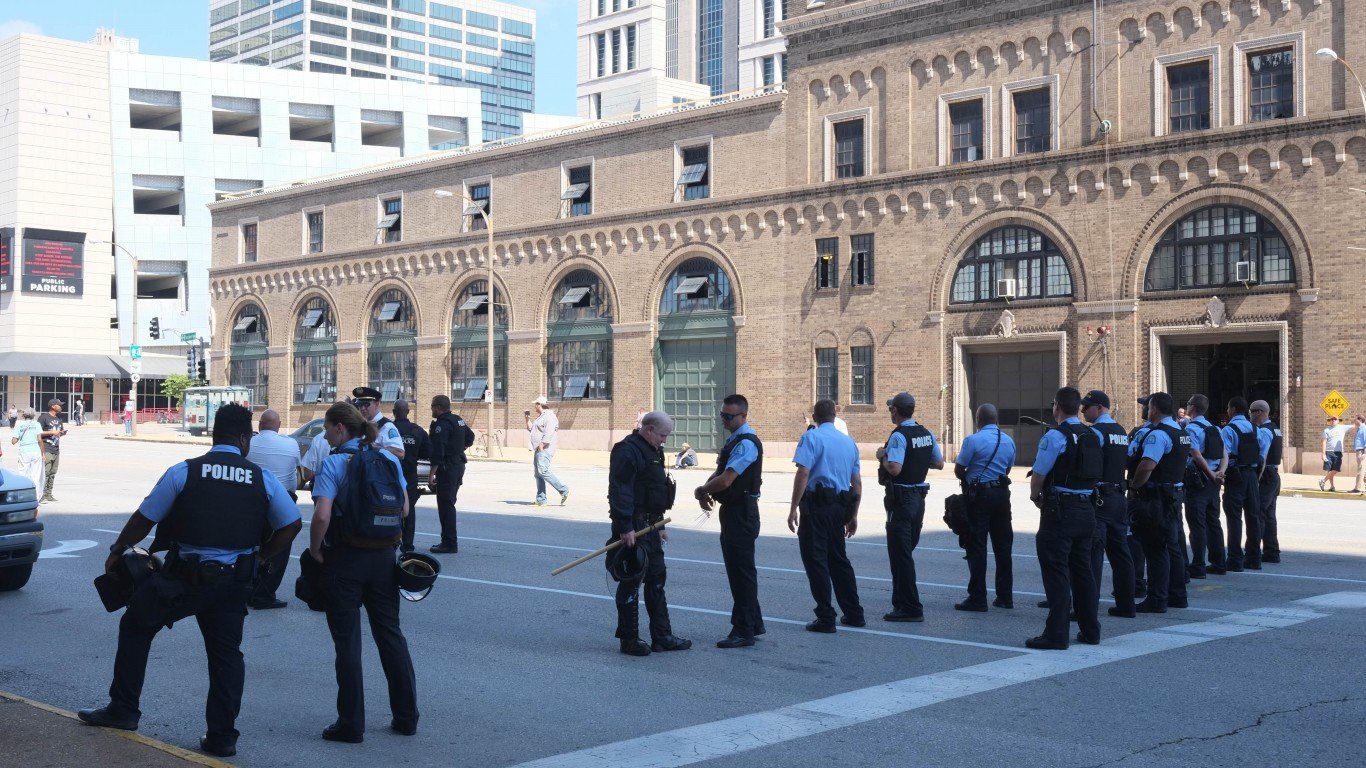
Police killings that involve excessive use of force are the ones that tend to make national news. These are situations where, in most cases when a suspect is killed, the use of deadly force by law enforcement appears to be justified in the judgment of the U.S. Criminal Legal System. Of the more than 11,700 police killings since 2013, only 322 have resulted in official disciplinary action. The consequences for officers involved in potentially unjustified killings range in scope, from civil lawsuits or being put on leave to criminal prosecution. (Here is a look at the police departments that kill the most people.)
Although many police killings were intentional, particularly those in which a suspect was shot to death, not all were. There have been multiple cases across the country in recent years in which a suspect was unintentionally killed by means typically considered non-lethal or less-lethal, such as a bean bag gun or taser. (These are the standard issue police sidearms in America’s 10 biggest cities.)
Here are the states with the most known police killings.
50. Rhode Island
- Documented police killings, 2013-2023: 0.9 per 100,000 people (10 total)
- Cases where officers faced professional/criminal/civil consequences: 0
- Gender of those killed: 100% male
- Race/ethnicity of those killed: 60.0% white, 30.0% Black, 10.0% Hispanic, 0.0% Asian, 0.0% Native American
- Share of those killed with signs of a mental illness: 10.0% – 2nd lowest of 50 states
- Share of those killed who were unarmed: 20.0% – 6th highest of 50 states
- Agency with the most killings in state: Pawtucket Police Department; 3 total
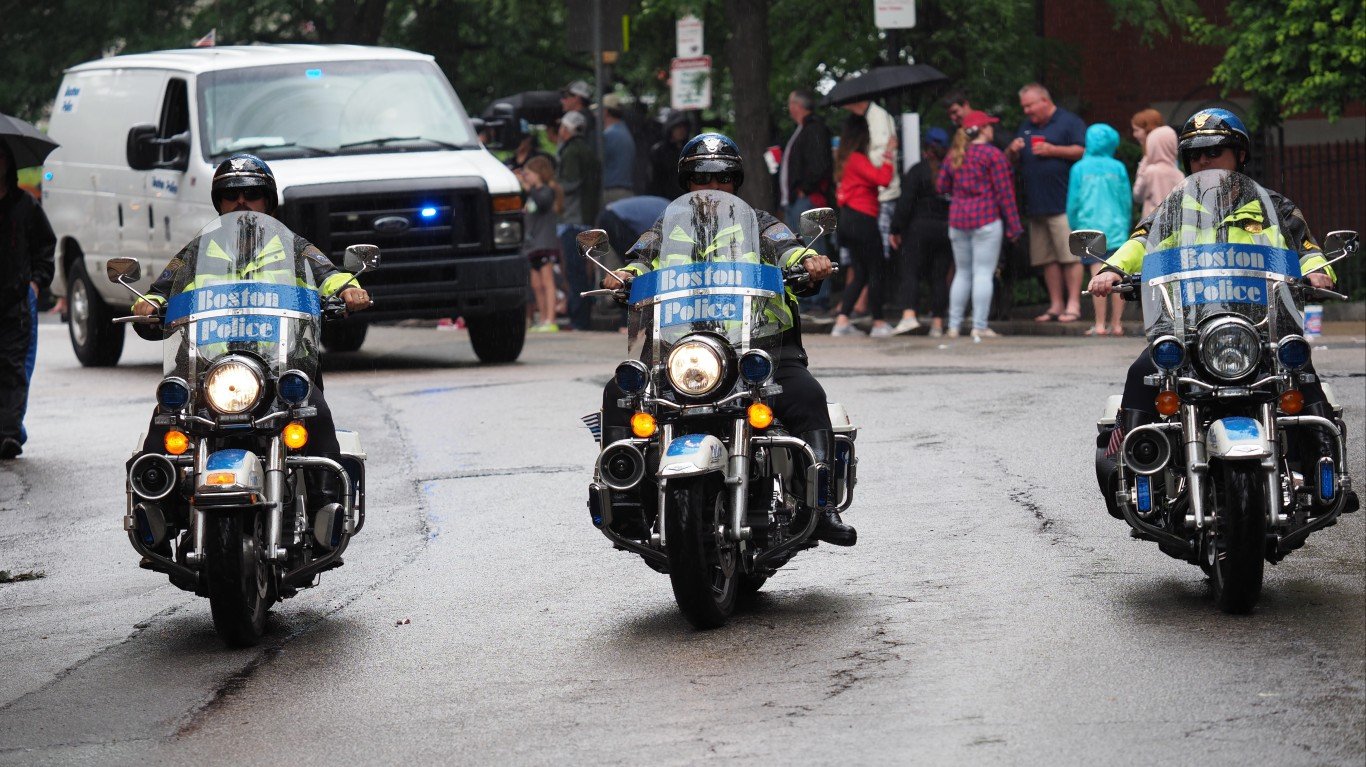
49. Massachusetts
- Documented police killings, 2013-2023: 1.1 per 100,000 people (80 total)
- Cases where officers faced professional/criminal/civil consequences: 2 – 2.5% of total
- Gender of those killed: 97.5% male, 2.5% female
- Race/ethnicity of those killed: 47.5% white, 28.8% Black, 15.0% Hispanic, 3.8% Asian, 0.0% Native American
- Share of those killed with signs of a mental illness: 27.5% – 3rd highest of 50 states
- Share of those killed who were unarmed: 12.5% – 24th highest of 50 states
- Agency with the most killings in state: Boston Police Department; 16 total
48. New York

- Documented police killings, 2013-2023: 1.2 per 100,000 people (244 total)
- Cases where officers faced professional/criminal/civil consequences: 9 – 3.7% of total
- Gender of those killed: 91.0% male, 8.2% female
- Race/ethnicity of those killed: 33.6% white, 42.2% Black, 10.7% Hispanic, 1.6% Asian, 0.0% Native American
- Share of those killed with signs of a mental illness: 27.9% – 2nd highest of 50 states
- Share of those killed who were unarmed: 22.1% – 4th highest of 50 states
- Agency with the most killings in state: New York Police Department; 105 total
47. Connecticut
- Documented police killings, 2013-2023: 1.3 per 100,000 people (48 total)
- Cases where officers faced professional/criminal/civil consequences: 1 – 2.1% of total
- Gender of those killed: 97.9% male, 2.1% female
- Race/ethnicity of those killed: 50.0% white, 20.8% Black, 20.8% Hispanic, 2.1% Asian, 0.0% Native American
- Share of those killed with signs of a mental illness: 20.8% – 23rd highest of 50 states
- Share of those killed who were unarmed: 22.9% – 2nd highest of 50 states
- Agency with the most killings in state: Connecticut State Police; 9 total
46. New Jersey
- Documented police killings, 2013-2023: 1.6 per 100,000 people (145 total)
- Cases where officers faced professional/criminal/civil consequences: 10 – 6.9% of total
- Gender of those killed: 95.2% male, 4.8% female
- Race/ethnicity of those killed: 28.3% white, 44.8% Black, 13.1% Hispanic, 2.8% Asian, 0.0% Native American
- Share of those killed with signs of a mental illness: 21.4% – 19th highest of 50 states
- Share of those killed who were unarmed: 17.2% – 10th highest of 50 states
- Agency with the most killings in state: Newark Police Department; 13 total
45. Michigan

- Documented police killings, 2013-2023: 2.0 per 100,000 people (197 total)
- Cases where officers faced professional/criminal/civil consequences: 5 – 2.5% of total
- Gender of those killed: 95.9% male, 4.1% female
- Race/ethnicity of those killed: 48.2% white, 33.5% Black, 2.0% Hispanic, 1.0% Asian, 0.5% Native American
- Share of those killed with signs of a mental illness: 21.8% – 16th highest of 50 states
- Share of those killed who were unarmed: 10.2% – 12th lowest of 50 states
- Agency with the most killings in state: Detroit Police Department; 30 total
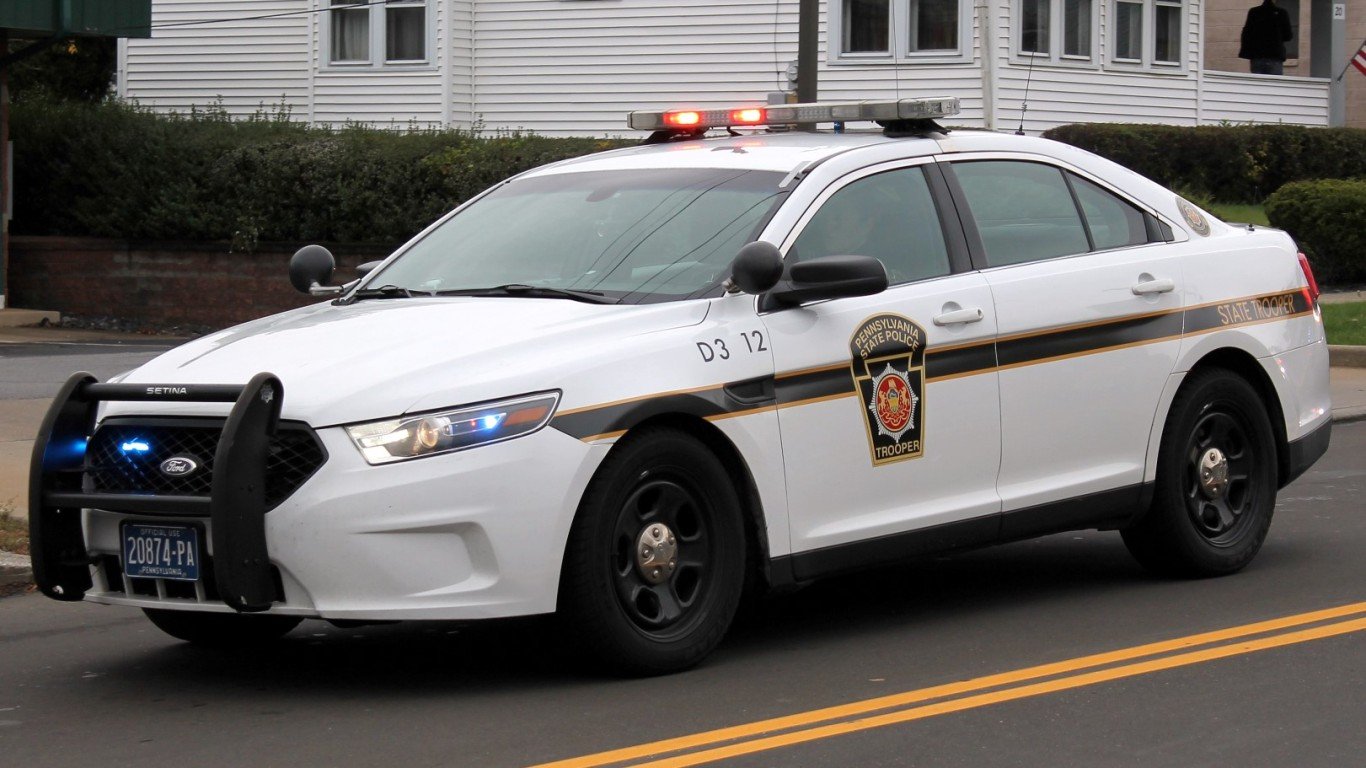
44. Pennsylvania
- Documented police killings, 2013-2023: 2.0 per 100,000 people (255 total)
- Cases where officers faced professional/criminal/civil consequences: 12 – 4.7% of total
- Gender of those killed: 94.9% male, 4.7% female
- Race/ethnicity of those killed: 47.5% white, 30.2% Black, 6.3% Hispanic, 0.4% Asian, 0.4% Native American
- Share of those killed with signs of a mental illness: 22.0% – 13th highest of 50 states
- Share of those killed who were unarmed: 13.7% – 19th highest of 50 states
- Agency with the most killings in state: Pennsylvania State Police; 55 total
43. New Hampshire
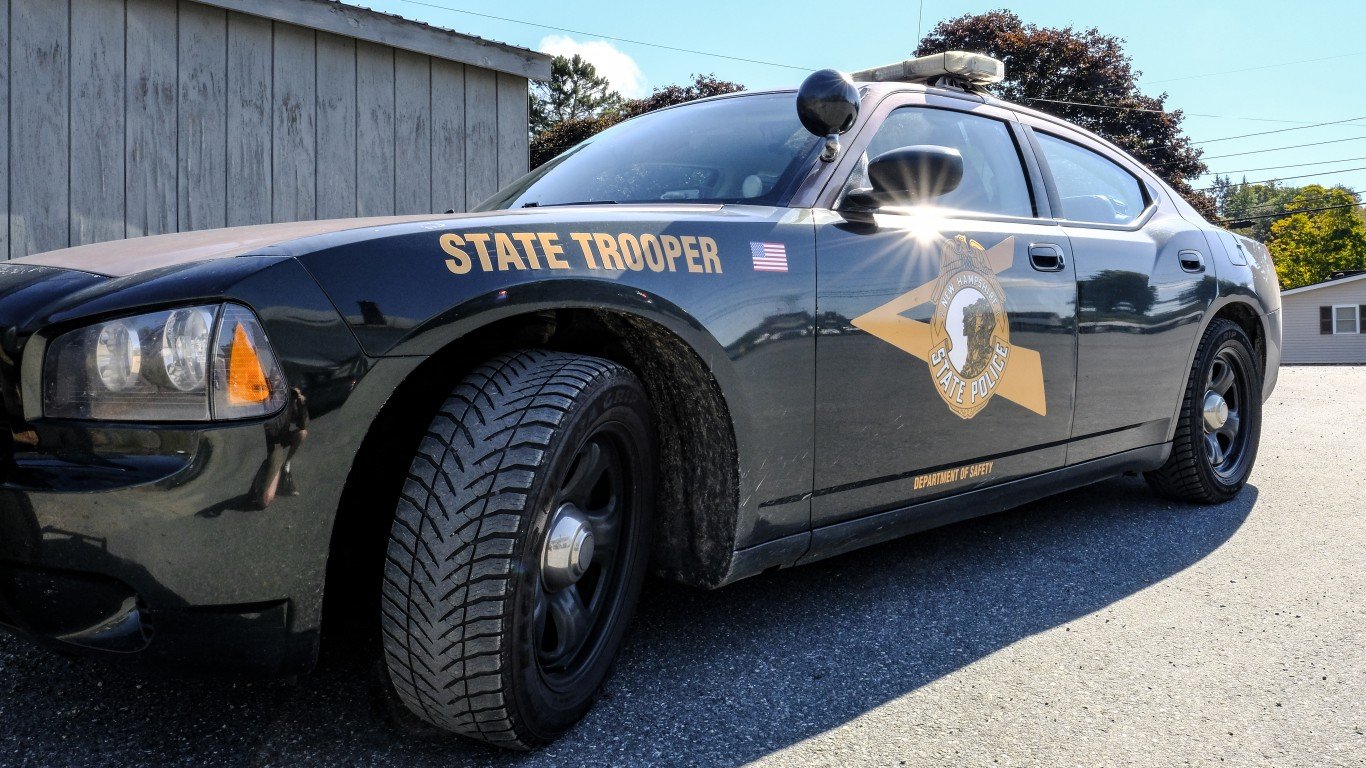
- Documented police killings, 2013-2023: 2.0 per 100,000 people (28 total)
- Cases where officers faced professional/criminal/civil consequences: 0
- Gender of those killed: 96.4% male, 3.6% female
- Race/ethnicity of those killed: 89.3% white, 0.0% Black, 3.6% Hispanic, 0.0% Asian, 0.0% Native American
- Share of those killed with signs of a mental illness: 21.4% – 17th highest of 50 states
- Share of those killed who were unarmed: 10.7% – 16th lowest of 50 states
- Agency with the most killings in state: New Hampshire State Police; 6 total
42. Iowa
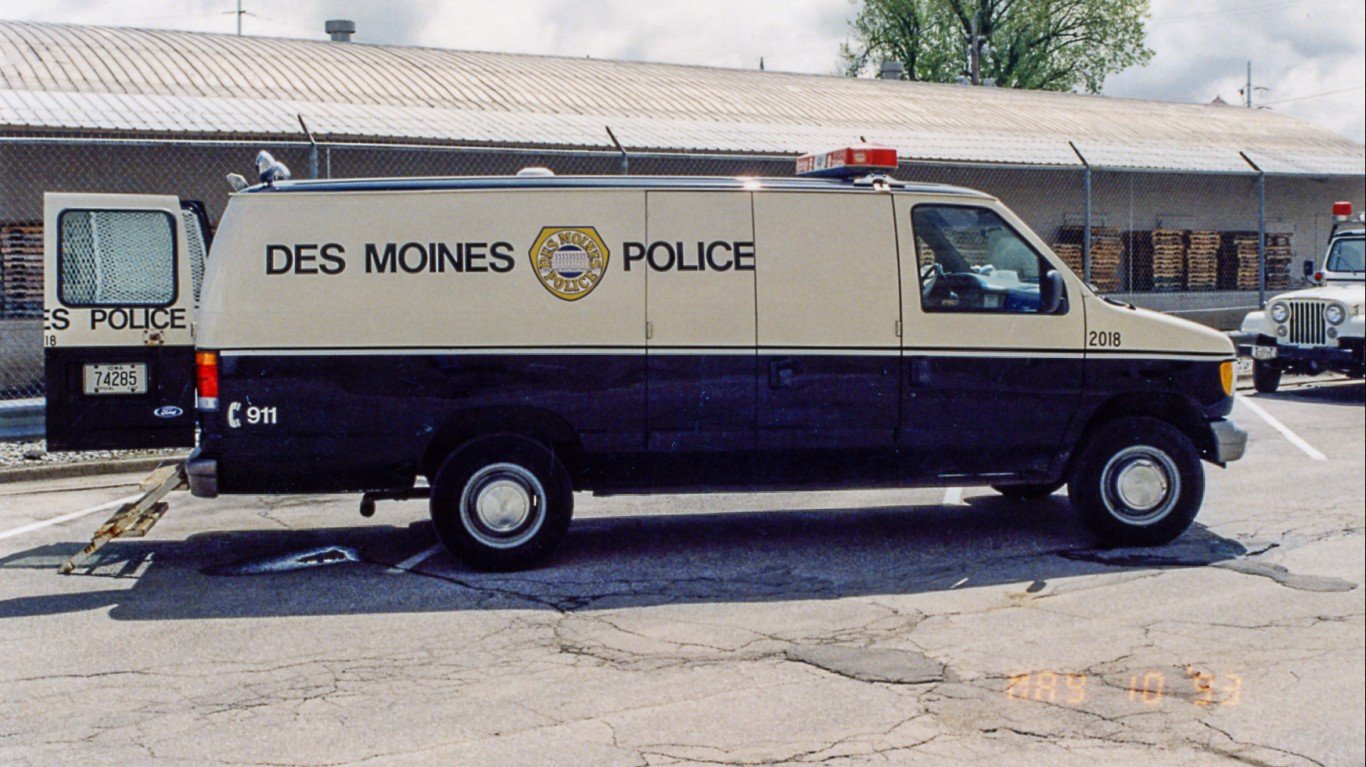
- Documented police killings, 2013-2023: 2.1 per 100,000 people (66 total)
- Cases where officers faced professional/criminal/civil consequences: 0
- Gender of those killed: 93.9% male, 6.1% female
- Race/ethnicity of those killed: 69.7% white, 16.7% Black, 3.0% Hispanic, 0.0% Asian, 0.0% Native American
- Share of those killed with signs of a mental illness: 22.7% – 10th highest of 50 states
- Share of those killed who were unarmed: 7.6% – 5th lowest of 50 states
- Agency with the most killings in state: Des Moines Police Department; 8 total
41. Illinois
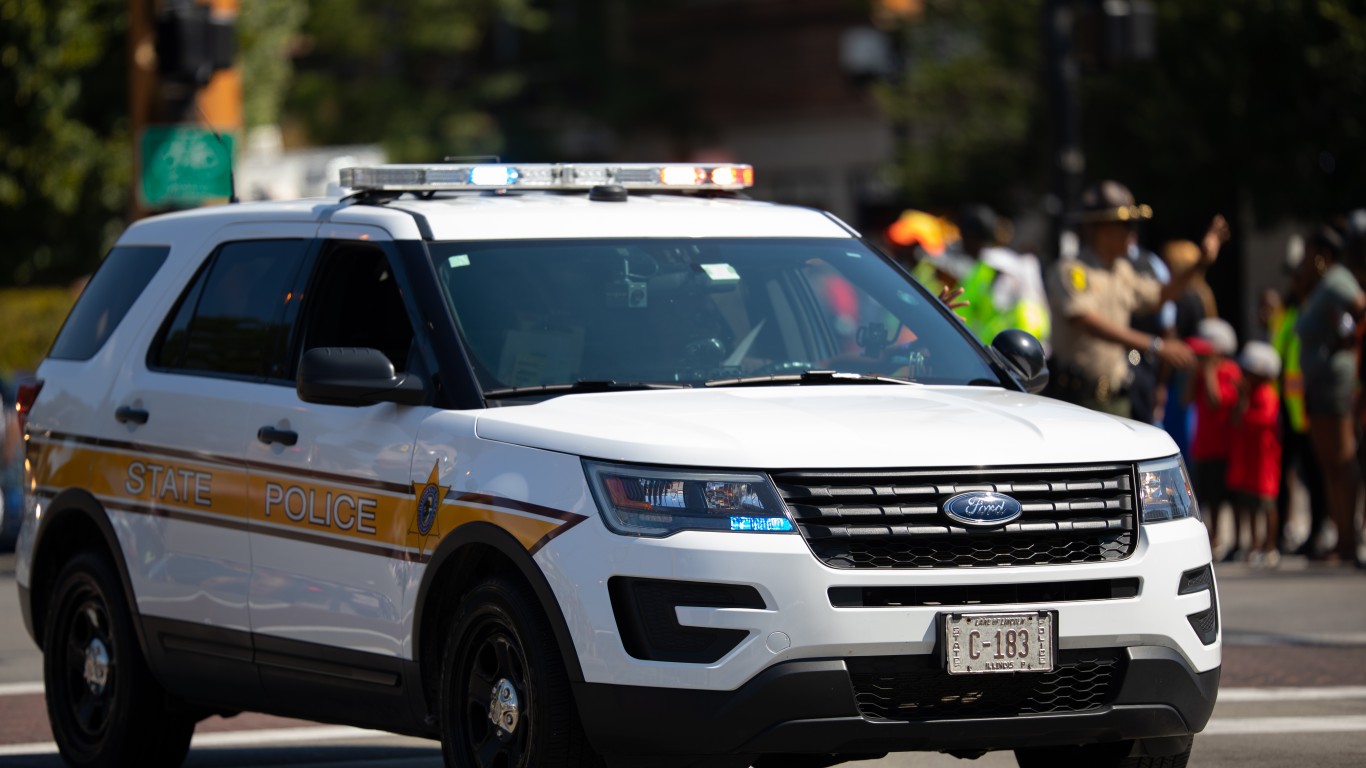
- Documented police killings, 2013-2023: 2.1 per 100,000 people (268 total)
- Cases where officers faced professional/criminal/civil consequences: 10 – 3.7% of total
- Gender of those killed: 95.5% male, 4.1% female
- Race/ethnicity of those killed: 29.5% white, 49.3% Black, 12.7% Hispanic, 0.4% Asian, 0.0% Native American
- Share of those killed with signs of a mental illness: 14.9% – 12th lowest of 50 states
- Share of those killed who were unarmed: 11.2% – 21st lowest of 50 states
- Agency with the most killings in state: Chicago Police Department; 95 total
40. Minnesota
- Documented police killings, 2013-2023: 2.1 per 100,000 people (122 total)
- Cases where officers faced professional/criminal/civil consequences: 6 – 4.9% of total
- Gender of those killed: 97.5% male, 2.5% female
- Race/ethnicity of those killed: 58.2% white, 23.0% Black, 4.9% Hispanic, 7.4% Asian, 4.1% Native American
- Share of those killed with signs of a mental illness: 26.2% – 6th highest of 50 states
- Share of those killed who were unarmed: 11.5% – 23rd lowest of 50 states
- Agency with the most killings in state: Minneapolis Police Department; 13 total
39. Virginia
- Documented police killings, 2013-2023: 2.3 per 100,000 people (202 total)
- Cases where officers faced professional/criminal/civil consequences: 17 – 8.4% of total
- Gender of those killed: 92.6% male, 6.9% female
- Race/ethnicity of those killed: 43.6% white, 39.6% Black, 4.0% Hispanic, 1.5% Asian, 0.5% Native American
- Share of those killed with signs of a mental illness: 23.3% – 9th highest of 50 states
- Share of those killed who were unarmed: 12.9% – 21st highest of 50 states
- Agency with the most killings in state: Virginia State Police; 15 total
38. Vermont
- Documented police killings, 2013-2023: 2.6 per 100,000 people (17 total)
- Cases where officers faced professional/criminal/civil consequences: 0
- Gender of those killed: 94.1% male, 5.9% female
- Race/ethnicity of those killed: 76.5% white, 0.0% Black, 11.8% Hispanic, 0.0% Asian, 5.9% Native American
- Share of those killed with signs of a mental illness: 29.4% – the highest of 50 states
- Share of those killed who were unarmed: 47.1% – the highest of 50 states
- Agency with the most killings in state: Vermont State Police; 5 total
37. Delaware

- Documented police killings, 2013-2023: 2.7 per 100,000 people (27 total)
- Cases where officers faced professional/criminal/civil consequences: 2 – 7.4% of total
- Gender of those killed: 96.3% male, 3.7% female
- Race/ethnicity of those killed: 40.7% white, 44.4% Black, 3.7% Hispanic, 0.0% Asian, 0.0% Native American
- Share of those killed with signs of a mental illness: 18.5% – 19th lowest of 50 states
- Share of those killed who were unarmed: 11.1% – 18th lowest of 50 states
- Agency with the most killings in state: Delaware State Police; 11 total
36. Ohio
- Documented police killings, 2013-2023: 2.7 per 100,000 people (319 total)
- Cases where officers faced professional/criminal/civil consequences: 11 – 3.4% of total
- Gender of those killed: 93.1% male, 6.6% female
- Race/ethnicity of those killed: 54.2% white, 39.5% Black, 1.3% Hispanic, 1.3% Asian, 0.0% Native American
- Share of those killed with signs of a mental illness: 21.9% – 15th highest of 50 states
- Share of those killed who were unarmed: 15.4% – 15th highest of 50 states
- Agency with the most killings in state: Columbus Division of Police; 45 total
35. North Dakota
- Documented police killings, 2013-2023: 2.7 per 100,000 people (21 total)
- Cases where officers faced professional/criminal/civil consequences: 0
- Gender of those killed: 100% male
- Race/ethnicity of those killed: 52.4% white, 0.0% Black, 4.8% Hispanic, 0.0% Asian, 38.1% Native American
- Share of those killed with signs of a mental illness: 14.3% – 9th lowest of 50 states
- Share of those killed who were unarmed: 19.0% – 7th highest of 50 states
- Agency with the most killings in state: Bismarck Police Department; 3 total
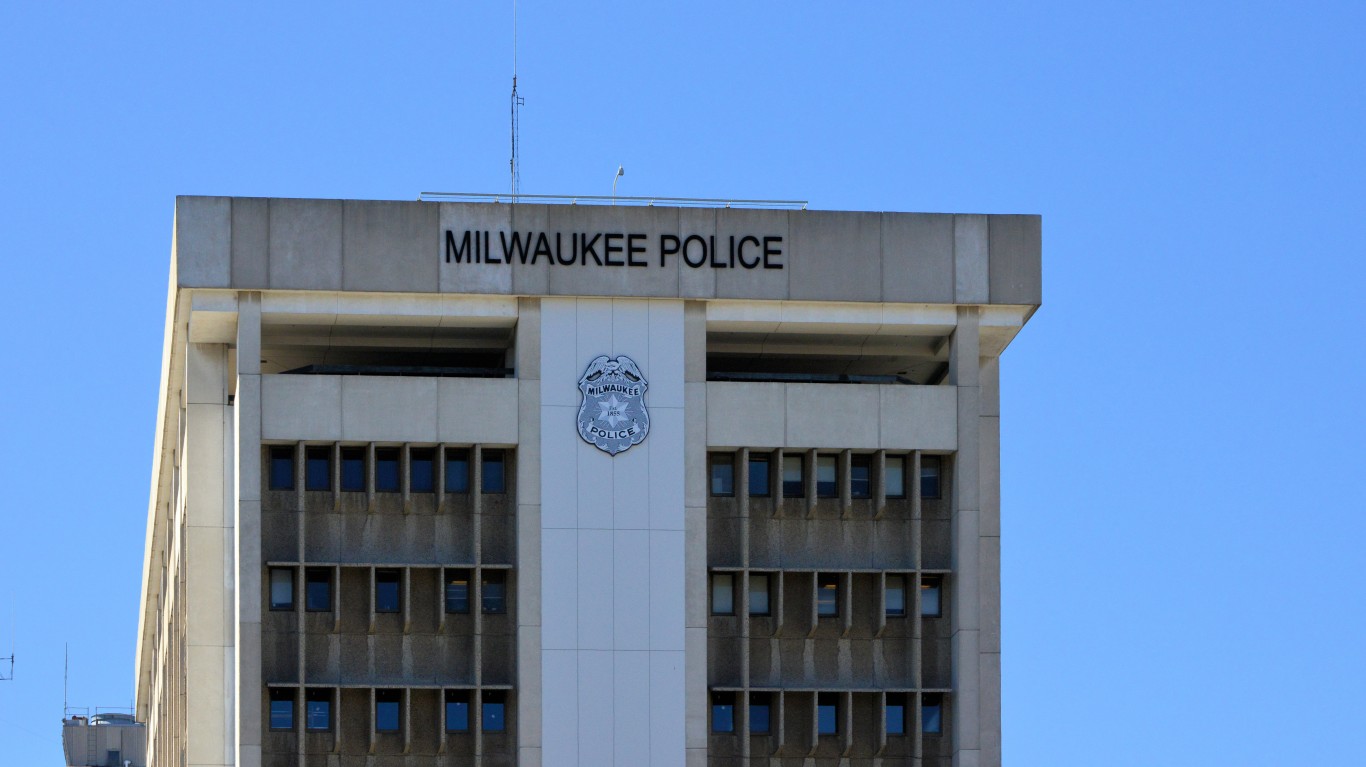
34. Wisconsin
- Documented police killings, 2013-2023: 2.8 per 100,000 people (164 total)
- Cases where officers faced professional/criminal/civil consequences: 4 – 2.4% of total
- Gender of those killed: 95.7% male, 3.7% female
- Race/ethnicity of those killed: 53.7% white, 27.4% Black, 6.7% Hispanic, 2.4% Asian, 3.0% Native American
- Share of those killed with signs of a mental illness: 27.4% – 4th highest of 50 states
- Share of those killed who were unarmed: 10.4% – 14th lowest of 50 states
- Agency with the most killings in state: Milwaukee Police Department; 28 total
33. Maryland
- Documented police killings, 2013-2023: 2.9 per 100,000 people (180 total)
- Cases where officers faced professional/criminal/civil consequences: 7 – 3.9% of total
- Gender of those killed: 94.4% male, 5.0% female
- Race/ethnicity of those killed: 27.2% white, 60.6% Black, 5.6% Hispanic, 0.6% Asian, 0.0% Native American
- Share of those killed with signs of a mental illness: 20.0% – 25th lowest of 50 states
- Share of those killed who were unarmed: 22.2% – 3rd highest of 50 states
- Agency with the most killings in state: Baltimore Police Department; 40 total
32. Indiana
- Documented police killings, 2013-2023: 3.0 per 100,000 people (201 total)
- Cases where officers faced professional/criminal/civil consequences: 3 – 1.5% of total
- Gender of those killed: 95.5% male, 4.0% female
- Race/ethnicity of those killed: 55.7% white, 30.8% Black, 4.5% Hispanic, 0.5% Asian, 0.0% Native American
- Share of those killed with signs of a mental illness: 21.4% – 18th highest of 50 states
- Share of those killed who were unarmed: 11.4% – 22nd lowest of 50 states
- Agency with the most killings in state: Indianapolis Metropolitan Police Department; 34 total
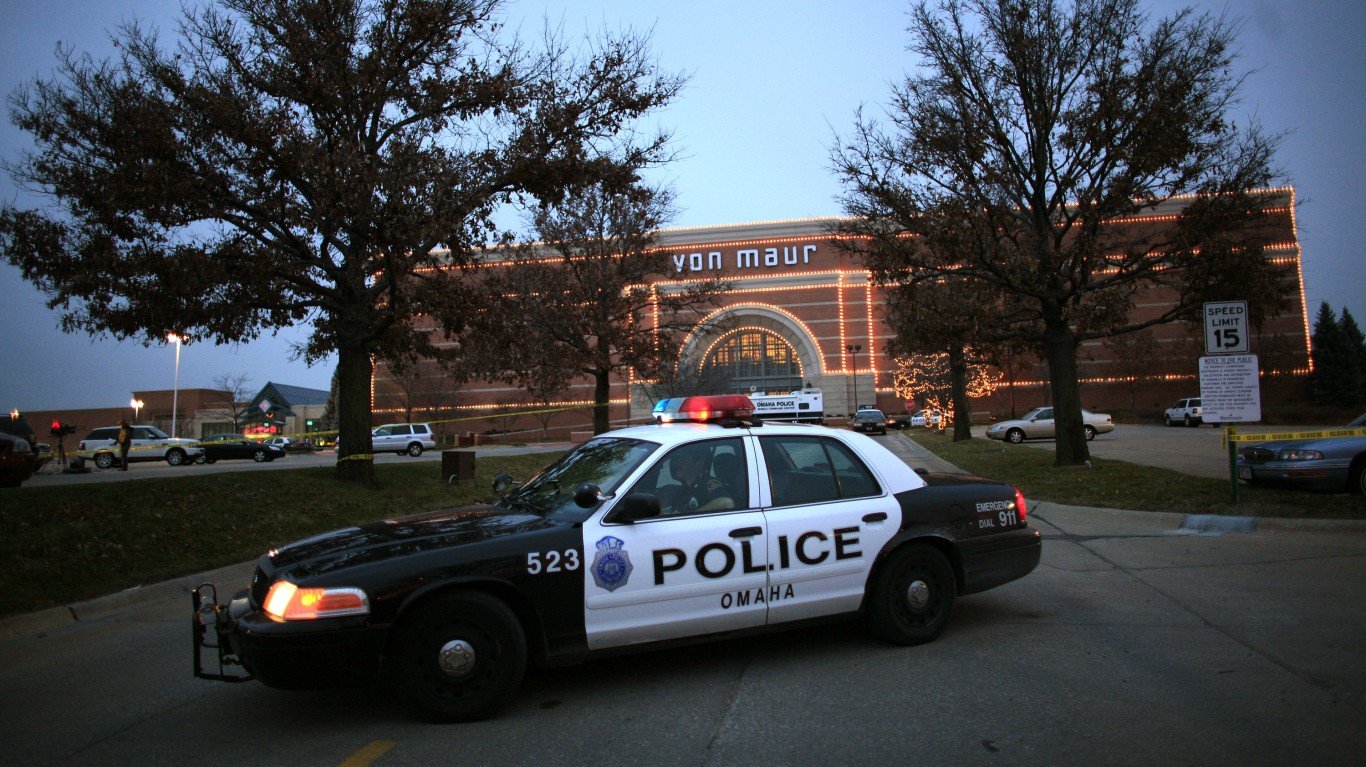
31. Nebraska
- Documented police killings, 2013-2023: 3.0 per 100,000 people (59 total)
- Cases where officers faced professional/criminal/civil consequences: 1 – 1.7% of total
- Gender of those killed: 94.9% male, 5.1% female
- Race/ethnicity of those killed: 64.4% white, 15.3% Black, 10.2% Hispanic, 1.7% Asian, 3.4% Native American
- Share of those killed with signs of a mental illness: 20.3% – 25th highest of 50 states
- Share of those killed who were unarmed: 15.3% – 16th highest of 50 states
- Agency with the most killings in state: Omaha Police Department; 22 total
30. North Carolina
- Documented police killings, 2013-2023: 3.1 per 100,000 people (331 total)
- Cases where officers faced professional/criminal/civil consequences: 12 – 3.6% of total
- Gender of those killed: 93.7% male, 6.3% female
- Race/ethnicity of those killed: 49.2% white, 33.5% Black, 6.0% Hispanic, 0.3% Asian, 0.3% Native American
- Share of those killed with signs of a mental illness: 22.4% – 11th highest of 50 states
- Share of those killed who were unarmed: 12.4% – 25th highest of 50 states
- Agency with the most killings in state: Charlotte-Mecklenburg Police Department; 28 total
29. Maine
- Documented police killings, 2013-2023: 3.4 per 100,000 people (47 total)
- Cases where officers faced professional/criminal/civil consequences: 1 – 2.1% of total
- Gender of those killed: 93.6% male, 6.4% female
- Race/ethnicity of those killed: 85.1% white, 2.1% Black, 2.1% Hispanic, 0.0% Asian, 2.1% Native American
- Share of those killed with signs of a mental illness: 21.3% – 20th highest of 50 states
- Share of those killed who were unarmed: 8.5% – 6th lowest of 50 states
- Agency with the most killings in state: Maine State Police; 7 total
28. South Carolina
- Documented police killings, 2013-2023: 3.6 per 100,000 people (185 total)
- Cases where officers faced professional/criminal/civil consequences: 14 – 7.6% of total
- Gender of those killed: 90.3% male, 9.7% female
- Race/ethnicity of those killed: 49.7% white, 36.8% Black, 1.1% Hispanic, 1.1% Asian, 0.0% Native American
- Share of those killed with signs of a mental illness: 19.5% – 22nd lowest of 50 states
- Share of those killed who were unarmed: 10.8% – 17th lowest of 50 states
- Agency with the most killings in state: Greenville County Sheriff’s Office; 18 total
27. Hawaii
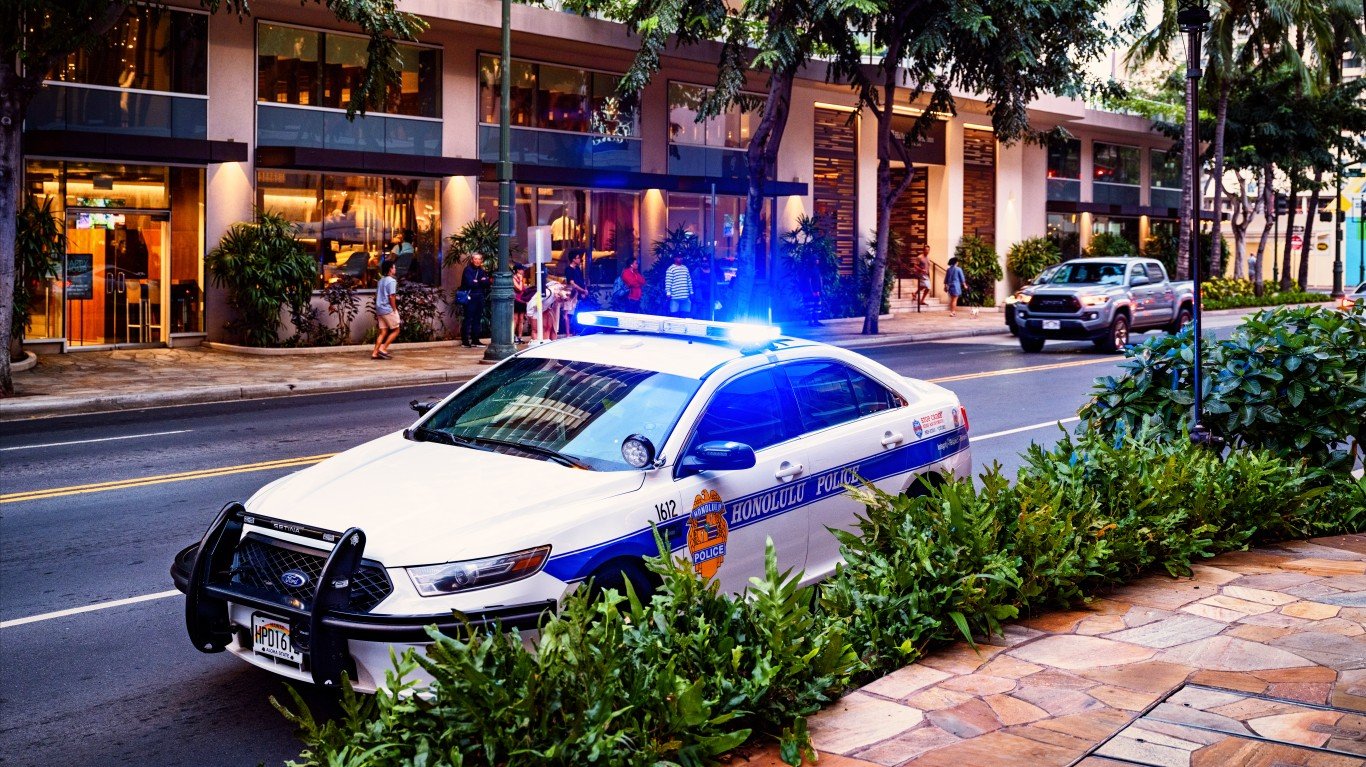
- Documented police killings, 2013-2023: 3.6 per 100,000 people (52 total)
- Cases where officers faced professional/criminal/civil consequences: 1 – 1.9% of total
- Gender of those killed: 96.2% male, 3.8% female
- Race/ethnicity of those killed: 13.5% white, 3.8% Black, 9.6% Hispanic, 7.7% Asian, 0.0% Native American
- Share of those killed with signs of a mental illness: 21.2% – 21st highest of 50 states
- Share of those killed who were unarmed: 21.2% – 5th highest of 50 states
- Agency with the most killings in state: Honolulu Police Department; 29 total
26. Texas
- Documented police killings, 2013-2023: 3.7 per 100,000 people (1,097 total)
- Cases where officers faced professional/criminal/civil consequences: 44 – 4.0% of total
- Gender of those killed: 93.8% male, 5.9% female
- Race/ethnicity of those killed: 33.4% white, 23.2% Black, 32.5% Hispanic, 1.5% Asian, 0.1% Native American
- Share of those killed with signs of a mental illness: 17.0% – 14th lowest of 50 states
- Share of those killed who were unarmed: 13.9% – 18th highest of 50 states
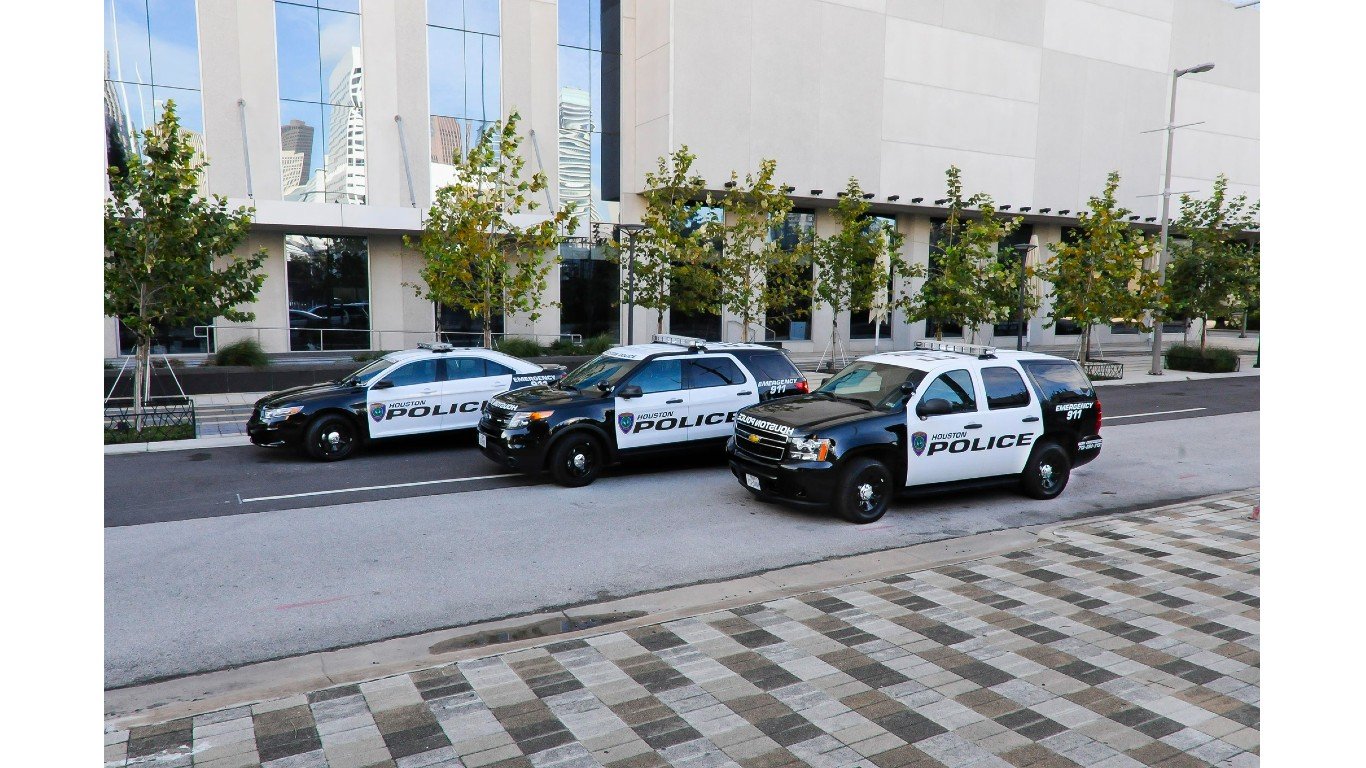
- Agency with the most killings in state: Houston Police Department; 104 total
25. Florida
- Documented police killings, 2013-2023: 3.7 per 100,000 people (810 total)
- Cases where officers faced professional/criminal/civil consequences: 9 – 1.1% of total
- Gender of those killed: 93.3% male, 6.4% female
- Race/ethnicity of those killed: 44.1% white, 31.1% Black, 14.1% Hispanic, 0.9% Asian, 0.1% Native American
- Share of those killed with signs of a mental illness: 21.1% – 22nd highest of 50 states
- Share of those killed who were unarmed: 15.4% – 14th highest of 50 states
- Agency with the most killings in state: Jacksonville Sheriff’s Office; 63 total
24. Kansas

- Documented police killings, 2013-2023: 3.8 per 100,000 people (111 total)
- Cases where officers faced professional/criminal/civil consequences: 2 – 1.8% of total
- Gender of those killed: 93.7% male, 6.3% female
- Race/ethnicity of those killed: 65.8% white, 14.4% Black, 11.7% Hispanic, 0.0% Asian, 0.0% Native American
- Share of those killed with signs of a mental illness: 19.8% – 24th lowest of 50 states
- Share of those killed who were unarmed: 12.6% – 23rd highest of 50 states
- Agency with the most killings in state: Wichita Police Department; 15 total
23. Utah
- Documented police killings, 2013-2023: 4.0 per 100,000 people (133 total)
- Cases where officers faced professional/criminal/civil consequences: 2 – 1.5% of total
- Gender of those killed: 95.5% male, 4.5% female
- Race/ethnicity of those killed: 64.7% white, 8.3% Black, 13.5% Hispanic, 0.8% Asian, 1.5% Native American
- Share of those killed with signs of a mental illness: 25.6% – 7th highest of 50 states
- Share of those killed who were unarmed: 12.8% – 22nd highest of 50 states
- Agency with the most killings in state: Salt Lake City Police Department; 19 total
22. Oregon
- Documented police killings, 2013-2023: 4.1 per 100,000 people (174 total)
- Cases where officers faced professional/criminal/civil consequences: 1 – 0.6% of total
- Gender of those killed: 97.1% male, 2.9% female
- Race/ethnicity of those killed: 70.1% white, 7.5% Black, 8.6% Hispanic, 0.0% Asian, 0.6% Native American
- Share of those killed with signs of a mental illness: 27.0% – 5th highest of 50 states
- Share of those killed who were unarmed: 9.8% – 11th lowest of 50 states
- Agency with the most killings in state: Portland Police Bureau; 23 total
21. Washington
- Documented police killings, 2013-2023: 4.1 per 100,000 people (319 total)
- Cases where officers faced professional/criminal/civil consequences: 5 – 1.6% of total
- Gender of those killed: 96.6% male, 3.1% female
- Race/ethnicity of those killed: 49.2% white, 11.6% Black, 12.5% Hispanic, 2.5% Asian, 3.8% Native American
- Share of those killed with signs of a mental illness: 24.8% – 8th highest of 50 states
- Share of those killed who were unarmed: 11.6% – 24th lowest of 50 states
- Agency with the most killings in state: Seattle Police Department; 30 total
20. Kentucky
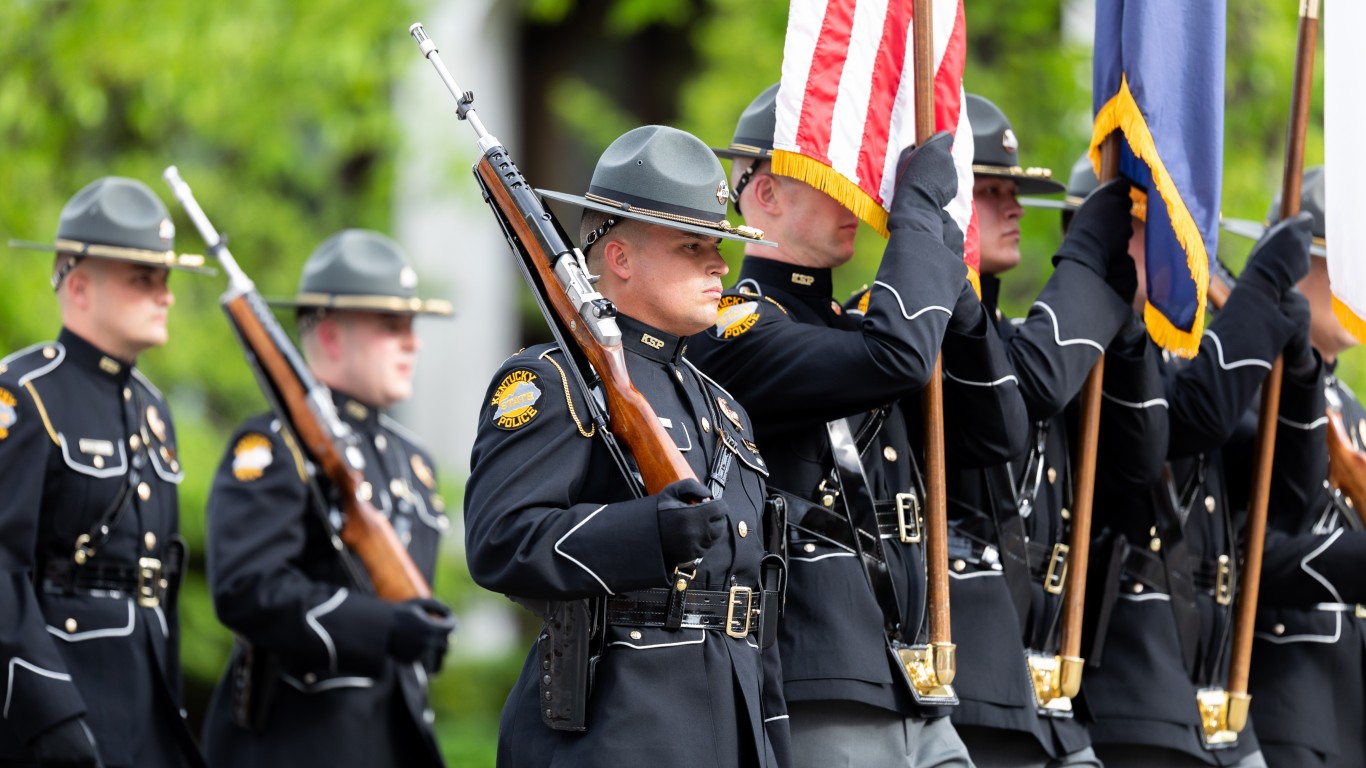
- Documented police killings, 2013-2023: 4.2 per 100,000 people (188 total)
- Cases where officers faced professional/criminal/civil consequences: 3 – 1.6% of total
- Gender of those killed: 94.7% male, 4.8% female
- Race/ethnicity of those killed: 68.1% white, 14.9% Black, 1.6% Hispanic, 0.5% Asian, 0.0% Native American
- Share of those killed with signs of a mental illness: 9.6% – the lowest of 50 states
- Share of those killed who were unarmed: 4.8% – the lowest of 50 states
- Agency with the most killings in state: Kentucky State Police; 57 total
19. Georgia

- Documented police killings, 2013-2023: 4.2 per 100,000 people (453 total)
- Cases where officers faced professional/criminal/civil consequences: 16 – 3.5% of total
- Gender of those killed: 93.4% male, 6.0% female
- Race/ethnicity of those killed: 38.0% white, 41.7% Black, 6.4% Hispanic, 1.1% Asian, 0.0% Native American
- Share of those killed with signs of a mental illness: 14.8% – 11th lowest of 50 states
- Share of those killed who were unarmed: 17.7% – 9th highest of 50 states
- Agency with the most killings in state: Atlanta Police Department; 28 total
18. Tennessee
- Documented police killings, 2013-2023: 4.2 per 100,000 people (296 total)
- Cases where officers faced professional/criminal/civil consequences: 8 – 2.7% of total
- Gender of those killed: 91.9% male, 7.8% female
- Race/ethnicity of those killed: 58.8% white, 24.7% Black, 3.0% Hispanic, 0.7% Asian, 0.0% Native American
- Share of those killed with signs of a mental illness: 18.9% – 21st lowest of 50 states
- Share of those killed who were unarmed: 11.1% – 20th lowest of 50 states
- Agency with the most killings in state: Memphis Police Department; 30 total
17. California
- Documented police killings, 2013-2023: 4.4 per 100,000 people (1,713 total)
- Cases where officers faced professional/criminal/civil consequences: 38 – 2.2% of total
- Gender of those killed: 94.3% male, 5.4% female
- Race/ethnicity of those killed: 26.7% white, 14.4% Black, 42.0% Hispanic, 3.5% Asian, 0.6% Native American
- Share of those killed with signs of a mental illness: 18.7% – 20th lowest of 50 states
- Share of those killed who were unarmed: 18.0% – 8th highest of 50 states
- Agency with the most killings in state: Los Angeles Police Department; 171 total
16. Alabama
- Documented police killings, 2013-2023: 4.4 per 100,000 people (223 total)
- Cases where officers faced professional/criminal/civil consequences: 8 – 3.6% of total
- Gender of those killed: 93.3% male, 6.3% female
- Race/ethnicity of those killed: 55.6% white, 34.5% Black, 0.9% Hispanic, 0.4% Asian, 0.0% Native American
- Share of those killed with signs of a mental illness: 17.9% – 17th lowest of 50 states
- Share of those killed who were unarmed: 15.7% – 13th highest of 50 states
- Agency with the most killings in state: Huntsville Police Department; 14 total
15. Idaho

- Documented police killings, 2013-2023: 4.5 per 100,000 people (85 total)
- Cases where officers faced professional/criminal/civil consequences: 1 – 1.2% of total
- Gender of those killed: 94.1% male, 5.9% female
- Race/ethnicity of those killed: 70.6% white, 1.2% Black, 10.6% Hispanic, 0.0% Asian, 3.5% Native American
- Share of those killed with signs of a mental illness: 11.8% – 7th lowest of 50 states
- Share of those killed who were unarmed: 5.9% – 4th lowest of 50 states
- Agency with the most killings in state: Boise Police Department; 11 total
14. South Dakota
- Documented police killings, 2013-2023: 4.6 per 100,000 people (41 total)
- Cases where officers faced professional/criminal/civil consequences: 0
- Gender of those killed: 97.6% male, 2.4% female
- Race/ethnicity of those killed: 46.3% white, 0.0% Black, 2.4% Hispanic, 2.4% Asian, 31.7% Native American
- Share of those killed with signs of a mental illness: 22.0% – 14th highest of 50 states
- Share of those killed who were unarmed: 12.2% – 25th lowest of 50 states
- Agency with the most killings in state: Rapid City Police Department; 14 total
13. Louisiana
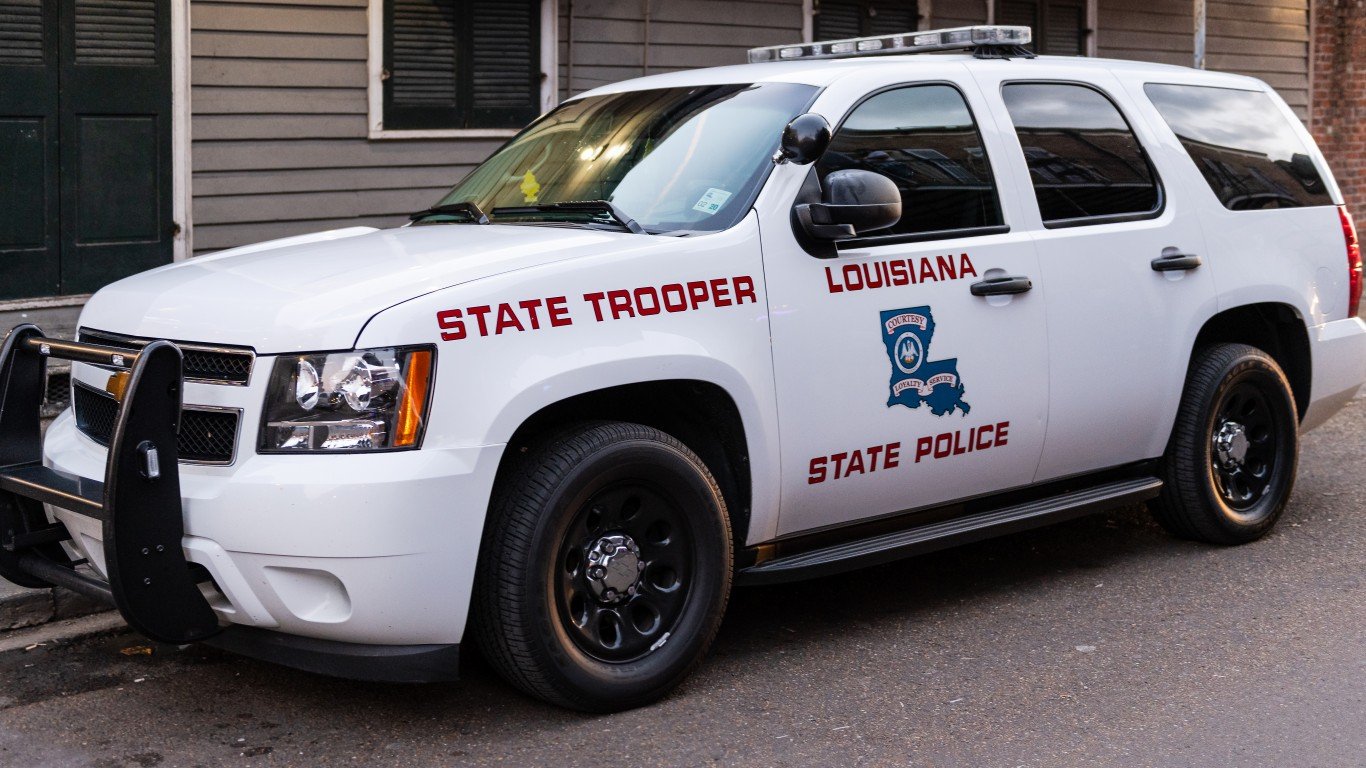
- Documented police killings, 2013-2023: 5.0 per 100,000 people (231 total)
- Cases where officers faced professional/criminal/civil consequences: 12 – 5.2% of total
- Gender of those killed: 96.5% male, 3.5% female
- Race/ethnicity of those killed: 32.5% white, 50.2% Black, 5.6% Hispanic, 1.3% Asian, 0.0% Native American
- Share of those killed with signs of a mental illness: 18.2% – 18th lowest of 50 states
- Share of those killed who were unarmed: 16.5% – 12th highest of 50 states
- Agency with the most killings in state: Jefferson Parish Sheriff’s Office; 20 total
12. Missouri
- Documented police killings, 2013-2023: 5.0 per 100,000 people (309 total)
- Cases where officers faced professional/criminal/civil consequences: 6 – 1.9% of total
- Gender of those killed: 95.1% male, 4.5% female
- Race/ethnicity of those killed: 48.2% white, 31.4% Black, 2.6% Hispanic, 0.0% Asian, 0.0% Native American
- Share of those killed with signs of a mental illness: 13.9% – 8th lowest of 50 states
- Share of those killed who were unarmed: 10.4% – 13th lowest of 50 states
- Agency with the most killings in state: St. Louis Metropolitan Police Department; 46 total
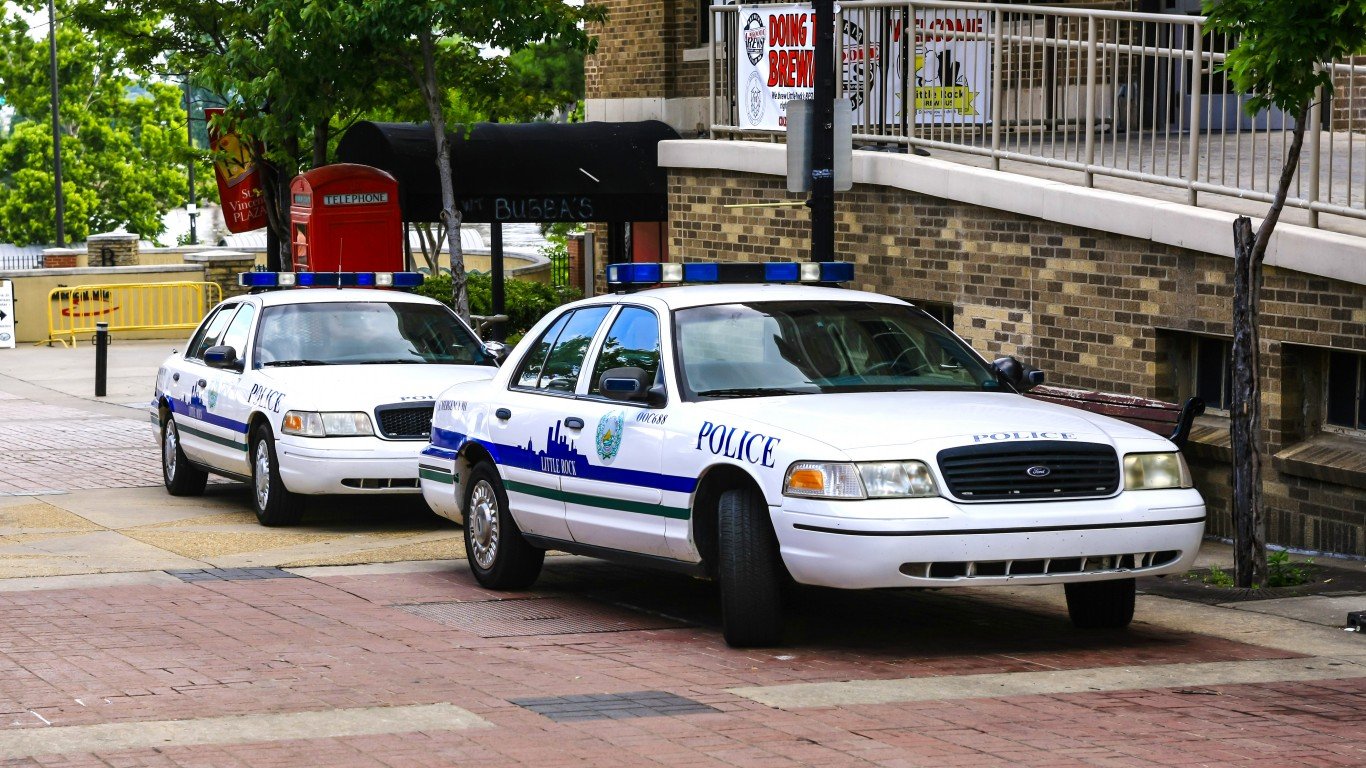
11. Arkansas
- Documented police killings, 2013-2023: 5.1 per 100,000 people (153 total)
- Cases where officers faced professional/criminal/civil consequences: 2 – 1.3% of total
- Gender of those killed: 97.4% male, 2.0% female
- Race/ethnicity of those killed: 57.5% white, 26.8% Black, 2.6% Hispanic, 1.3% Asian, 0.0% Native American
- Share of those killed with signs of a mental illness: 14.4% – 10th lowest of 50 states
- Share of those killed who were unarmed: 11.1% – 19th lowest of 50 states
- Agency with the most killings in state: Little Rock Police Department; 15 total
10. Mississippi
- Documented police killings, 2013-2023: 5.6 per 100,000 people (166 total)
- Cases where officers faced professional/criminal/civil consequences: 8 – 4.8% of total
- Gender of those killed: 92.2% male, 6.6% female
- Race/ethnicity of those killed: 43.4% white, 39.2% Black, 0.6% Hispanic, 0.6% Asian, 0.6% Native American
- Share of those killed with signs of a mental illness: 10.8% – 4th lowest of 50 states
- Share of those killed who were unarmed: 16.9% – 11th highest of 50 states
- Agency with the most killings in state: Jackson Police Department; 10 total
9. West Virginia
- Documented police killings, 2013-2023: 5.7 per 100,000 people (102 total)
- Cases where officers faced professional/criminal/civil consequences: 0
- Gender of those killed: 93.1% male, 3.9% female
- Race/ethnicity of those killed: 69.6% white, 10.8% Black, 0.0% Hispanic, 2.0% Asian, 0.0% Native American
- Share of those killed with signs of a mental illness: 20.6% – 24th highest of 50 states
- Share of those killed who were unarmed: 8.8% – 7th lowest of 50 states
- Agency with the most killings in state: West Virginia State Police; 18 total
8. Nevada
- Documented police killings, 2013-2023: 5.9 per 100,000 people (186 total)
- Cases where officers faced professional/criminal/civil consequences: 2 – 1.1% of total
- Gender of those killed: 95.2% male, 4.3% female
- Race/ethnicity of those killed: 47.8% white, 16.1% Black, 22.0% Hispanic, 1.1% Asian, 1.1% Native American
- Share of those killed with signs of a mental illness: 22.0% – 12th highest of 50 states
- Share of those killed who were unarmed: 9.1% – 9th lowest of 50 states
- Agency with the most killings in state: Las Vegas Metropolitan Police Department; 87 total
7. Montana
- Documented police killings, 2013-2023: 6.3 per 100,000 people (70 total)
- Cases where officers faced professional/criminal/civil consequences: 0
- Gender of those killed: 97.1% male, 2.9% female
- Race/ethnicity of those killed: 67.1% white, 2.9% Black, 1.4% Hispanic, 0.0% Asian, 12.9% Native American
- Share of those killed with signs of a mental illness: 11.4% – 6th lowest of 50 states
- Share of those killed who were unarmed: 5.7% – 3rd lowest of 50 states
- Agency with the most killings in state: Billings Police Department; 14 total
6. Wyoming
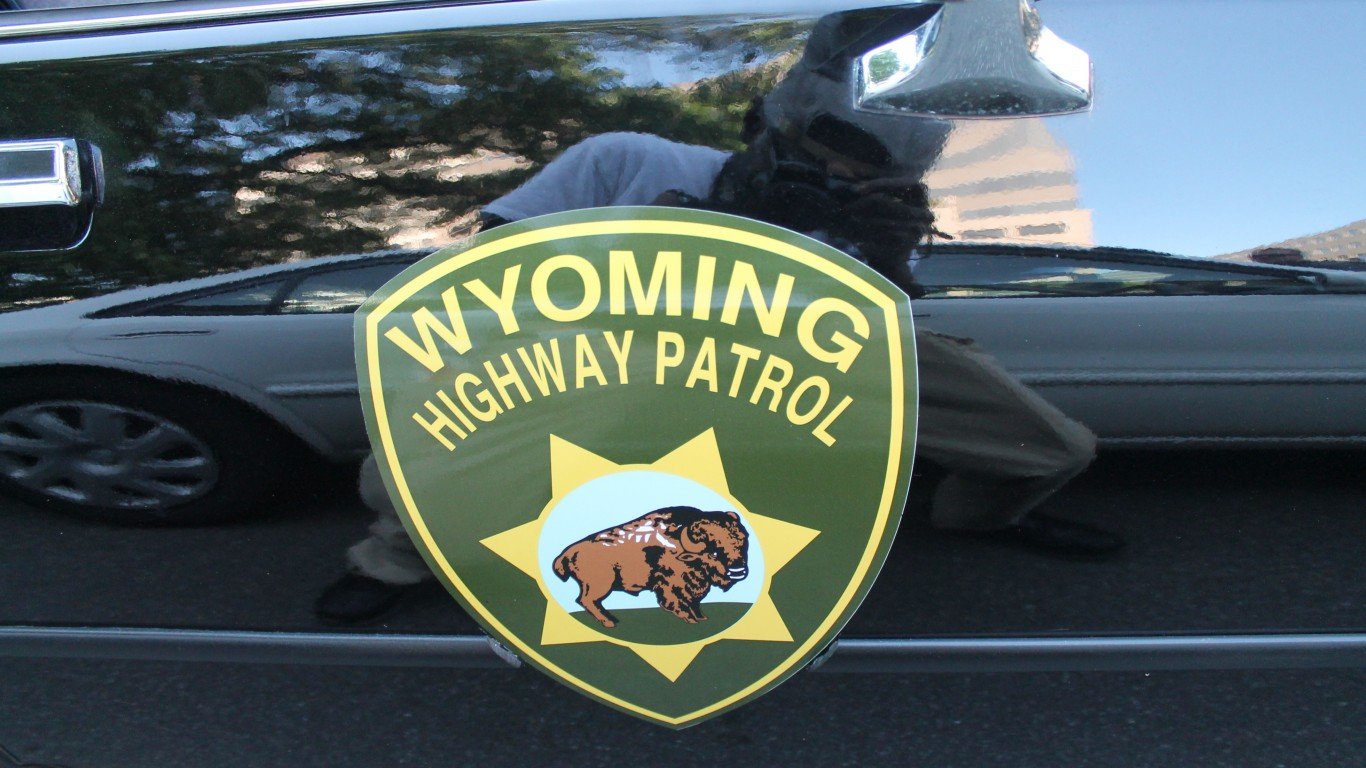
- Documented police killings, 2013-2023: 6.4 per 100,000 people (37 total)
- Cases where officers faced professional/criminal/civil consequences: 0
- Gender of those killed: 97.3% male, 2.7% female
- Race/ethnicity of those killed: 56.8% white, 8.1% Black, 10.8% Hispanic, 0.0% Asian, 5.4% Native American
- Share of those killed with signs of a mental illness: 10.8% – 3rd lowest of 50 states
- Share of those killed who were unarmed: 5.4% – 2nd lowest of 50 states
- Agency with the most killings in state: Casper Police Department; 9 total
5. Colorado
- Documented police killings, 2013-2023: 6.4 per 100,000 people (374 total)
- Cases where officers faced professional/criminal/civil consequences: 6 – 1.6% of total
- Gender of those killed: 96.0% male, 3.5% female
- Race/ethnicity of those killed: 45.7% white, 9.6% Black, 27.0% Hispanic, 1.1% Asian, 1.9% Native American
- Share of those killed with signs of a mental illness: 11.0% – 5th lowest of 50 states
- Share of those killed who were unarmed: 9.6% – 10th lowest of 50 states
- Agency with the most killings in state: Denver Police Department; 47 total
4. Arizona
- Documented police killings, 2013-2023: 7.1 per 100,000 people (517 total)
- Cases where officers faced professional/criminal/civil consequences: 4 – 0.8% of total
- Gender of those killed: 95.2% male, 4.6% female
- Race/ethnicity of those killed: 36.9% white, 10.4% Black, 33.3% Hispanic, 0.0% Asian, 3.7% Native American
- Share of those killed with signs of a mental illness: 17.8% – 16th lowest of 50 states
- Share of those killed who were unarmed: 14.3% – 17th highest of 50 states
- Agency with the most killings in state: Phoenix Police Department; 150 total
3. Oklahoma

- Documented police killings, 2013-2023: 7.8 per 100,000 people (311 total)
- Cases where officers faced professional/criminal/civil consequences: 11 – 3.5% of total
- Gender of those killed: 95.8% male, 4.2% female
- Race/ethnicity of those killed: 56.3% white, 21.2% Black, 8.7% Hispanic, 0.6% Asian, 6.4% Native American
- Share of those killed with signs of a mental illness: 19.6% – 23rd lowest of 50 states
- Share of those killed who were unarmed: 13.2% – 20th highest of 50 states
- Agency with the most killings in state: Oklahoma City Police Department; 58 total
2. Alaska
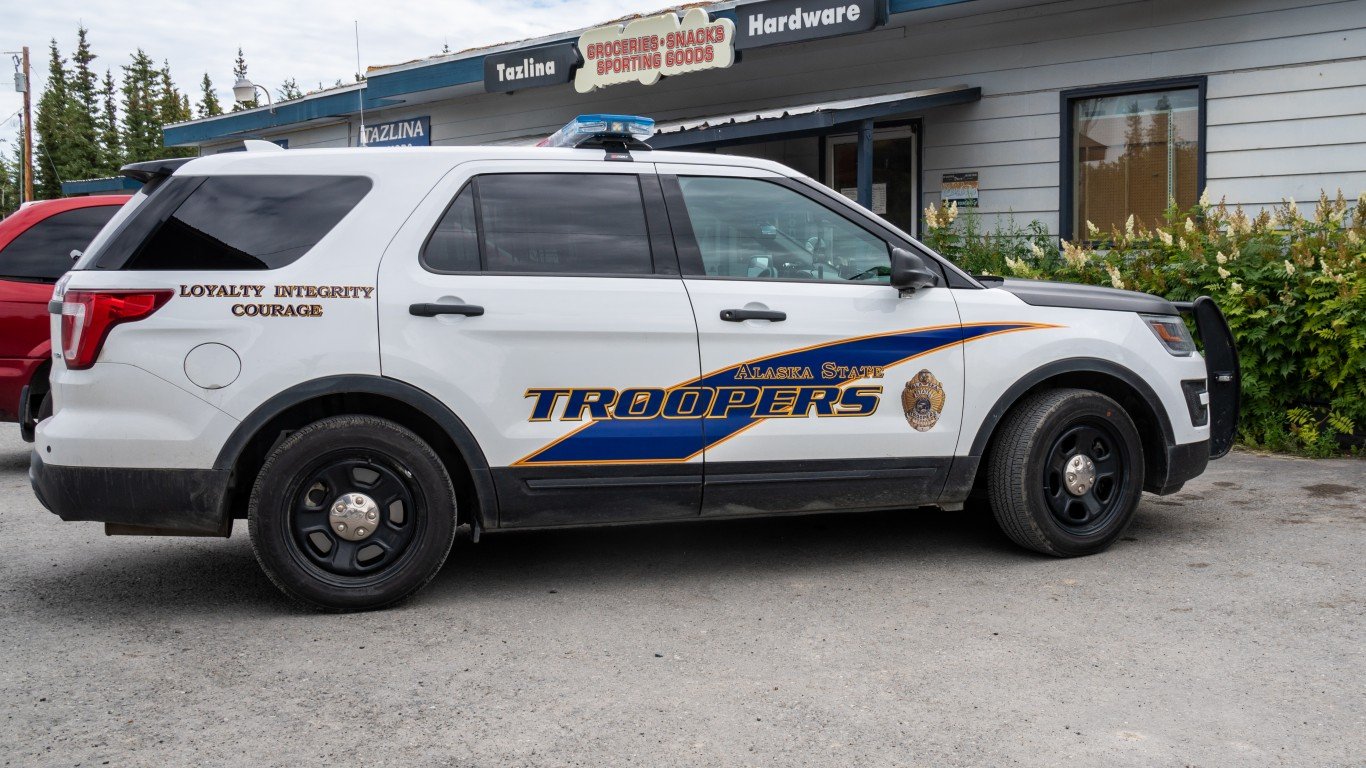
- Documented police killings, 2013-2023: 9.0 per 100,000 people (66 total)
- Cases where officers faced professional/criminal/civil consequences: 0
- Gender of those killed: 95.5% male, 4.5% female
- Race/ethnicity of those killed: 47.0% white, 7.6% Black, 1.5% Hispanic, 0.0% Asian, 22.7% Native American
- Share of those killed with signs of a mental illness: 15.2% – 13th lowest of 50 states
- Share of those killed who were unarmed: 9.1% – 8th lowest of 50 states
- Agency with the most killings in state: Alaska State Troopers; 24 total
1. New Mexico
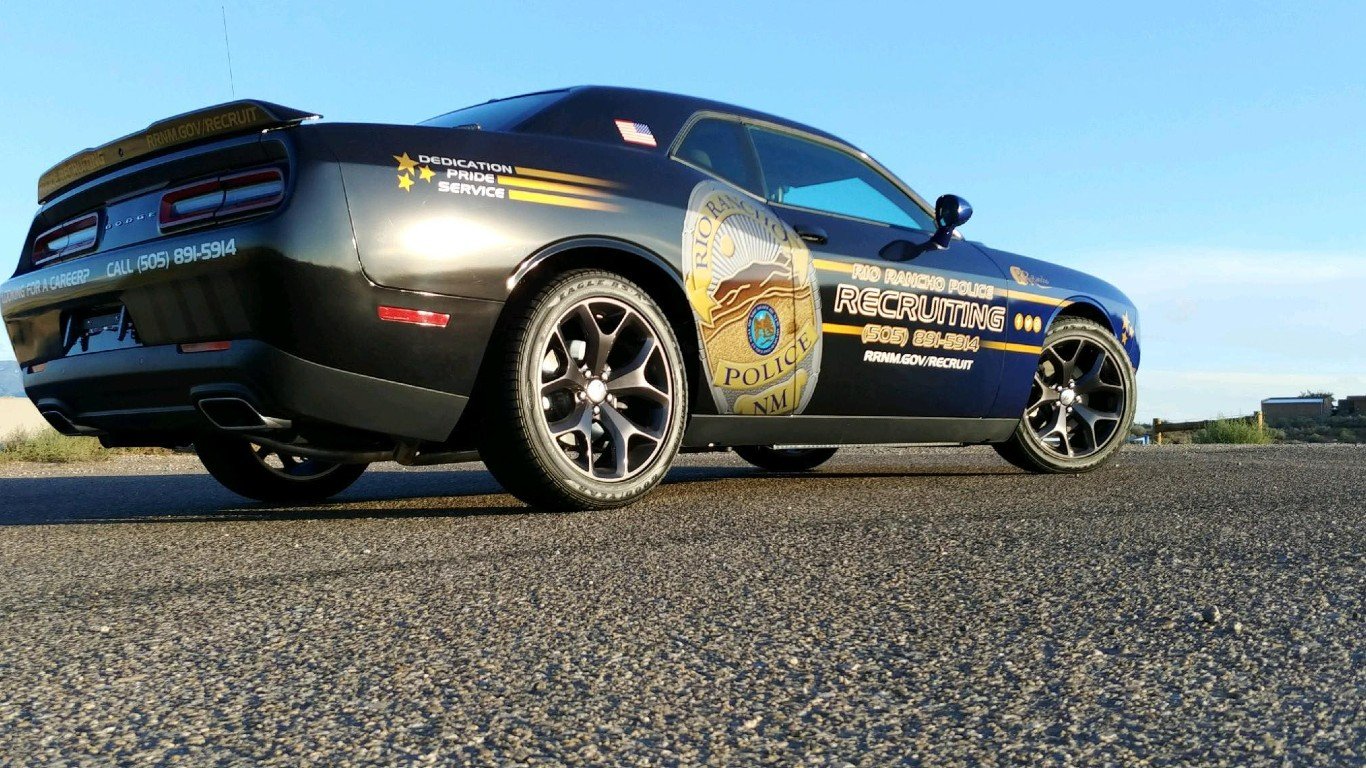
- Documented police killings, 2013-2023: 10.9 per 100,000 people (231 total)
- Cases where officers faced professional/criminal/civil consequences: 4 – 1.7% of total
- Gender of those killed: 93.1% male, 5.6% female
- Race/ethnicity of those killed: 26.4% white, 4.8% Black, 53.7% Hispanic, 0.4% Asian, 3.9% Native American
- Share of those killed with signs of a mental illness: 17.3% – 15th lowest of 50 states
- Share of those killed who were unarmed: 10.4% – 15th lowest of 50 states
- Agency with the most killings in state: Albuquerque Police Department; 52 total
Methodology
To identify the states where the most people are killed by law enforcement, 24/7 Wall St. reviewed data from Mapping Police Violence, a research collaborative that collects data on police killings across the nation from the country’s three largest comprehensive and impartial crowdsourced databases.
States are ranked by the number of reported police killings from the beginning of 2013 through the end of May 2023 for every 100,000 people. Population data used to adjust the number of killings is from the U.S. Census Bureau’s 2021 American Community Survey. The total number of killings includes those carried out by off-duty law enforcement officers.
All supplemental data came from the Mapping Police Violence database, including demographic data on the gender and race or ethnicity of those killed, the share of those killed who showed signs of mental illness, killings by specific law enforcement agencies, and the share of those killed who were armed, whether with a firearm, edged weapon, blunt object, or vehicle.
Law enforcement officers involved in these cases were only considered to have faced official consequences if they were charged with a crime (regardless of whether or not they were convicted), sued in civil court, fired, ticketed, or put on leave.
Cases in which an investigation is still pending, or where the actions of a law enforcement officer were deemed justified by a grand jury or official state or local attorney were not counted among the total cases that resulted in official consequences.
Contact [email protected] for any questions or corrections.