Key Points
- In certain situations, police officers are authorized to use deadly force, and since the beginning of 2020, more than 6,000 people in the U.S. have been killed by American law enforcement.
- Nationwide, there have been approximately 1.8 police killings for every 100,000 people in the last five years — but in some parts of the country, deadly police violence is far more common.
- Also: Discover the next Nvidia
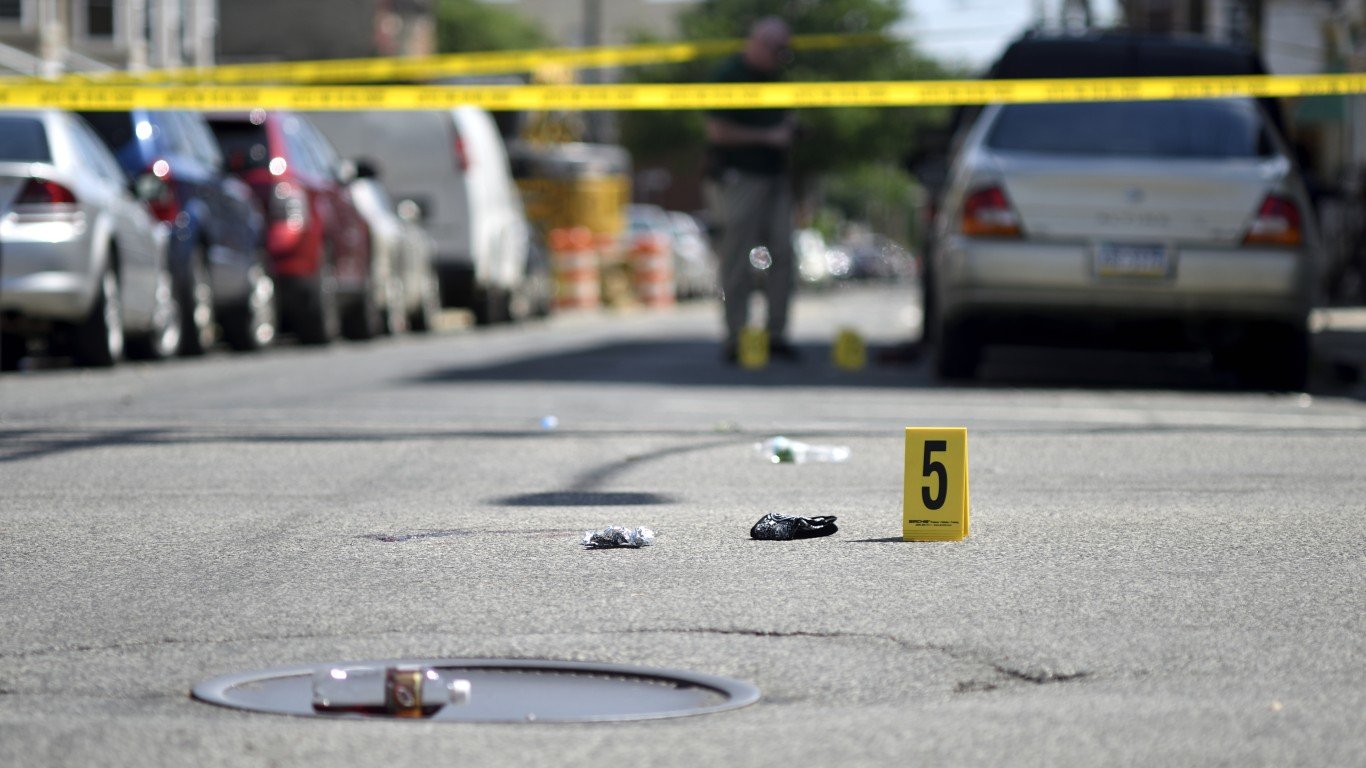
In the early morning hours of Sunday, October 6, 2025, six officers from the New York City Police Department responded to a 911 call in the Canarsie neighborhood of Brooklyn. The call was from a woman who said a 28-year-old man she knew was harassing her at her door; she stated that she was in the process of seeking an order of protection. The officers located the suspect leaving the building and pursued him southbound on East 86th Street, eventually encountering him on Coventry Road. The suspect was holding a firearm; after repeated orders to drop the weapon went unheeded, the officers shot him once in the chest. He was transported by patrol car to Kings County Hospital, where he later died.
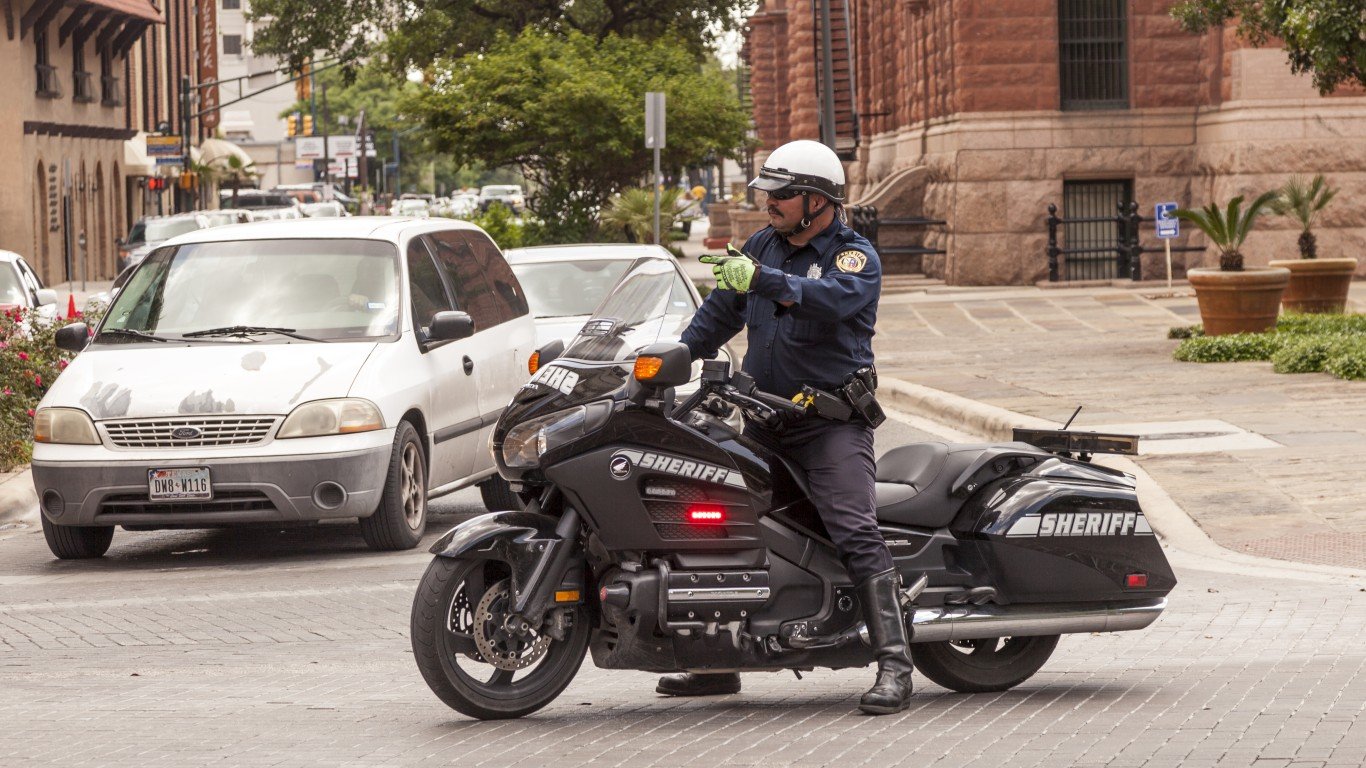
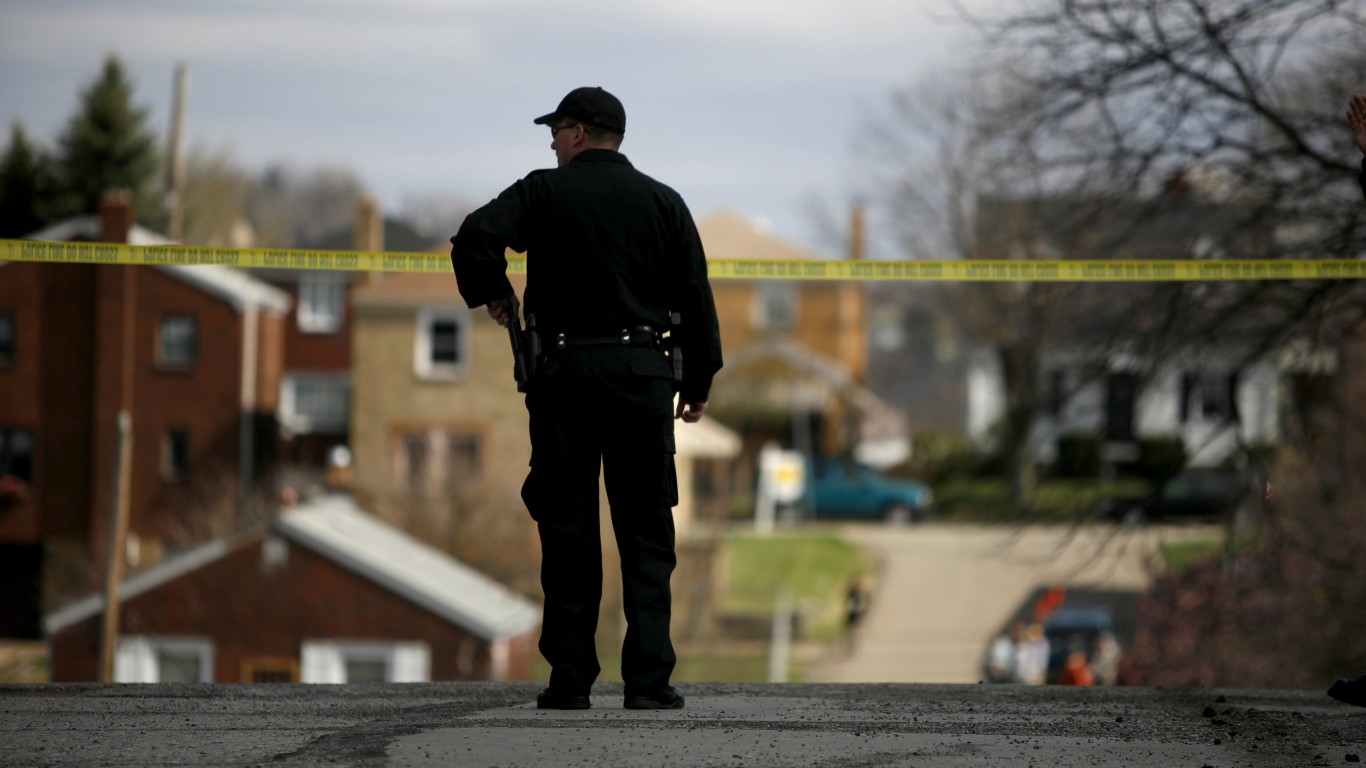
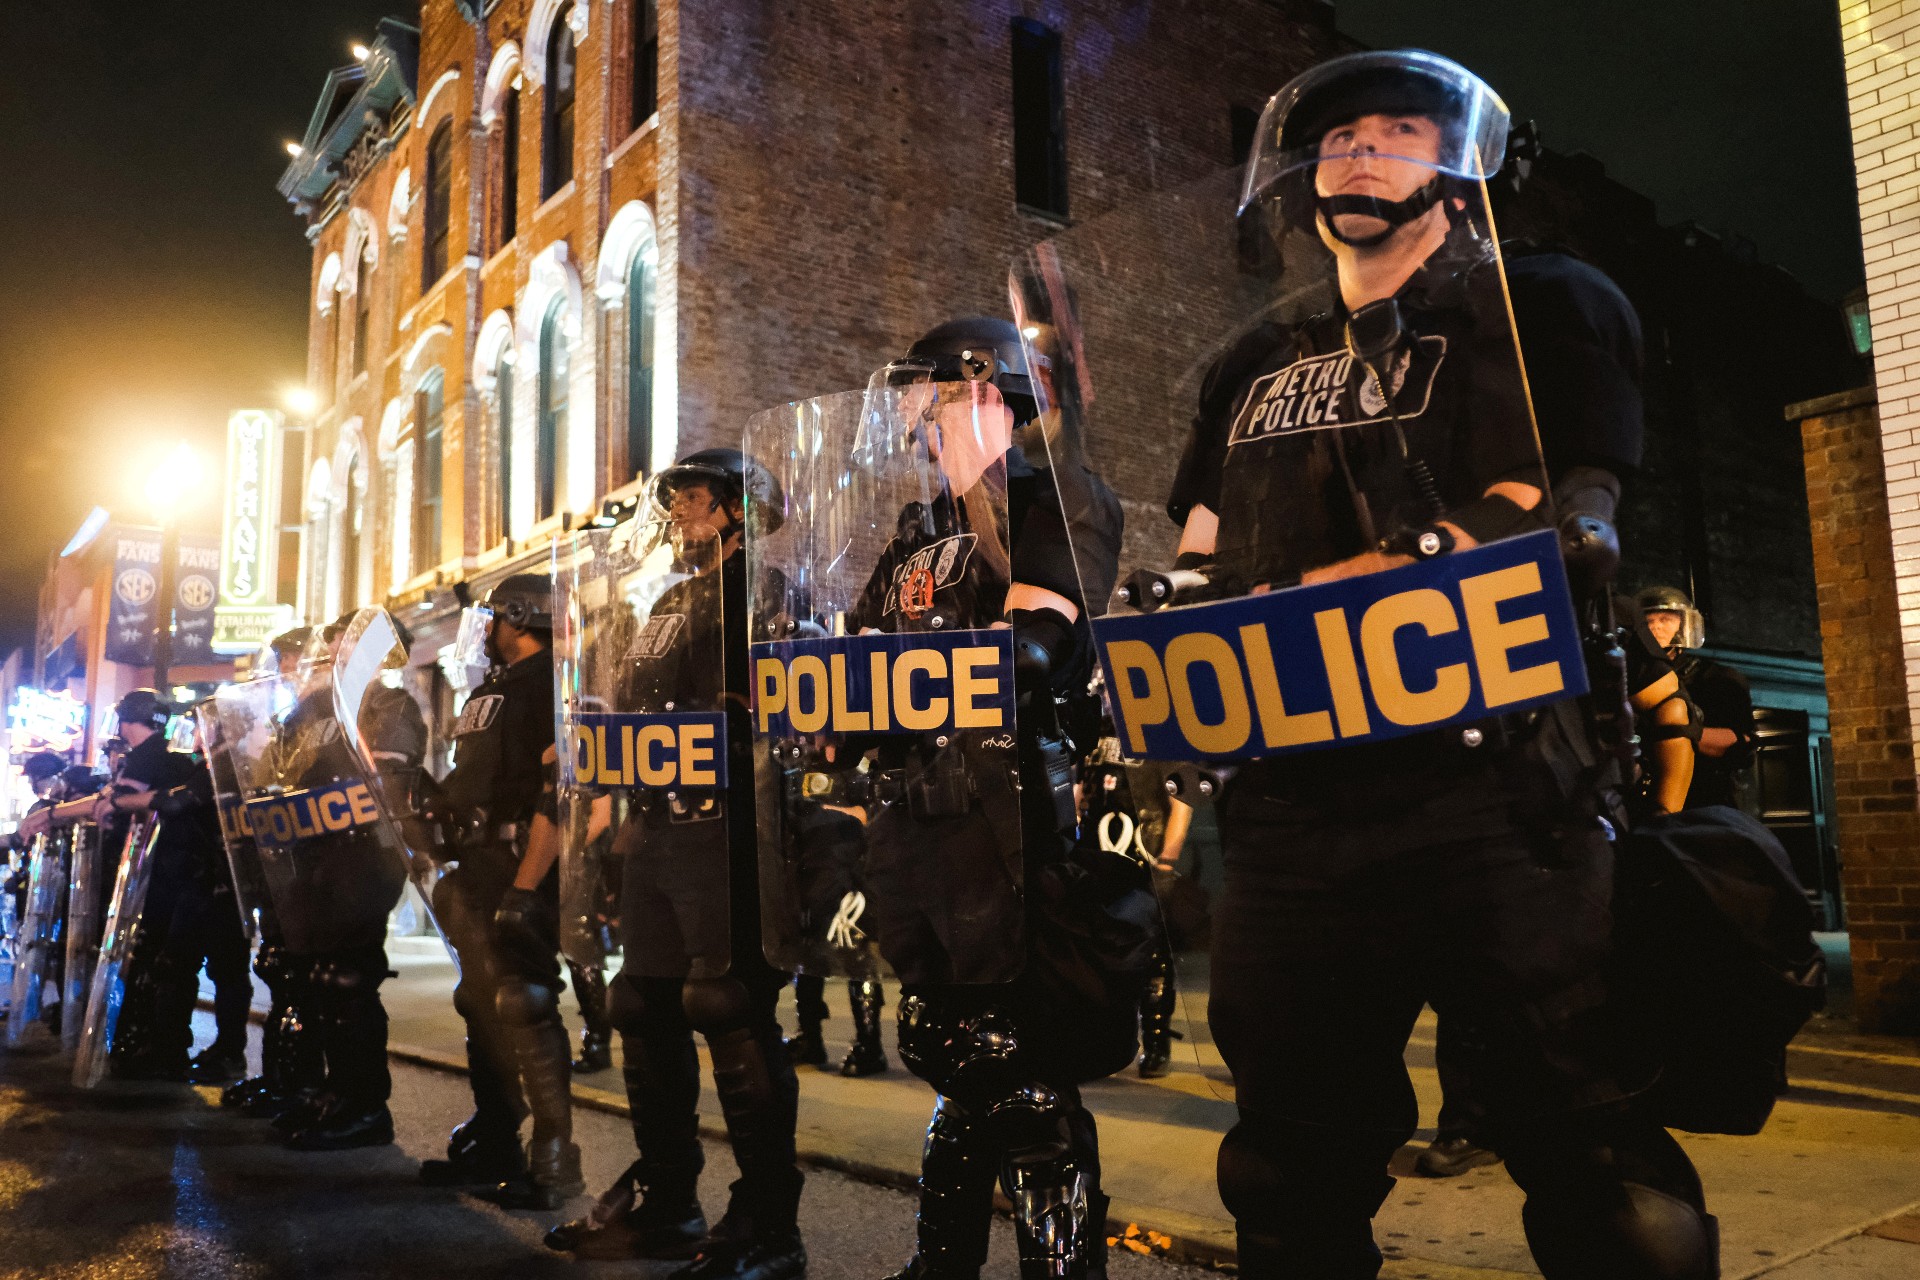
Law enforcement is one of the most dangerous jobs in the United States. Responsible for preventing crime and arresting suspects, police officers are regularly put in potentially volatile and dangerous situations. According to the FBI, 1,023 American police men and women were killed on duty in the last decade, and more than 79,000 were assaulted in 2023 alone.
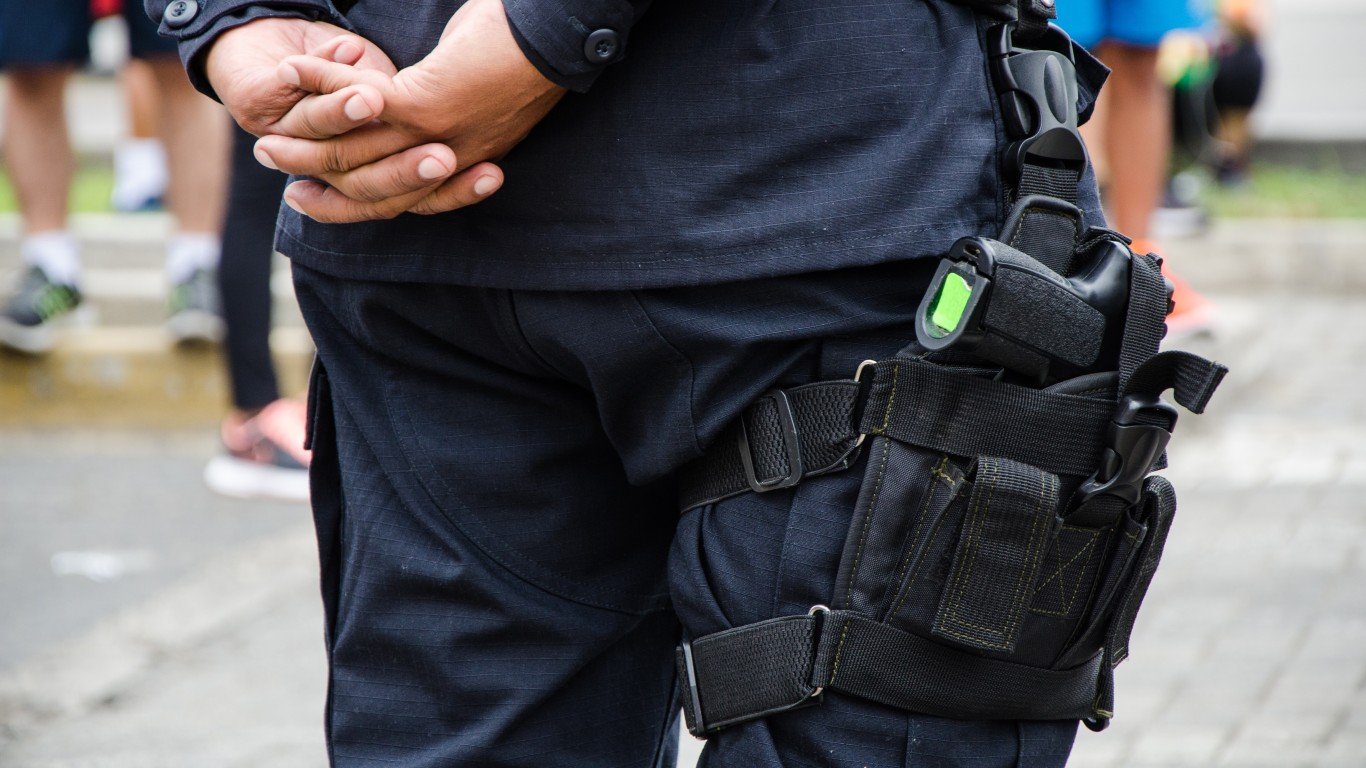
Because of the nature of their work, police typically carry a firearm, which they are authorized to use in cases where officers or members of the public are in imminent danger. While the circumstances in which police use of deadly force can be justified are well defined. But, in practice, officers often have to make split-second judgement calls — often based on limited information. (Here is a look at the most commonly used police firearms.)
Between January 2020 and October 2024, more than 6,000 people have been killed by law enforcement officials — both on duty and off — in the United States. Many of these killings have been deemed justifiable. Others, meanwhile, were accidental, and some stand as clear examples of abuses of power.
Using data from Mapping Police Violence, a research collaborative that collects data on police killings, 24/7 Wall St. identified the states with the most police killings. States are ranked by the number of people killed by police officers from January 2020 through October 2024 for every 100,000 people. Population data used to calculate the rate of police killings are 2023 estimates from the U.S. Census Bureau’s American Community Survey.
Across the 50 states, the number of people killed by police since the beginning of 2020 ranges from fewer than 10 to more than 700. Adjusting for population, the rate of police killings by state ranges from 0.5 for every 100,000 people to 6.3 per 100,000. For context, there were about 1.8 police killings per 100,000 people across the U.S. over the same period. (Here is a look at the states with the most gun-related crime.)
Nationwide, about 20% of those killed by police since January 2020 displayed signs of mental illness, and nearly 17% of Americans killed at the hands of police were unarmed. It is important to note that, despite these circumstances, many of these killings that are not still under investigation were deemed justified by oversight officials.
From a demographic perspective, the vast majority of those killed by police — nearly 94% — were men. Additionally, about 41% of Americans killed by law enforcement were white, 24% were Black, 18% were Hispanic, and fewer than 2% were Asian or Native American. These demographic ratios can vary considerably by state, however.
This post was updated on November 2, 2025 to include details of the recent police killing in Brooklyn.
Why It Matters
Law enforcement is one of the most dangerous jobs in the United States — and due to the nature of the work, police are authorized to use deadly force in certain situations. While most police killings are deemed justifiable, many are accidental or clear cases of abuse of power. Right or wrong, police use of deadly force is far more common in some states than in others.
50. Rhode Island

- Documented police killings, Jan. 2020 – Oct. 2024: 0.5 per 100,000 people (5 total)
- Gender of those killed: 100% male, 0% female
- Race/ethnicity of those killed: 100% White, 0% Black, 0% Hispanic, 0% Native American, 0% Asian
- Share of those killed with signs of a mental illness: 20.0% — 24th lowest of 50 states
- Share of those killed who were unarmed: 20.0% — 12th highest of 50 states
49. Massachusetts

- Documented police killings, Jan. 2020 – Oct. 2024: 0.5 per 100,000 people (33 total)
- Gender of those killed: 87.9% male, 12.1% female
- Race/ethnicity of those killed: 60.6% White, 24.2% Black, 6.1% Hispanic, 0% Native American, 6.1% Asian
- Share of those killed with signs of a mental illness: 36.4% — 2nd highest of 50 states
- Share of those killed who were unarmed: 18.2% — 16th highest of 50 states
48. Connecticut
- Documented police killings, Jan. 2020 – Oct. 2024: 0.7 per 100,000 people (24 total)
- Gender of those killed: 91.7% male, 8.3% female
- Race/ethnicity of those killed: 37.5% White, 37.5% Black, 25.0% Hispanic, 0% Native American, 0% Asian
- Share of those killed with signs of a mental illness: 20.8% — 25th highest of 50 states
- Share of those killed who were unarmed: 37.5% — 2nd highest of 50 states
47. New Jersey

- Documented police killings, Jan. 2020 – Oct. 2024: 0.7 per 100,000 people (67 total)
- Gender of those killed: 91.0% male, 9.0% female
- Race/ethnicity of those killed: 31.3% White, 26.9% Black, 14.9% Hispanic, 0% Native American, 7.5% Asian
- Share of those killed with signs of a mental illness: 23.9% — 14th highest of 50 states
- Share of those killed who were unarmed: 37.3% — 3rd highest of 50 states
46. New York
- Documented police killings, Jan. 2020 – Oct. 2024: 0.8 per 100,000 people (148 total)
- Gender of those killed: 90.5% male, 9.5% female
- Race/ethnicity of those killed: 31.8% White, 40.5% Black, 10.1% Hispanic, 0% Native American, 3.4% Asian
- Share of those killed with signs of a mental illness: 26.4% — 8th highest of 50 states
- Share of those killed who were unarmed: 29.1% — 5th highest of 50 states
45. Minnesota
- Documented police killings, Jan. 2020 – Oct. 2024: 0.9 per 100,000 people (53 total)
- Gender of those killed: 94.3% male, 5.7% female
- Race/ethnicity of those killed: 56.6% White, 28.3% Black, 3.8% Hispanic, 1.9% Native American, 3.8% Asian
- Share of those killed with signs of a mental illness: 20.8% — 25th lowest of 50 states
- Share of those killed who were unarmed: 11.3% — 11th lowest of 50 states
44. Pennsylvania
- Documented police killings, Jan. 2020 – Oct. 2024: 1.0 per 100,000 people (136 total)
- Gender of those killed: 91.9% male, 6.6% female
- Race/ethnicity of those killed: 53.7% White, 25.0% Black, 5.9% Hispanic, 0% Native American, 1.5% Asian
- Share of those killed with signs of a mental illness: 22.8% — 19th highest of 50 states
- Share of those killed who were unarmed: 13.2% — 20th lowest of 50 states
43. Vermont
- Documented police killings, Jan. 2020 – Oct. 2024: 1.1 per 100,000 people (7 total)
- Gender of those killed: 85.7% male, 14.3% female
- Race/ethnicity of those killed: 71.4% White, 0% Black, 14.3% Hispanic, 0% Native American, 0% Asian
- Share of those killed with signs of a mental illness: 14.3% — 11th lowest of 50 states
- Share of those killed who were unarmed: 42.9% — the highest of 50 states
42. Iowa

- Documented police killings, Jan. 2020 – Oct. 2024: 1.1 per 100,000 people (35 total)
- Gender of those killed: 97.1% male, 2.9% female
- Race/ethnicity of those killed: 71.4% White, 17.1% Black, 2.9% Hispanic, 0% Native American, 0% Asian
- Share of those killed with signs of a mental illness: 28.6% — 4th highest of 50 states
- Share of those killed who were unarmed: 17.1% — 20th highest of 50 states
41. Illinois
- Documented police killings, Jan. 2020 – Oct. 2024: 1.1 per 100,000 people (137 total)
- Gender of those killed: 90.5% male, 8.8% female
- Race/ethnicity of those killed: 37.2% White, 41.6% Black, 12.4% Hispanic, 0% Native American, 0.7% Asian
- Share of those killed with signs of a mental illness: 21.9% — 21st highest of 50 states
- Share of those killed who were unarmed: 20.4% — 9th highest of 50 states
40. Maryland
- Documented police killings, Jan. 2020 – Oct. 2024: 1.2 per 100,000 people (74 total)
- Gender of those killed: 95.9% male, 4.1% female
- Race/ethnicity of those killed: 27.0% White, 59.5% Black, 8.1% Hispanic, 0% Native American, 1.4% Asian
- Share of those killed with signs of a mental illness: 25.7% — 10th highest of 50 states
- Share of those killed who were unarmed: 23.0% — 6th highest of 50 states
39. Michigan
- Documented police killings, Jan. 2020 – Oct. 2024: 1.2 per 100,000 people (123 total)
- Gender of those killed: 94.3% male, 5.7% female
- Race/ethnicity of those killed: 48.0% White, 30.9% Black, 2.4% Hispanic, 0.8% Native American, 0.8% Asian
- Share of those killed with signs of a mental illness: 25.2% — 11th highest of 50 states
- Share of those killed who were unarmed: 14.6% — 23rd lowest of 50 states
38. Delaware
- Documented police killings, Jan. 2020 – Oct. 2024: 1.3 per 100,000 people (13 total)
- Gender of those killed: 76.9% male, 23.1% female
- Race/ethnicity of those killed: 23.1% White, 46.2% Black, 15.4% Hispanic, 0% Native American, 0% Asian
- Share of those killed with signs of a mental illness: 23.1% — 17th highest of 50 states
- Share of those killed who were unarmed: 15.4% — 25th lowest of 50 states
37. Virginia

- Documented police killings, Jan. 2020 – Oct. 2024: 1.4 per 100,000 people (124 total)
- Gender of those killed: 91.1% male, 8.1% female
- Race/ethnicity of those killed: 46.8% White, 30.6% Black, 4.0% Hispanic, 0.8% Native American, 0.8% Asian
- Share of those killed with signs of a mental illness: 21.8% — 22nd highest of 50 states
- Share of those killed who were unarmed: 13.7% — 22nd lowest of 50 states
36. Ohio
- Documented police killings, Jan. 2020 – Oct. 2024: 1.4 per 100,000 people (168 total)
- Gender of those killed: 91.7% male, 8.3% female
- Race/ethnicity of those killed: 50.6% White, 38.7% Black, 3.0% Hispanic, 0% Native American, 0.6% Asian
- Share of those killed with signs of a mental illness: 26.8% — 7th highest of 50 states
- Share of those killed who were unarmed: 11.9% — 15th lowest of 50 states
35. New Hampshire
- Documented police killings, Jan. 2020 – Oct. 2024: 1.4 per 100,000 people (20 total)
- Gender of those killed: 100% male, 0% female
- Race/ethnicity of those killed: 75.0% White, 0% Black, 0% Hispanic, 0% Native American, 0% Asian
- Share of those killed with signs of a mental illness: 20.0% — 23rd lowest of 50 states
- Share of those killed who were unarmed: 5.0% — 2nd lowest of 50 states
34. Wisconsin
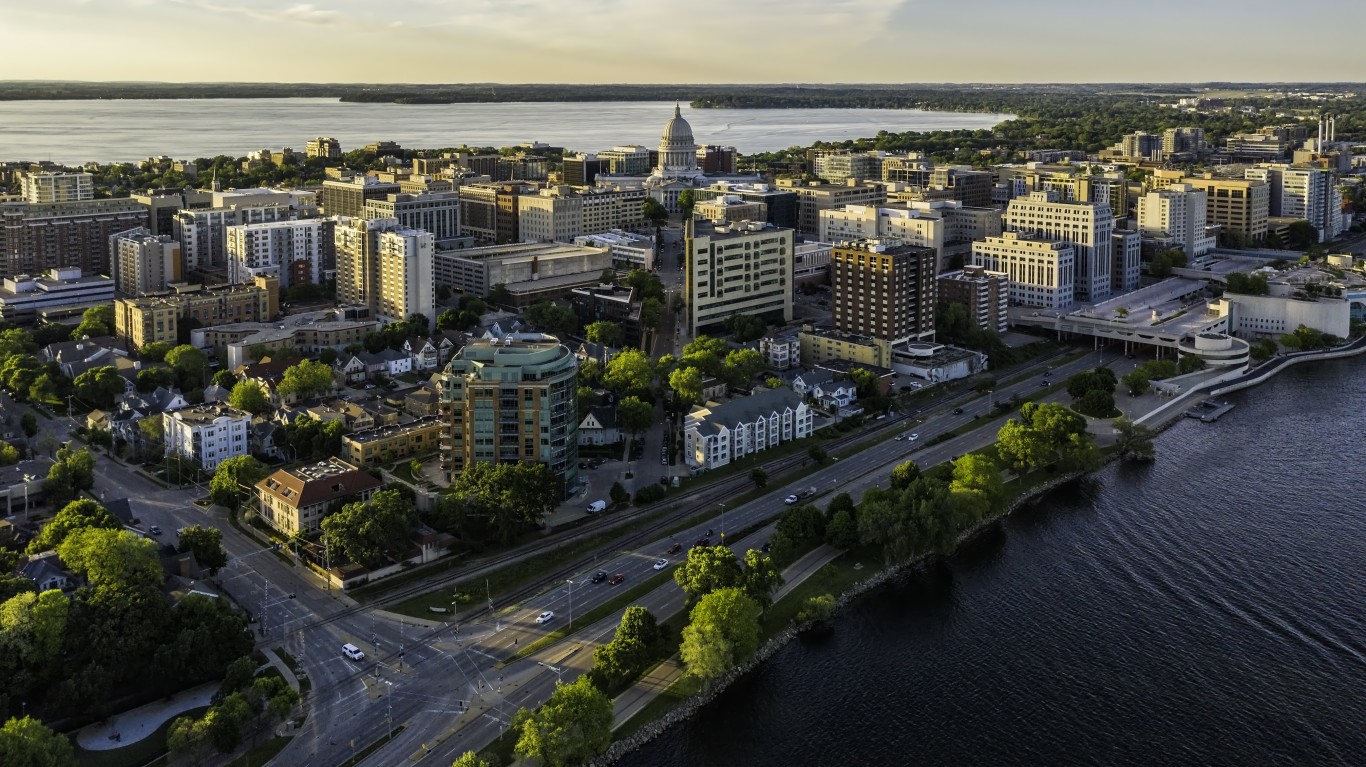
- Documented police killings, Jan. 2020 – Oct. 2024: 1.5 per 100,000 people (88 total)
- Gender of those killed: 95.5% male, 4.5% female
- Race/ethnicity of those killed: 59.1% White, 26.1% Black, 5.7% Hispanic, 1.1% Native American, 0% Asian
- Share of those killed with signs of a mental illness: 28.4% — 5th highest of 50 states
- Share of those killed who were unarmed: 17.0% — 21st highest of 50 states
33. Hawaii
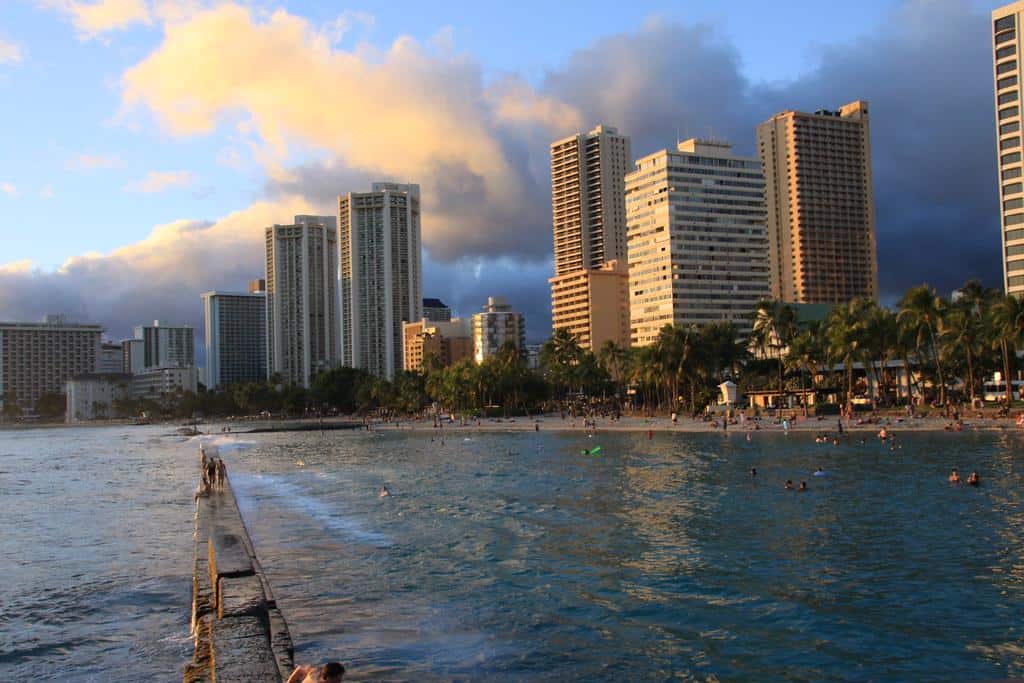
- Documented police killings, Jan. 2020 – Oct. 2024: 1.6 per 100,000 people (23 total)
- Gender of those killed: 100% male, 0% female
- Race/ethnicity of those killed: 17.4% White, 8.7% Black, 0% Hispanic, 0% Native American, 4.3% Asian
- Share of those killed with signs of a mental illness: 26.1% — 9th highest of 50 states
- Share of those killed who were unarmed: 34.8% — 4th highest of 50 states
32. Nebraska
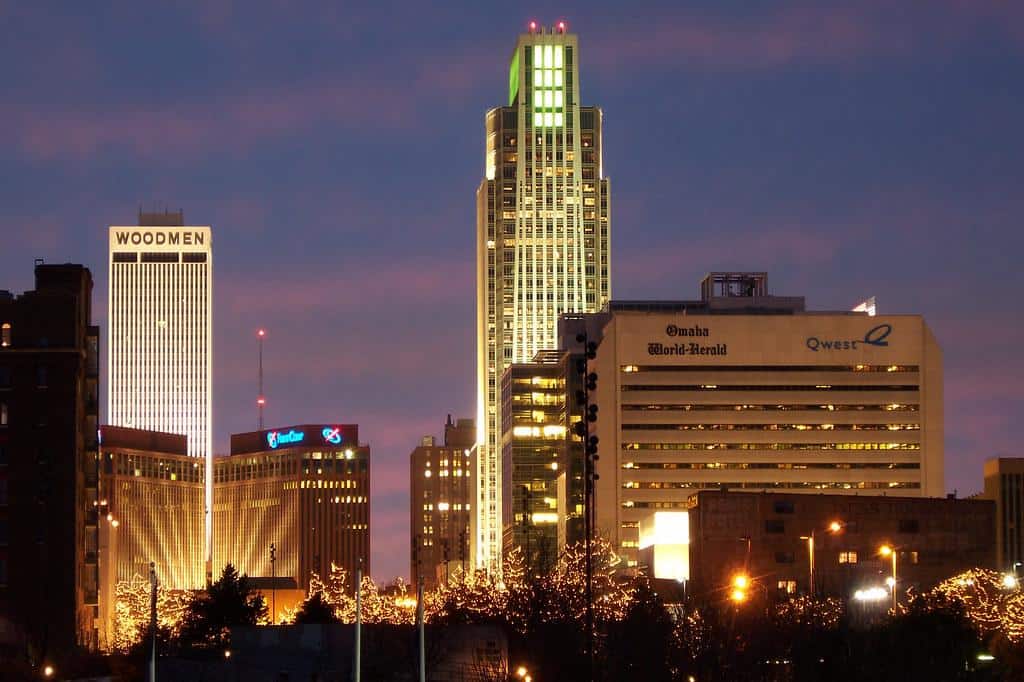
- Documented police killings, Jan. 2020 – Oct. 2024: 1.6 per 100,000 people (32 total)
- Gender of those killed: 93.8% male, 6.3% female
- Race/ethnicity of those killed: 56.3% White, 12.5% Black, 25.0% Hispanic, 0% Native American, 3.1% Asian
- Share of those killed with signs of a mental illness: 37.5% — the highest of 50 states
- Share of those killed who were unarmed: 12.5% — 18th lowest of 50 states
31. Florida
- Documented police killings, Jan. 2020 – Oct. 2024: 1.8 per 100,000 people (403 total)
- Gender of those killed: 92.1% male, 7.4% female
- Race/ethnicity of those killed: 38.5% White, 28.8% Black, 14.9% Hispanic, 0.2% Native American, 0.5% Asian
- Share of those killed with signs of a mental illness: 22.3% — 20th highest of 50 states
- Share of those killed who were unarmed: 16.1% — 24th highest of 50 states
30. North Carolina

- Documented police killings, Jan. 2020 – Oct. 2024: 1.8 per 100,000 people (196 total)
- Gender of those killed: 92.9% male, 7.1% female
- Race/ethnicity of those killed: 52.0% White, 33.2% Black, 6.1% Hispanic, 0% Native American, 0.5% Asian
- Share of those killed with signs of a mental illness: 20.9% — 24th highest of 50 states
- Share of those killed who were unarmed: 20.4% — 10th highest of 50 states
29. South Dakota
- Documented police killings, Jan. 2020 – Oct. 2024: 1.8 per 100,000 people (17 total)
- Gender of those killed: 100% male, 0% female
- Race/ethnicity of those killed: 52.9% White, 0% Black, 0% Hispanic, 29.4% Native American, 0% Asian
- Share of those killed with signs of a mental illness: 17.6% — 19th lowest of 50 states
- Share of those killed who were unarmed: 11.8% — 13th lowest of 50 states
28. California
- Documented police killings, Jan. 2020 – Oct. 2024: 1.9 per 100,000 people (728 total)
- Gender of those killed: 94.8% male, 5.1% female
- Race/ethnicity of those killed: 23.5% White, 13.0% Black, 43.4% Hispanic, 0.7% Native American, 3.0% Asian
- Share of those killed with signs of a mental illness: 17.2% — 16th lowest of 50 states
- Share of those killed who were unarmed: 19.9% — 13th highest of 50 states
27. Washington
- Documented police killings, Jan. 2020 – Oct. 2024: 1.9 per 100,000 people (147 total)
- Gender of those killed: 93.9% male, 6.1% female
- Race/ethnicity of those killed: 46.9% White, 12.2% Black, 12.2% Hispanic, 1.4% Native American, 2.7% Asian
- Share of those killed with signs of a mental illness: 21.1% — 23rd highest of 50 states
- Share of those killed who were unarmed: 12.2% — 16th lowest of 50 states
26. Indiana
- Documented police killings, Jan. 2020 – Oct. 2024: 1.9 per 100,000 people (132 total)
- Gender of those killed: 93.9% male, 6.1% female
- Race/ethnicity of those killed: 50.8% White, 35.6% Black, 4.5% Hispanic, 0% Native American, 0.8% Asian
- Share of those killed with signs of a mental illness: 27.3% — 6th highest of 50 states
- Share of those killed who were unarmed: 13.6% — 21st lowest of 50 states
25. South Carolina

- Documented police killings, Jan. 2020 – Oct. 2024: 2.0 per 100,000 people (105 total)
- Gender of those killed: 88.6% male, 11.4% female
- Race/ethnicity of those killed: 49.5% White, 39.0% Black, 1.9% Hispanic, 0% Native American, 1.0% Asian
- Share of those killed with signs of a mental illness: 13.3% — 7th lowest of 50 states
- Share of those killed who were unarmed: 21.0% — 8th highest of 50 states
24. Texas
- Documented police killings, Jan. 2020 – Oct. 2024: 2.0 per 100,000 people (622 total)
- Gender of those killed: 94.1% male, 5.8% female
- Race/ethnicity of those killed: 27.8% White, 22.7% Black, 36.3% Hispanic, 0% Native American, 1.4% Asian
- Share of those killed with signs of a mental illness: 19.1% — 22nd lowest of 50 states
- Share of those killed who were unarmed: 15.1% — 24th lowest of 50 states
23. Kansas
- Documented police killings, Jan. 2020 – Oct. 2024: 2.0 per 100,000 people (60 total)
- Gender of those killed: 90.0% male, 10.0% female
- Race/ethnicity of those killed: 65.0% White, 13.3% Black, 11.7% Hispanic, 0% Native American, 0% Asian
- Share of those killed with signs of a mental illness: 18.3% — 20th lowest of 50 states
- Share of those killed who were unarmed: 16.7% — 23rd highest of 50 states
22. North Dakota
- Documented police killings, Jan. 2020 – Oct. 2024: 2.0 per 100,000 people (16 total)
- Gender of those killed: 100% male, 0% female
- Race/ethnicity of those killed: 50.0% White, 0% Black, 6.3% Hispanic, 25.0% Native American, 0% Asian
- Share of those killed with signs of a mental illness: 12.5% — 5th lowest of 50 states
- Share of those killed who were unarmed: 12.5% — 19th lowest of 50 states
21. Kentucky
- Documented police killings, Jan. 2020 – Oct. 2024: 2.1 per 100,000 people (97 total)
- Gender of those killed: 94.8% male, 4.1% female
- Race/ethnicity of those killed: 61.9% White, 13.4% Black, 3.1% Hispanic, 0% Native American, 1.0% Asian
- Share of those killed with signs of a mental illness: 13.4% — 8th lowest of 50 states
- Share of those killed who were unarmed: 9.3% — 8th lowest of 50 states
20. Oregon

- Documented police killings, Jan. 2020 – Oct. 2024: 2.1 per 100,000 people (91 total)
- Gender of those killed: 97.8% male, 2.2% female
- Race/ethnicity of those killed: 64.8% White, 6.6% Black, 11.0% Hispanic, 1.1% Native American, 1.1% Asian
- Share of those killed with signs of a mental illness: 23.1% — 18th highest of 50 states
- Share of those killed who were unarmed: 11.0% — 10th lowest of 50 states
19. Maine
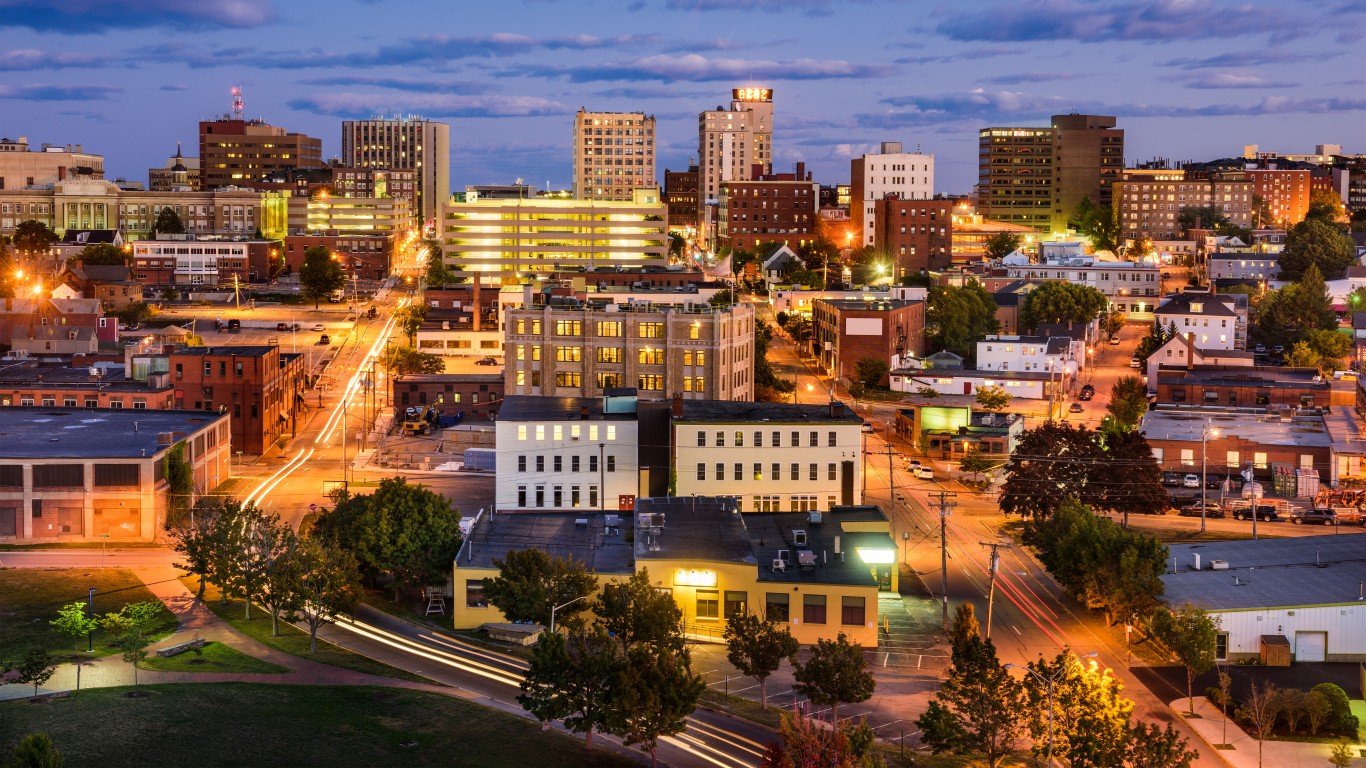
- Documented police killings, Jan. 2020 – Oct. 2024: 2.4 per 100,000 people (33 total)
- Gender of those killed: 97.0% male, 3.0% female
- Race/ethnicity of those killed: 78.8% White, 6.1% Black, 0% Hispanic, 3.0% Native American, 0% Asian
- Share of those killed with signs of a mental illness: 36.4% — 3rd highest of 50 states
- Share of those killed who were unarmed: 9.1% — 6th lowest of 50 states
18. Utah
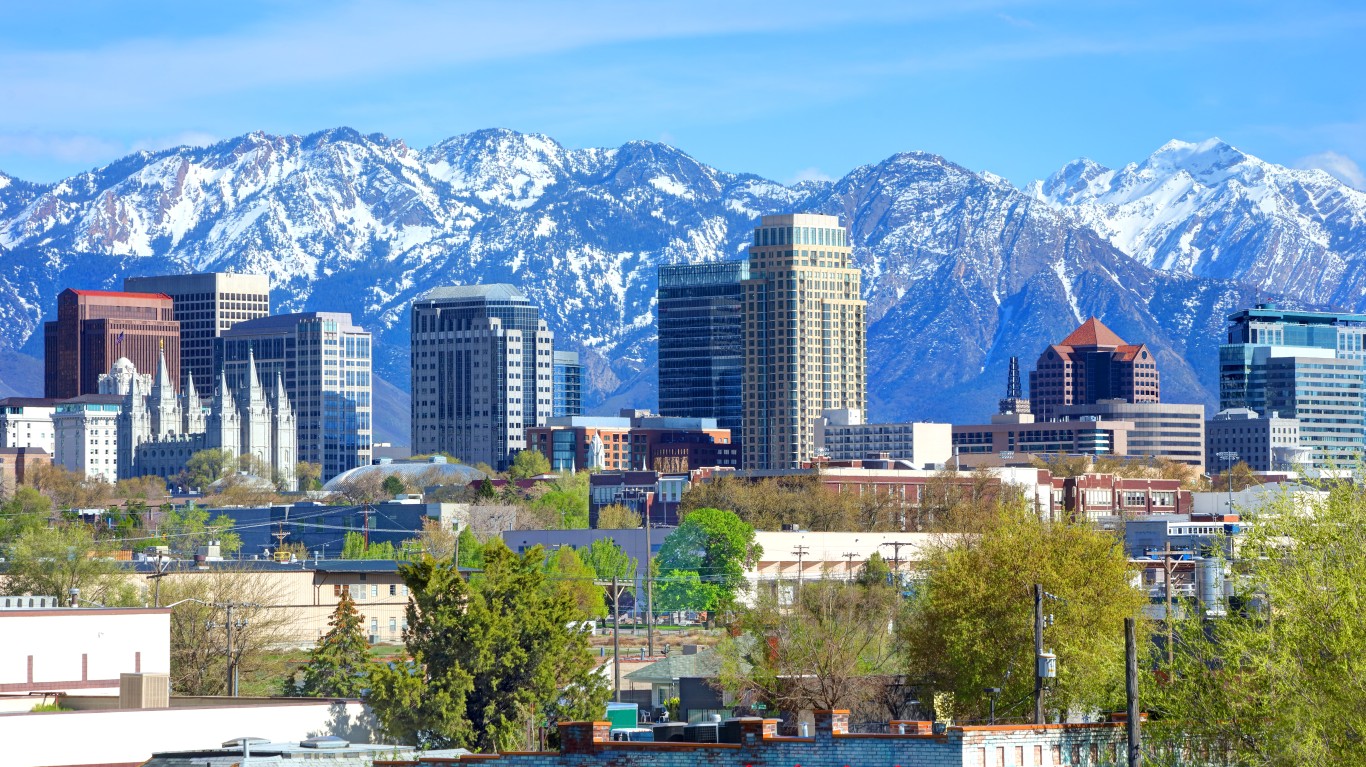
- Documented police killings, Jan. 2020 – Oct. 2024: 2.4 per 100,000 people (82 total)
- Gender of those killed: 97.6% male, 2.4% female
- Race/ethnicity of those killed: 63.4% White, 3.7% Black, 14.6% Hispanic, 1.2% Native American, 1.2% Asian
- Share of those killed with signs of a mental illness: 24.4% — 12th highest of 50 states
- Share of those killed who were unarmed: 11.0% — 9th lowest of 50 states
17. Alabama
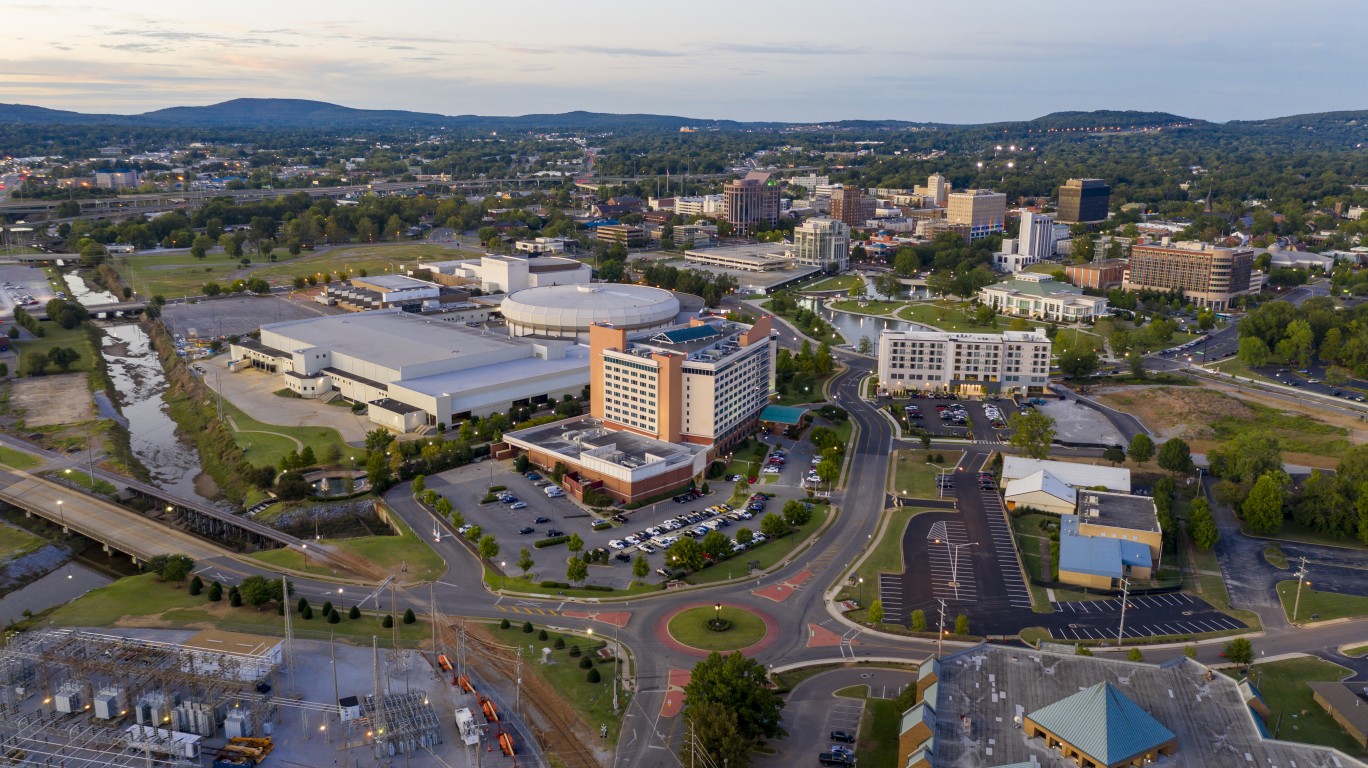
- Documented police killings, Jan. 2020 – Oct. 2024: 2.5 per 100,000 people (126 total)
- Gender of those killed: 92.9% male, 7.1% female
- Race/ethnicity of those killed: 56.3% White, 33.3% Black, 2.4% Hispanic, 0% Native American, 0% Asian
- Share of those killed with signs of a mental illness: 19.0% — 21st lowest of 50 states
- Share of those killed who were unarmed: 18.3% — 15th highest of 50 states
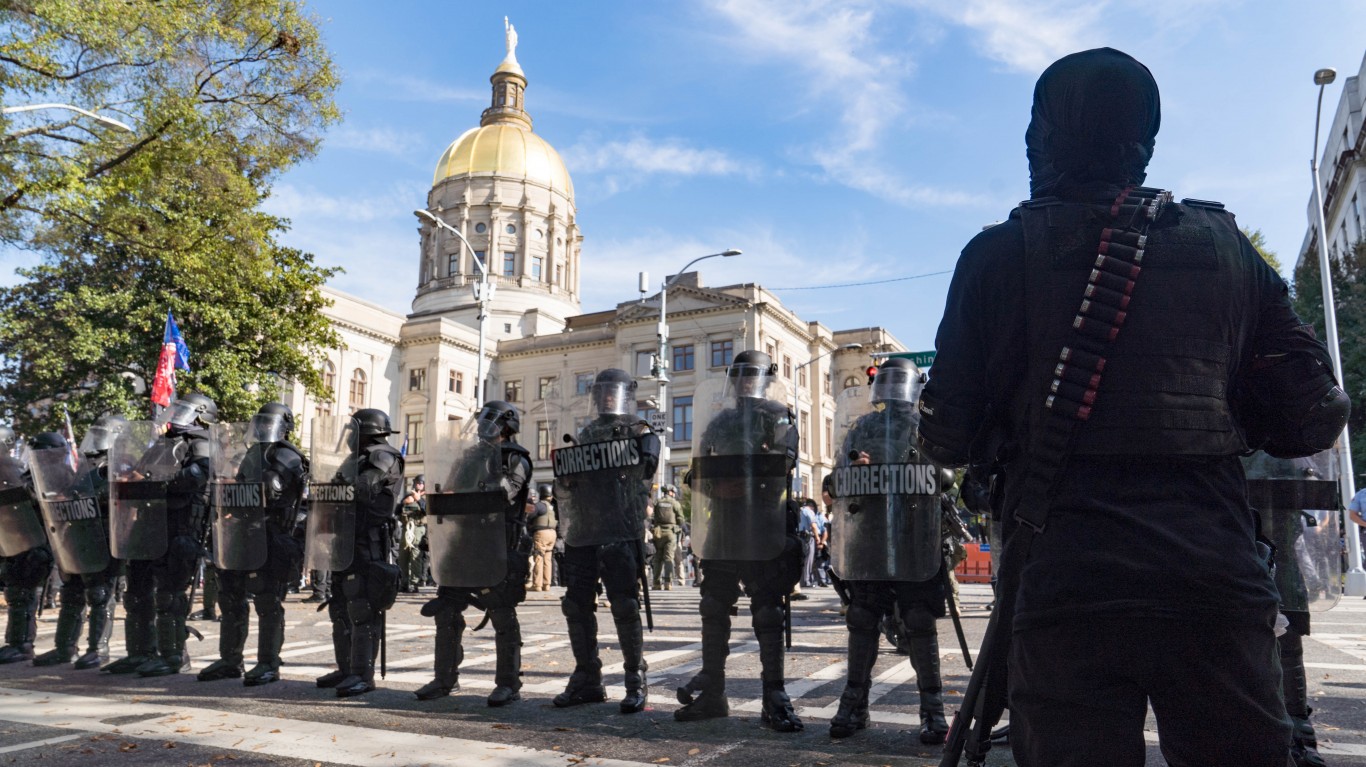
16. Georgia
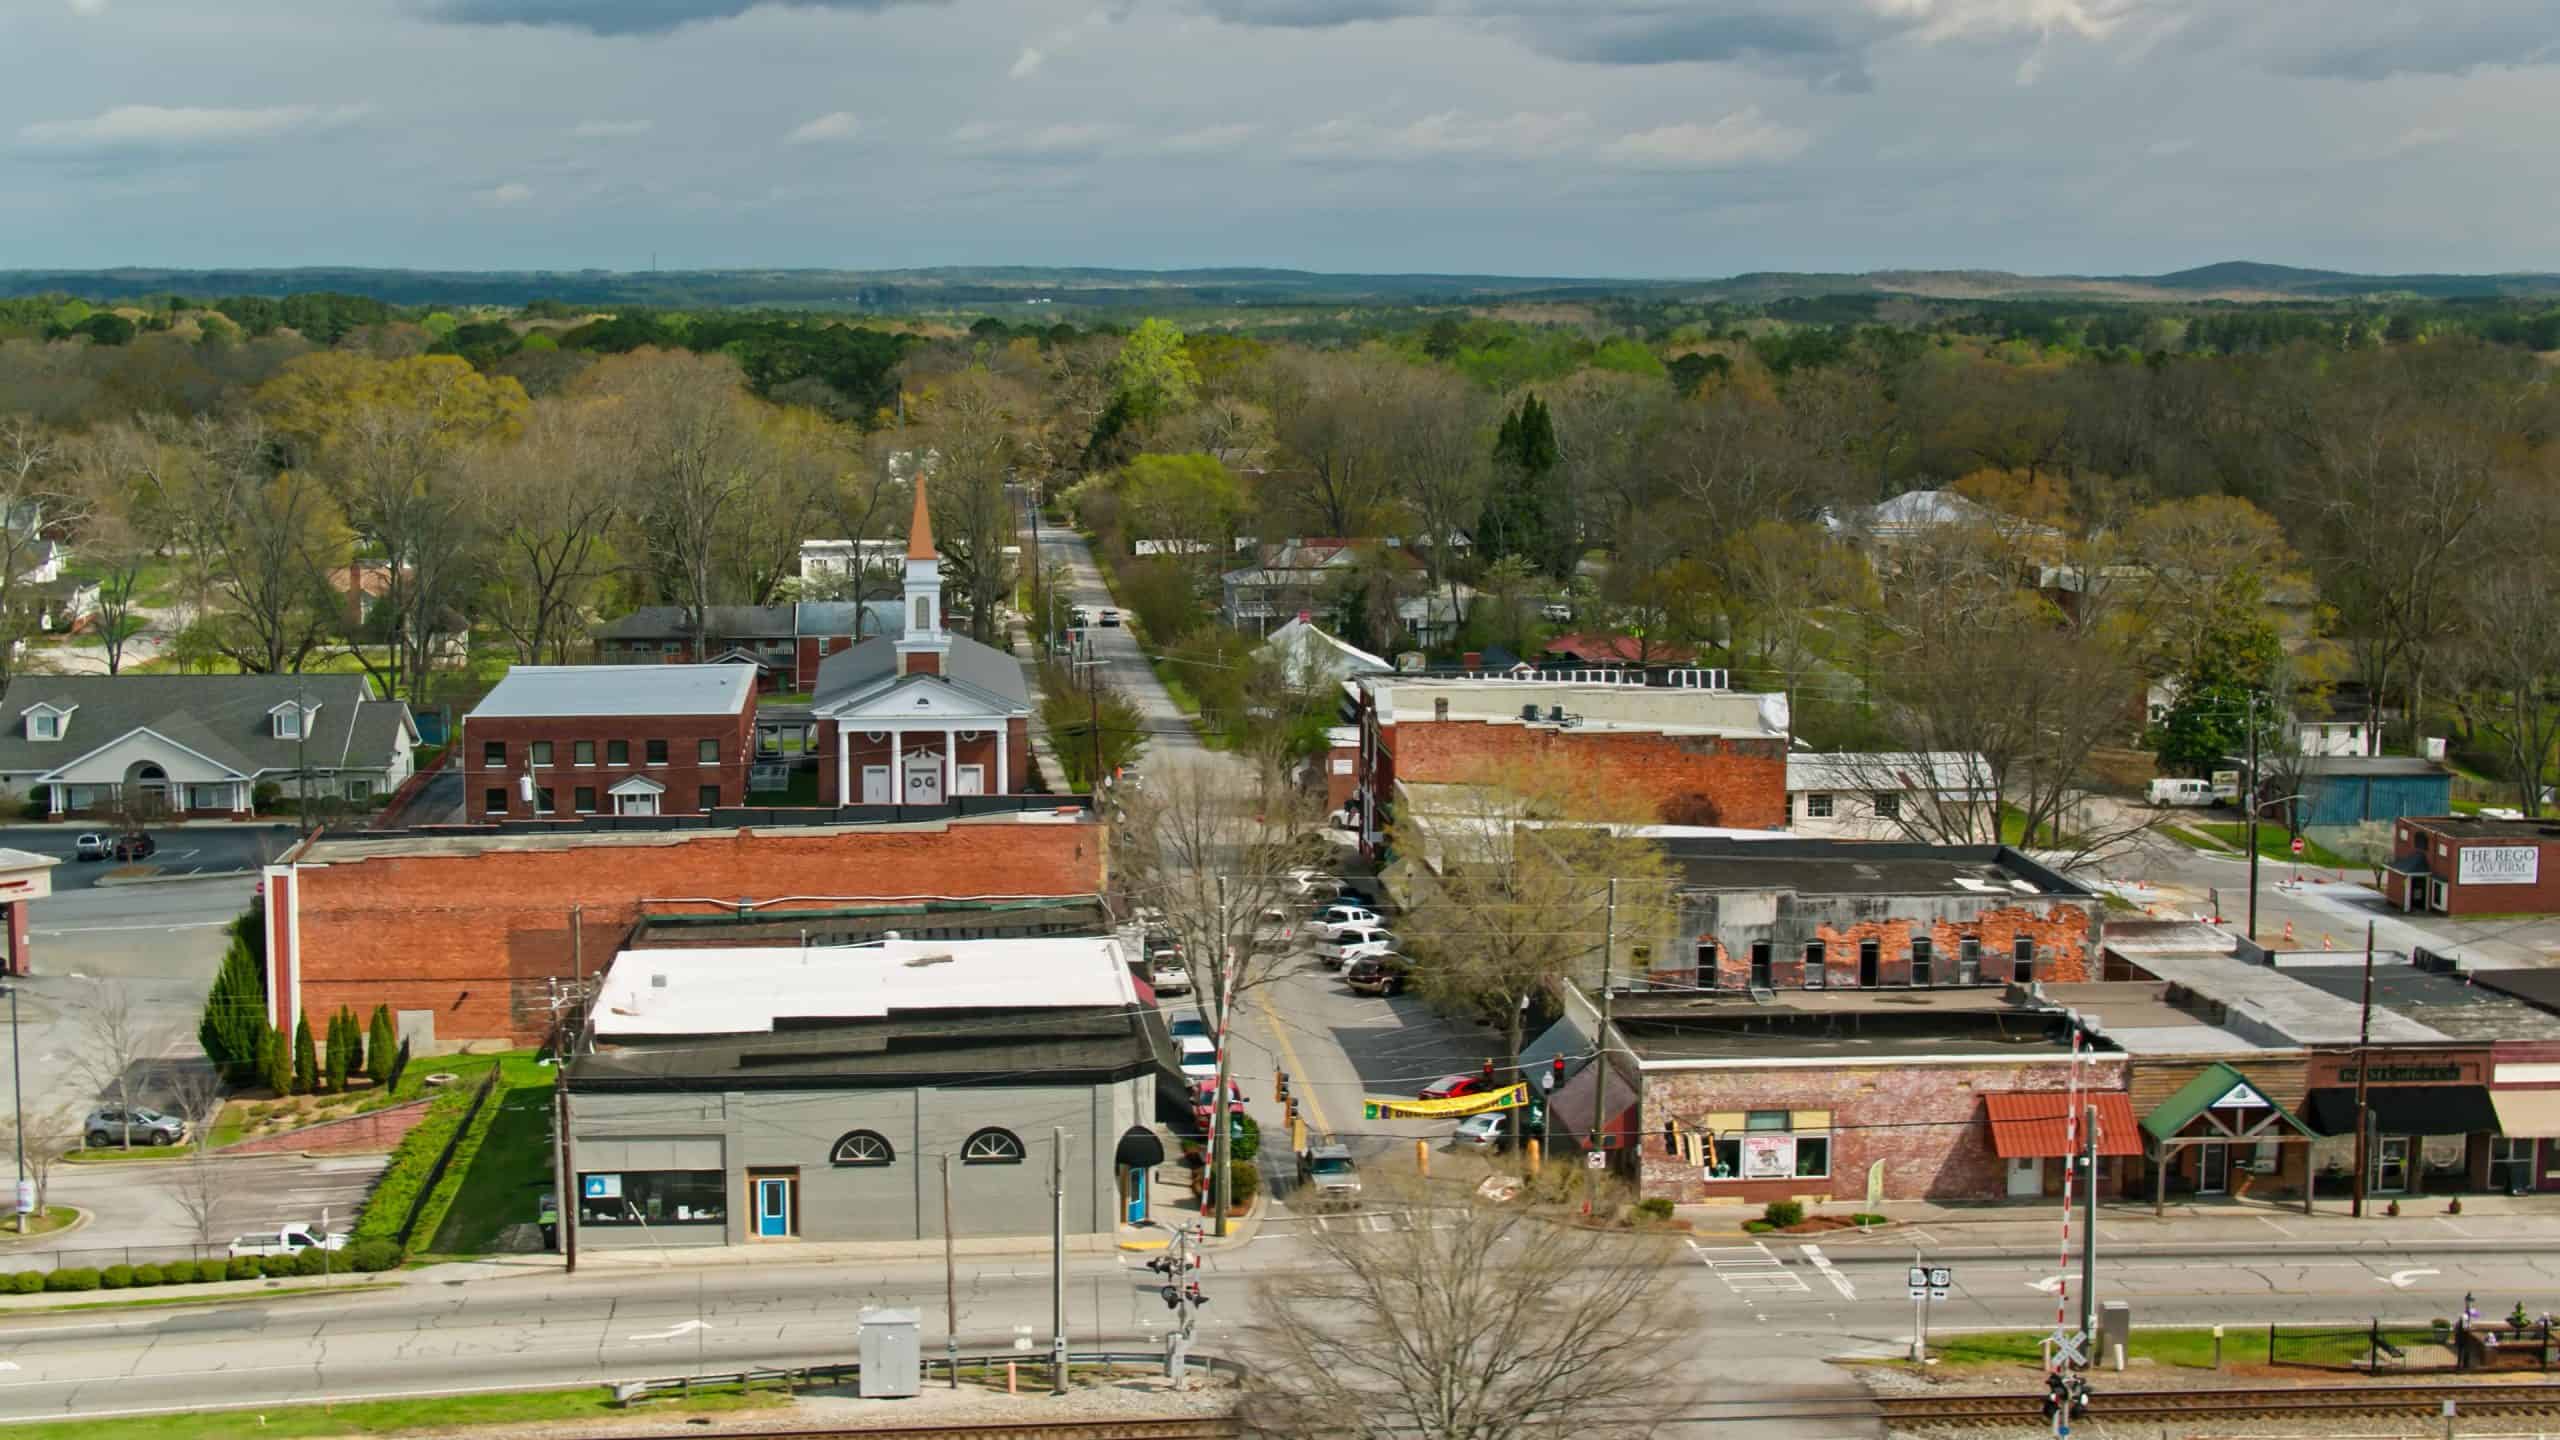
- Documented police killings, Jan. 2020 – Oct. 2024: 2.5 per 100,000 people (273 total)
- Gender of those killed: 94.5% male, 5.1% female
- Race/ethnicity of those killed: 30.8% White, 48.7% Black, 7.0% Hispanic, 0% Native American, 1.1% Asian
- Share of those killed with signs of a mental illness: 11.7% — 4th lowest of 50 states
- Share of those killed who were unarmed: 18.7% — 14th highest of 50 states
15. Louisiana
- Documented police killings, Jan. 2020 – Oct. 2024: 2.5 per 100,000 people (115 total)
- Gender of those killed: 95.7% male, 4.3% female
- Race/ethnicity of those killed: 31.3% White, 44.3% Black, 9.6% Hispanic, 0% Native American, 0.9% Asian
- Share of those killed with signs of a mental illness: 17.4% — 18th lowest of 50 states
- Share of those killed who were unarmed: 21.7% — 7th highest of 50 states
14. Tennessee
- Documented police killings, Jan. 2020 – Oct. 2024: 2.5 per 100,000 people (180 total)
- Gender of those killed: 90.6% male, 8.9% female
- Race/ethnicity of those killed: 48.9% White, 31.7% Black, 5.0% Hispanic, 0% Native American, 0% Asian
- Share of those killed with signs of a mental illness: 17.2% — 17th lowest of 50 states
- Share of those killed who were unarmed: 17.8% — 19th highest of 50 states
13. Missouri
- Documented police killings, Jan. 2020 – Oct. 2024: 2.5 per 100,000 people (157 total)
- Gender of those killed: 94.3% male, 5.7% female
- Race/ethnicity of those killed: 52.2% White, 26.1% Black, 3.2% Hispanic, 0% Native American, 0.6% Asian
- Share of those killed with signs of a mental illness: 14.0% — 10th lowest of 50 states
- Share of those killed who were unarmed: 8.9% — 5th lowest of 50 states
12. Arkansas

- Documented police killings, Jan. 2020 – Oct. 2024: 2.7 per 100,000 people (84 total)
- Gender of those killed: 95.2% male, 3.6% female
- Race/ethnicity of those killed: 61.9% White, 22.6% Black, 2.4% Hispanic, 0% Native American, 1.2% Asian
- Share of those killed with signs of a mental illness: 13.1% — 6th lowest of 50 states
- Share of those killed who were unarmed: 20.2% — 11th highest of 50 states
11. Idaho
- Documented police killings, Jan. 2020 – Oct. 2024: 2.8 per 100,000 people (55 total)
- Gender of those killed: 92.7% male, 7.3% female
- Race/ethnicity of those killed: 58.2% White, 0% Black, 12.7% Hispanic, 5.5% Native American, 0% Asian
- Share of those killed with signs of a mental illness: 14.5% — 12th lowest of 50 states
- Share of those killed who were unarmed: 9.1% — 7th lowest of 50 states
10. West Virginia

- Documented police killings, Jan. 2020 – Oct. 2024: 2.8 per 100,000 people (50 total)
- Gender of those killed: 92.0% male, 2.0% female
- Race/ethnicity of those killed: 68.0% White, 4.0% Black, 0% Hispanic, 0% Native American, 4.0% Asian
- Share of those killed with signs of a mental illness: 8.0% — the lowest of 50 states
- Share of those killed who were unarmed: 18.0% — 18th highest of 50 states
9. Nevada
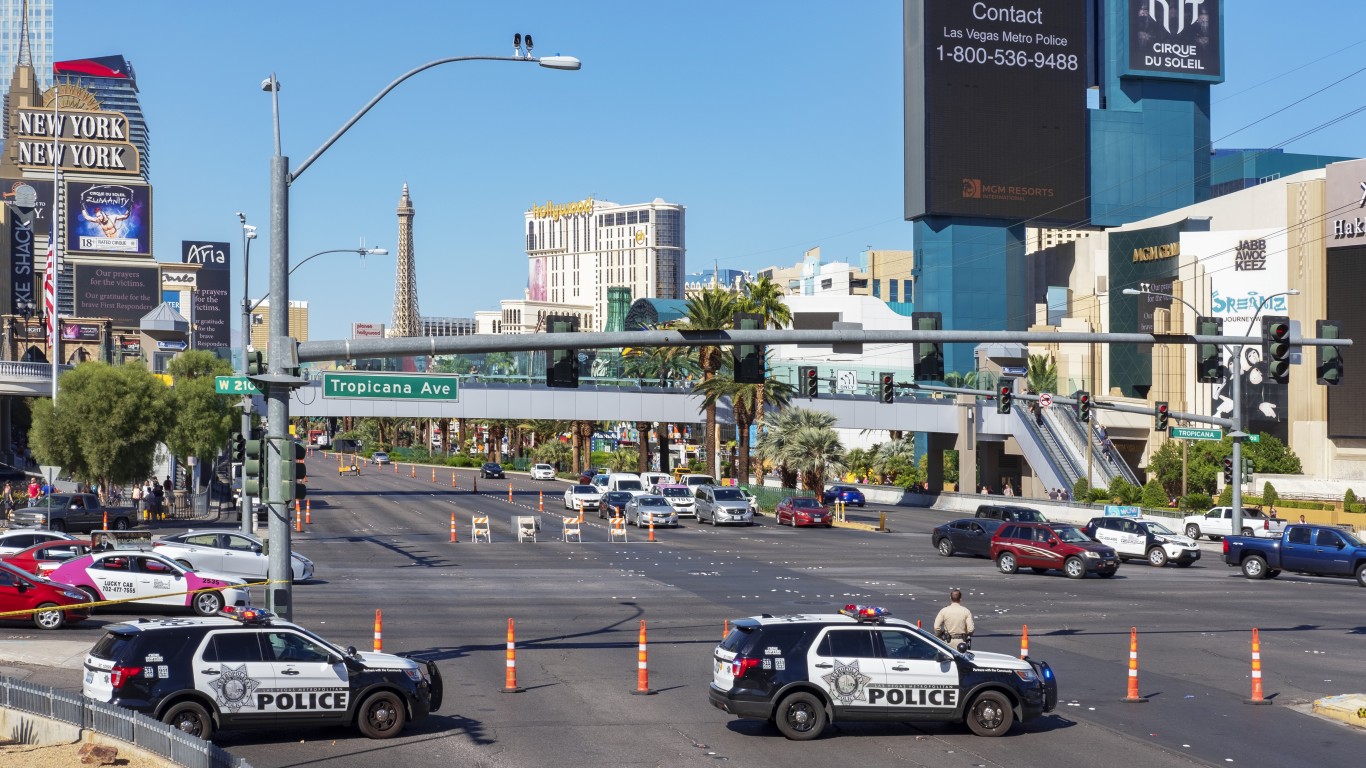
- Documented police killings, Jan. 2020 – Oct. 2024: 3.0 per 100,000 people (95 total)
- Gender of those killed: 96.8% male, 3.2% female
- Race/ethnicity of those killed: 48.4% White, 16.8% Black, 23.2% Hispanic, 1.1% Native American, 0% Asian
- Share of those killed with signs of a mental illness: 23.2% — 16th highest of 50 states
- Share of those killed who were unarmed: 8.4% — 4th lowest of 50 states
8. Mississippi

- Documented police killings, Jan. 2020 – Oct. 2024: 3.0 per 100,000 people (89 total)
- Gender of those killed: 92.1% male, 6.7% female
- Race/ethnicity of those killed: 29.2% White, 43.8% Black, 1.1% Hispanic, 0% Native American, 0% Asian
- Share of those killed with signs of a mental illness: 10.1% — 2nd lowest of 50 states
- Share of those killed who were unarmed: 12.4% — 17th lowest of 50 states
7. Oklahoma
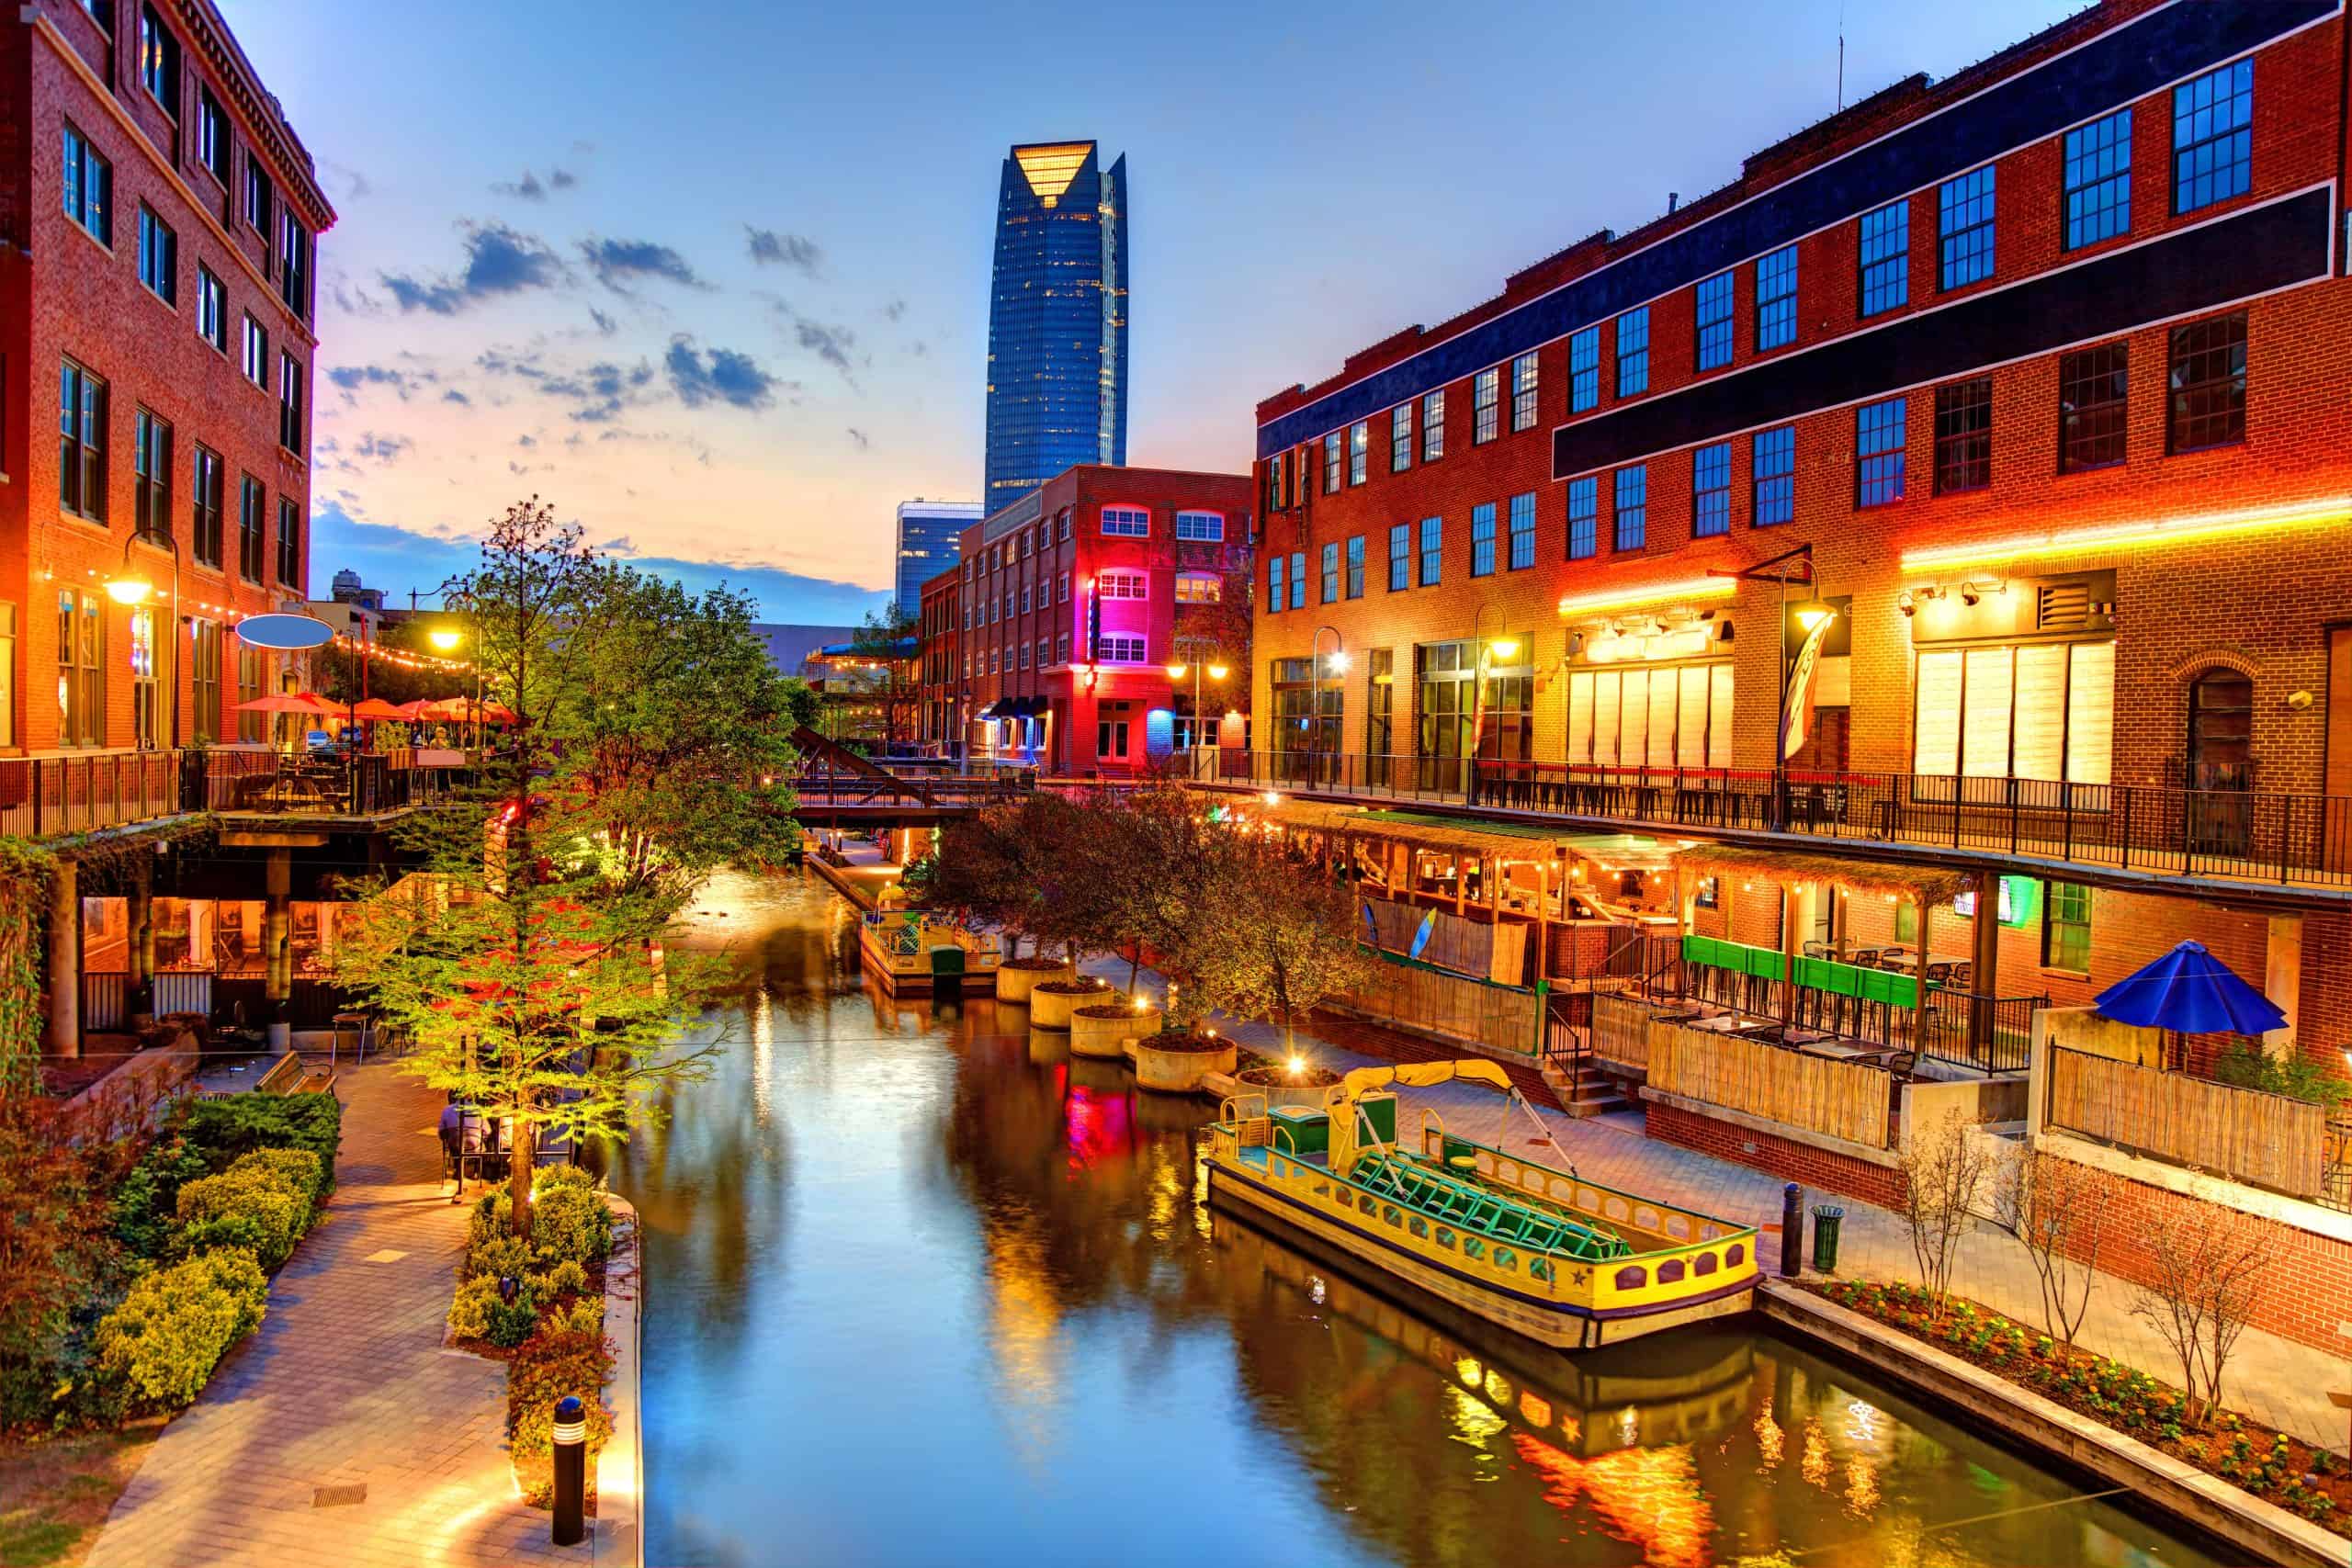
- Documented police killings, Jan. 2020 – Oct. 2024: 3.2 per 100,000 people (128 total)
- Gender of those killed: 91.4% male, 8.6% female
- Race/ethnicity of those killed: 49.2% White, 14.1% Black, 13.3% Hispanic, 9.4% Native American, 0% Asian
- Share of those killed with signs of a mental illness: 23.4% — 15th highest of 50 states
- Share of those killed who were unarmed: 15.6% — 25th highest of 50 states
6. Arizona
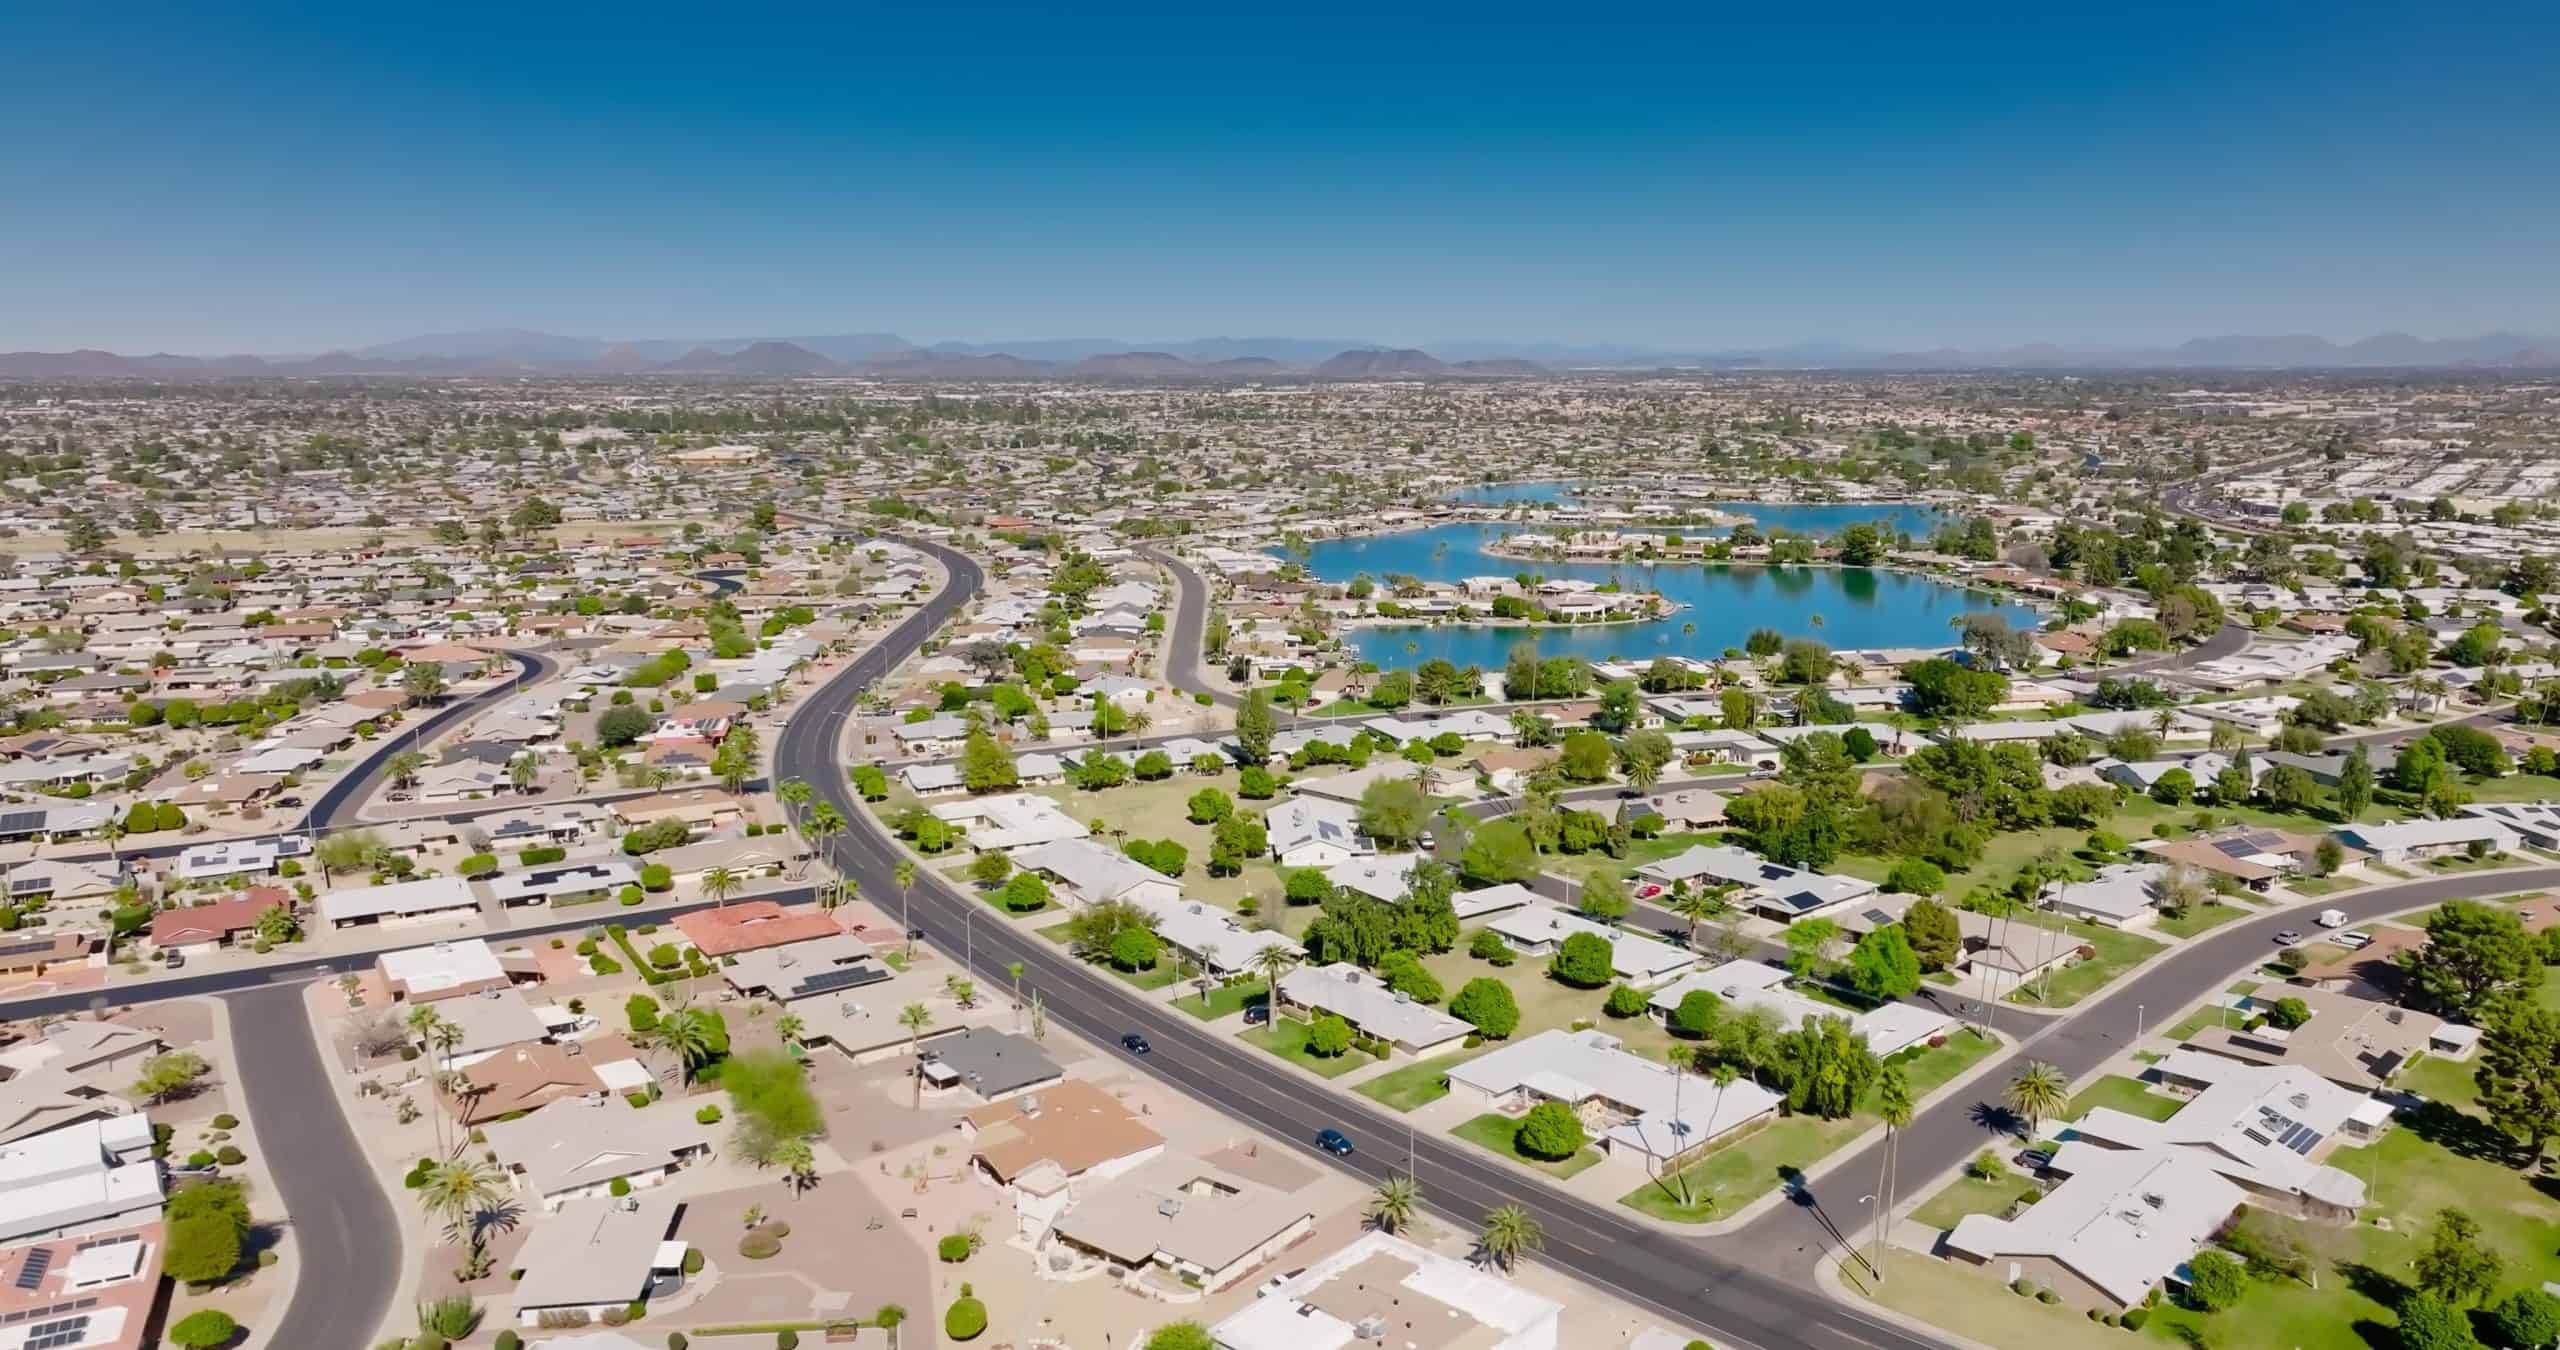
- Documented police killings, Jan. 2020 – Oct. 2024: 3.3 per 100,000 people (247 total)
- Gender of those killed: 94.3% male, 5.7% female
- Race/ethnicity of those killed: 31.6% White, 13.4% Black, 33.6% Hispanic, 4.9% Native American, 0% Asian
- Share of those killed with signs of a mental illness: 16.2% — 14th lowest of 50 states
- Share of those killed who were unarmed: 17.0% — 22nd highest of 50 states
5. Colorado
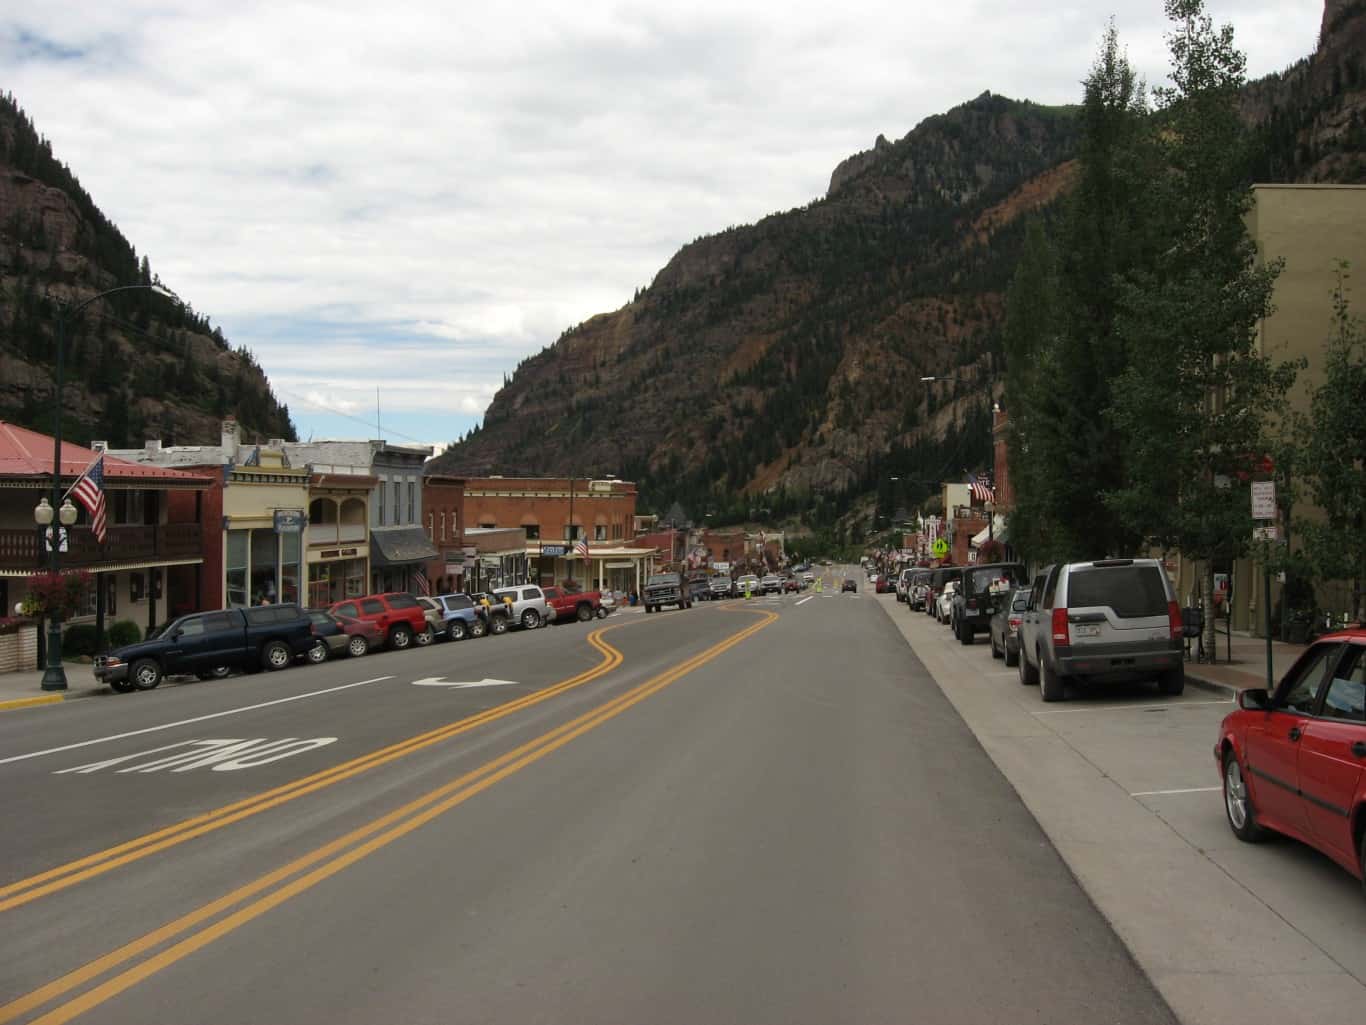
- Documented police killings, Jan. 2020 – Oct. 2024: 3.6 per 100,000 people (212 total)
- Gender of those killed: 94.3% male, 4.7% female
- Race/ethnicity of those killed: 48.1% White, 9.9% Black, 24.5% Hispanic, 1.4% Native American, 0% Asian
- Share of those killed with signs of a mental illness: 15.6% — 13th lowest of 50 states
- Share of those killed who were unarmed: 11.8% — 14th lowest of 50 states
4. Montana
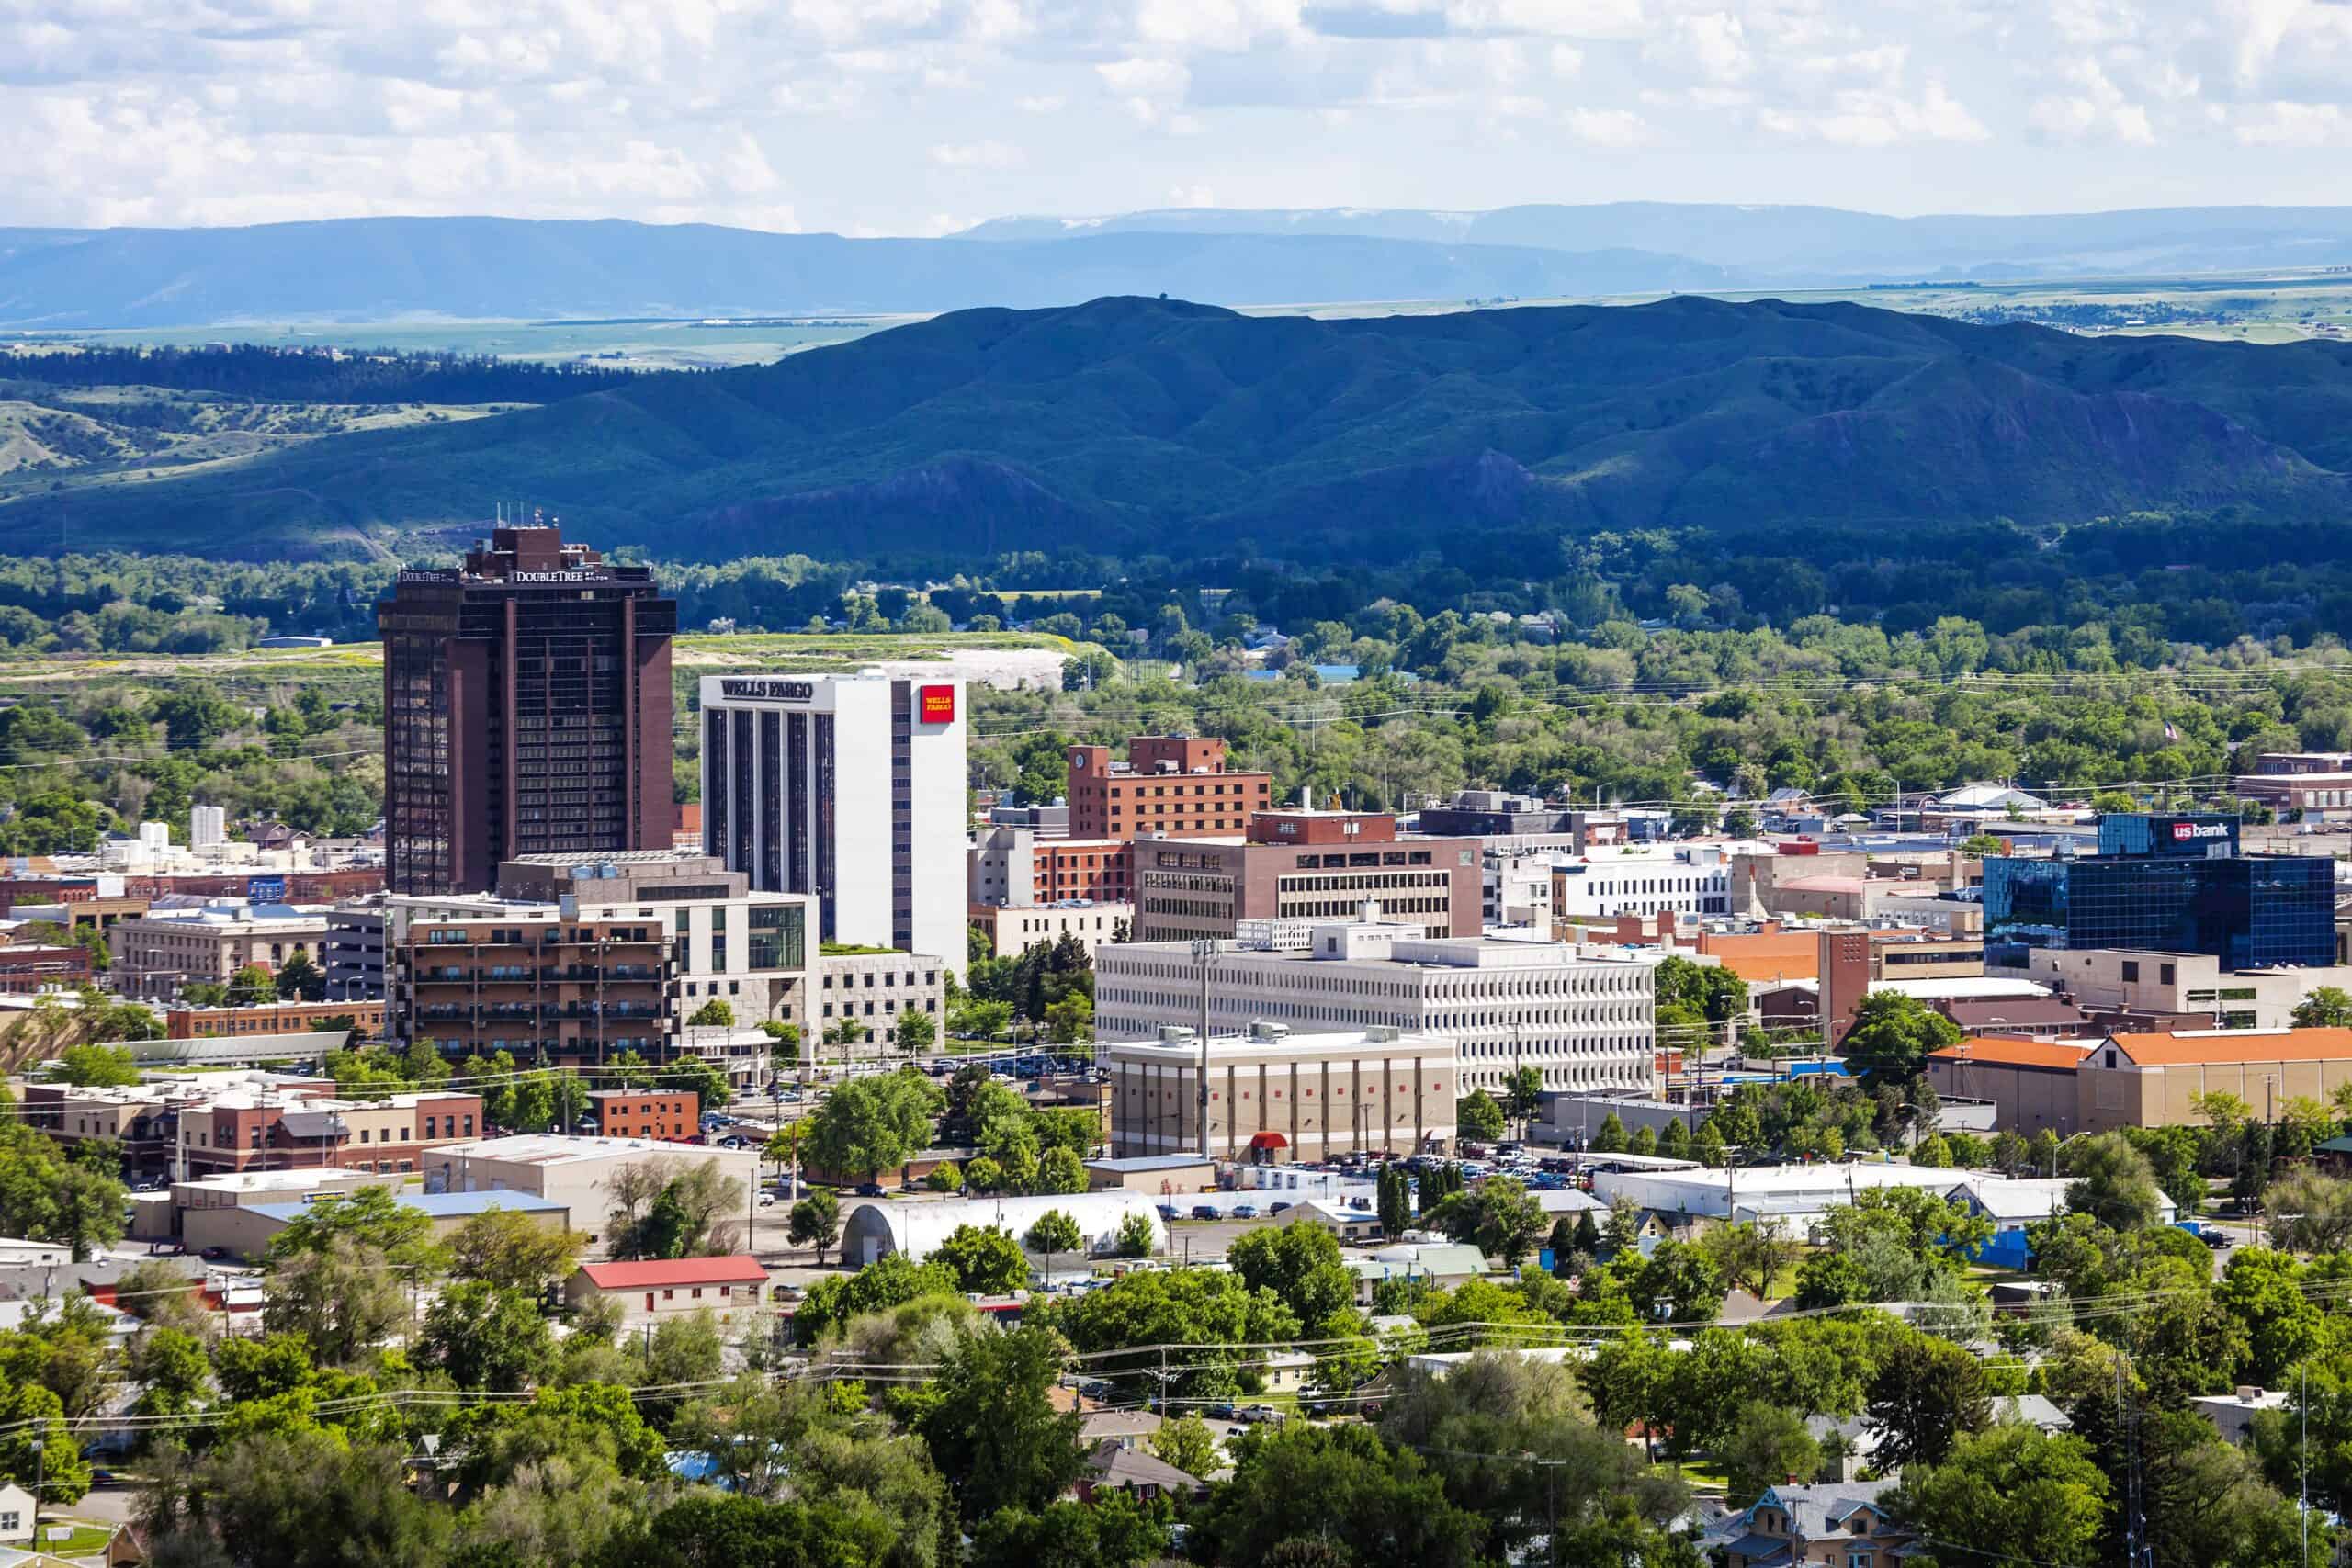
- Documented police killings, Jan. 2020 – Oct. 2024: 3.9 per 100,000 people (44 total)
- Gender of those killed: 95.5% male, 4.5% female
- Race/ethnicity of those killed: 61.4% White, 4.5% Black, 0% Hispanic, 13.6% Native American, 0% Asian
- Share of those killed with signs of a mental illness: 13.6% — 9th lowest of 50 states
- Share of those killed who were unarmed: 6.8% — 3rd lowest of 50 states
3. Wyoming
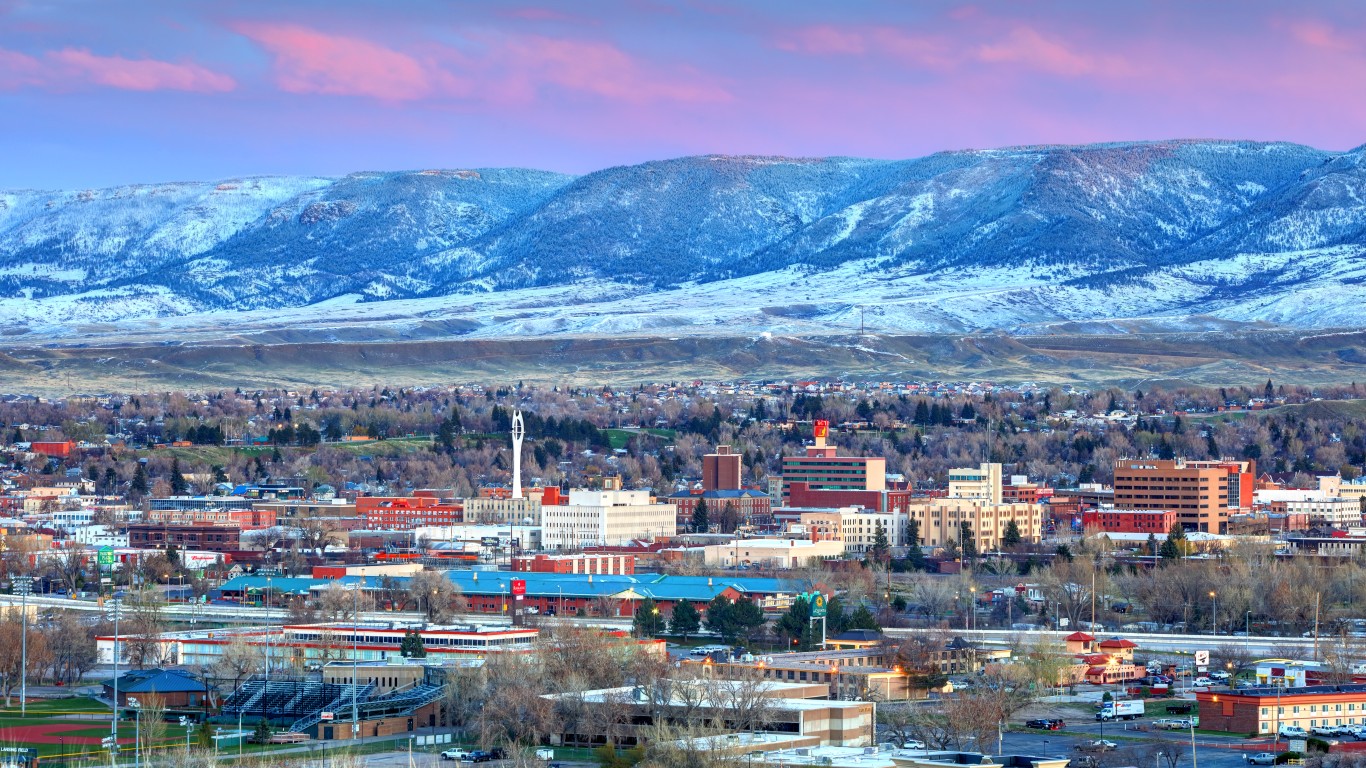
- Documented police killings, Jan. 2020 – Oct. 2024: 4.5 per 100,000 people (26 total)
- Gender of those killed: 100% male, 0% female
- Race/ethnicity of those killed: 65.4% White, 11.5% Black, 7.7% Hispanic, 3.8% Native American, 0% Asian
- Share of those killed with signs of a mental illness: 11.5% — 3rd lowest of 50 states
- Share of those killed who were unarmed: 3.8% — the lowest of 50 states
2. Alaska

- Documented police killings, Jan. 2020 – Oct. 2024: 4.8 per 100,000 people (35 total)
- Gender of those killed: 91.4% male, 8.6% female
- Race/ethnicity of those killed: 40.0% White, 5.7% Black, 0% Hispanic, 17.1% Native American, 0% Asian
- Share of those killed with signs of a mental illness: 17.1% — 15th lowest of 50 states
- Share of those killed who were unarmed: 11.4% — 12th lowest of 50 states
1. New Mexico
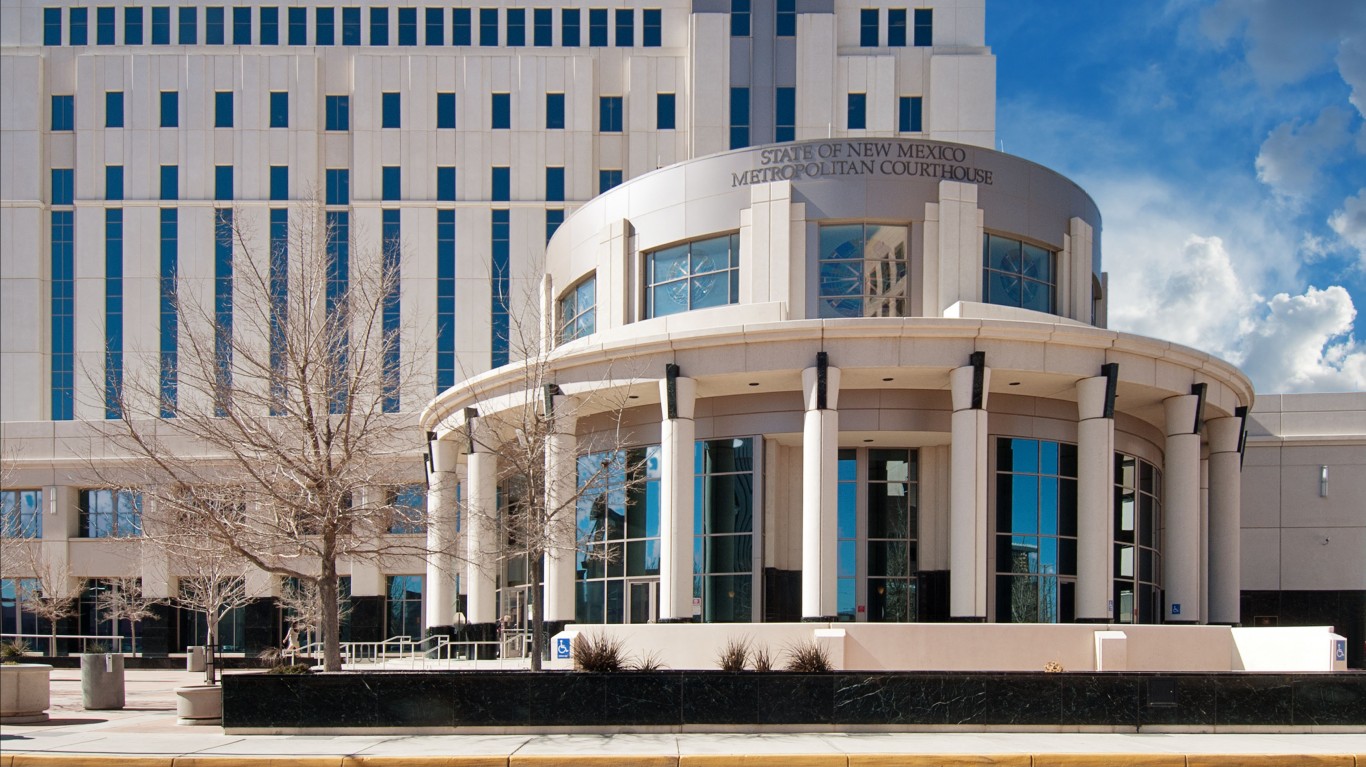
- Documented police killings, Jan. 2020 – Oct. 2024: 6.3 per 100,000 people (133 total)
- Gender of those killed: 93.2% male, 5.3% female
- Race/ethnicity of those killed: 23.3% White, 6.0% Black, 50.4% Hispanic, 7.5% Native American, 0% Asian
- Share of those killed with signs of a mental illness: 24.1% — 13th highest of 50 states
- Share of those killed who were unarmed: 18.0% — 17th highest of 50 states
Contact [email protected] for any questions or corrections.