
The CDC’s National Center for Health Statistics reported an estimated 100,306 drug overdose deaths in the country during 12-month period ending in April 2021 – an increase of 28.5% from the 78,056 deaths during the same period the prior year. At the same time, opioid-related fatalities specifically rose to 75,673 from 56,064.
Overdose deaths from not only synthetic opioids (mostly fentanyl) but also psychostimulants like methamphetamines and cocaine, as well as natural and semi-synthetic opioids such as prescription pain medications all increased, too, the CDC noted. (These are the states with the most fentanyl deaths.)
To determine the cities or metropolitan areas with the most drug overdoses, 24/7 Tempo reviewed mortality data from the CDC’s WONDER database, a system for disseminating public health information and data. Metropolitan statistical areas were ranked based on annual drug overdose deaths per capita over the period 2019 to 2021. County-level data was aggregated to the metropolitan statistical area level using March 2020 boundary definitions from the U.S. Census Bureau. Data on poverty rate and population are from the Census Bureau’s 2021 American Community Survey and are one-year estimates.
Of the 40 major metro hubs highlighted here, eight are in West Virginia in whole or in part. Although all have populations under 400,000 (and two are less than 100,000), the areas ranked high because of the high number of drug fatalities per capita.
The Huntington-Ashland region spanning West Virginia, Kentucky, and Ohio, recorded 90.3 annual drug deaths per 100,000 residents, ranking it No. 3 on the list. No. 2 is Charleston, West Virginia, at 92.5 drug deaths per year for every 100,000 residents. The top metro area in the U.S. for drug overdoses is Beckley, West Virginia, with a shocking 114.1 drug overdose deaths per 100,000 residents. (See the county with the worst drug problem in every state.)
Click here to see the cities with the most drug overdoses
All three areas have something else in common: poverty rates above 17%. This is significant because a 2020 study published by the National Library of Medicine suggests that households living below the poverty line have a higher incidence of opioid mortality than more affluent households.
West Virginia has taken action in face of its opioid crisis. The state recently settled a lawsuit with Walgreens for $83 million, contending that the pharmacy chain had failed to stop an oversupply of opioids in the state that contributed to the deaths. So far, the state has reached agreements from opioid litigation totalling more than $950 million. One remaining case against Kroger is set for trial in June.

40. Pittsburgh, PA
> Annual drug deaths, 2019-2021: 47.4 per 100,000 residents
> Total drug deaths, 2019-2021: 3,307
> Poverty rate: 11.2%
> Population: 2,353,538
[in-text-ad]
39. Kokomo, IN
> Annual drug deaths, 2019-2021: 47.4 per 100,000 residents
> Total drug deaths, 2019-2021: 118
> Poverty rate: 10.6%
> Population: 83,687
[recirclink id=1047417]

38. Philadelphia-Camden-Wilmington, PA-NJ-DE-MD
> Annual drug deaths, 2019-2021: 47.4 per 100,000 residents
> Total drug deaths, 2019-2021: 8,742
> Poverty rate: 12.3%
> Population: 6,228,601

37. Columbus, OH
> Annual drug deaths, 2019-2021: 47.5 per 100,000 residents
> Total drug deaths, 2019-2021: 3,047
> Poverty rate: 12.2%
> Population: 2,151,017
[in-text-ad-2]

36. Homosassa Springs, FL
> Annual drug deaths, 2019-2021: 47.5 per 100,000 residents
> Total drug deaths, 2019-2021: 219
> Poverty rate: 16.1%
> Population: 158,083
35. Toledo, OH
> Annual drug deaths, 2019-2021: 47.6 per 100,000 residents
> Total drug deaths, 2019-2021: 917
> Poverty rate: 15.0%
> Population: 644,217
[in-text-ad]
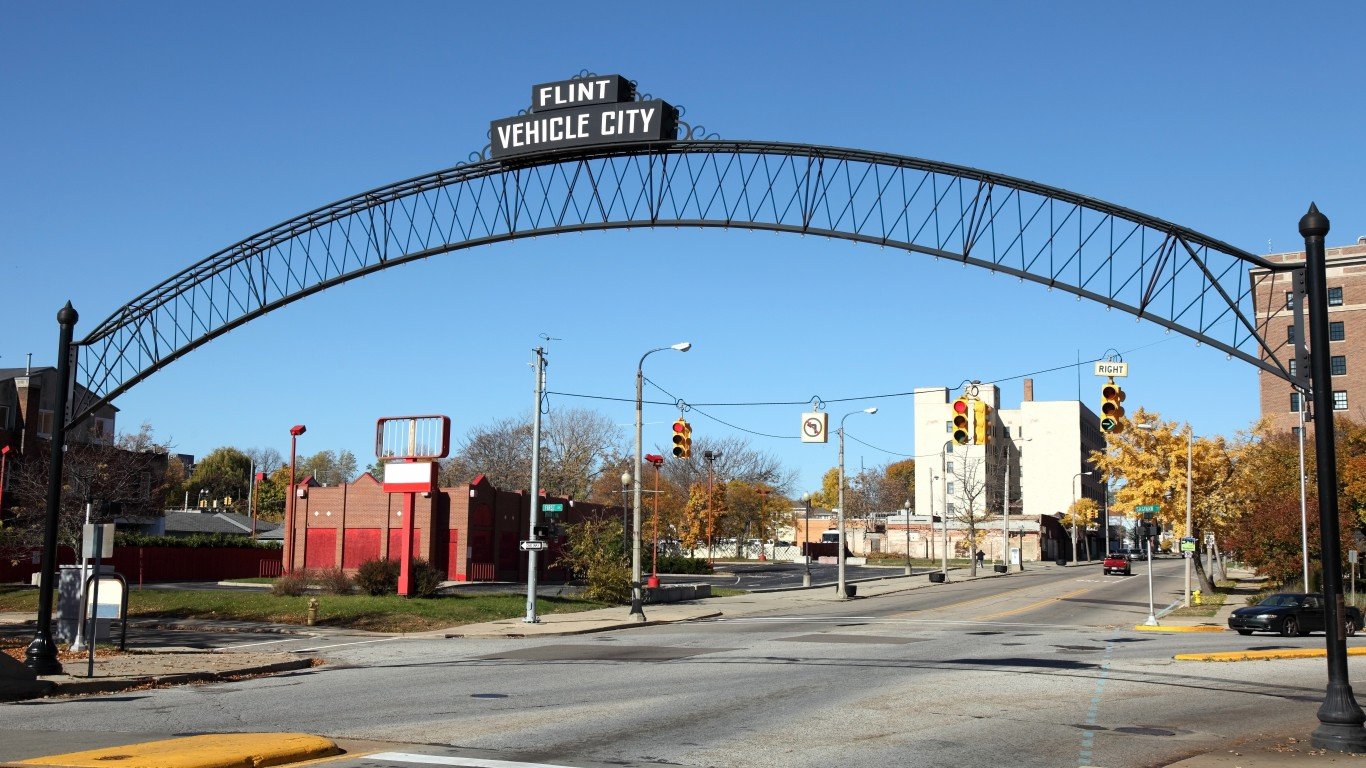
34. Flint, MI
> Annual drug deaths, 2019-2021: 47.7 per 100,000 residents
> Total drug deaths, 2019-2021: 579
> Poverty rate: 16.2%
> Population: 404,208
[recirclink id=1063290]

33. Dayton-Kettering, OH
> Annual drug deaths, 2019-2021: 47.7 per 100,000 residents
> Total drug deaths, 2019-2021: 1,159
> Poverty rate: 13.1%
> Population: 813,516
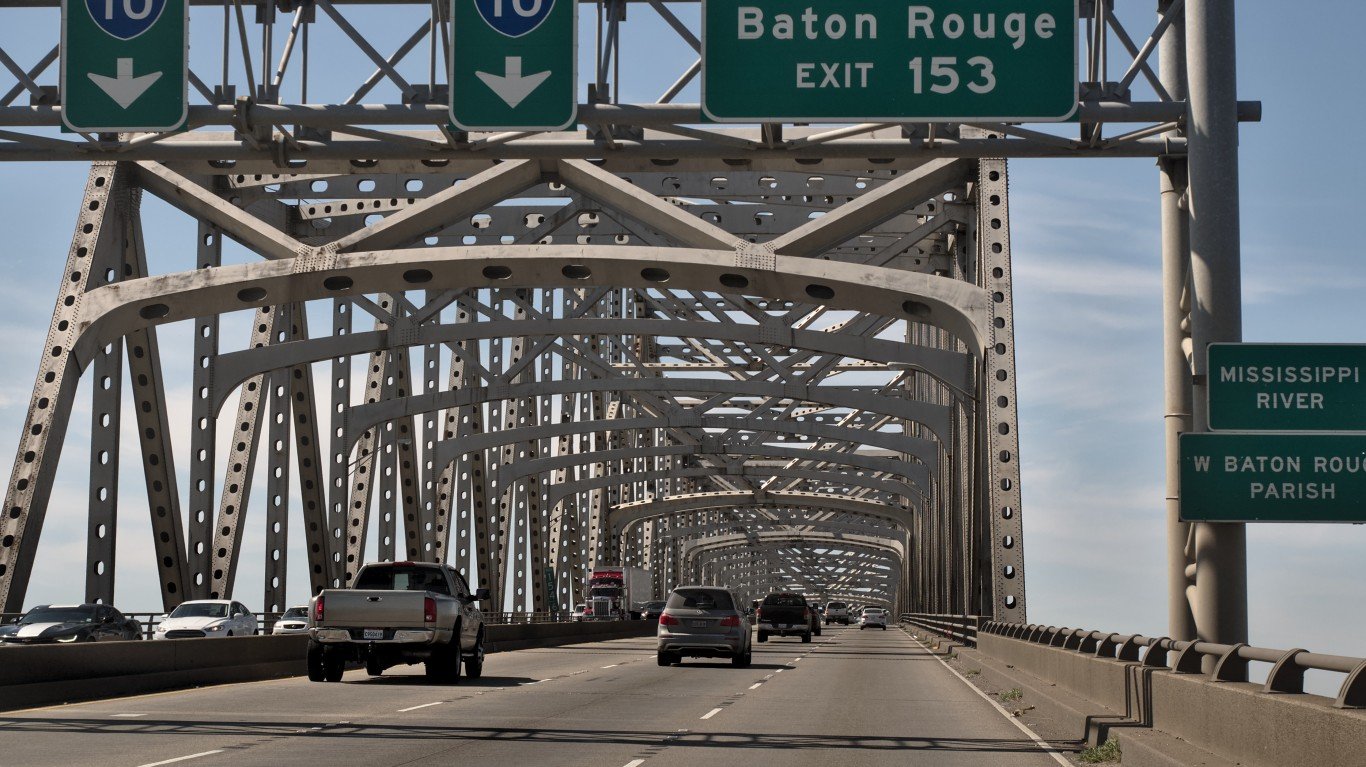
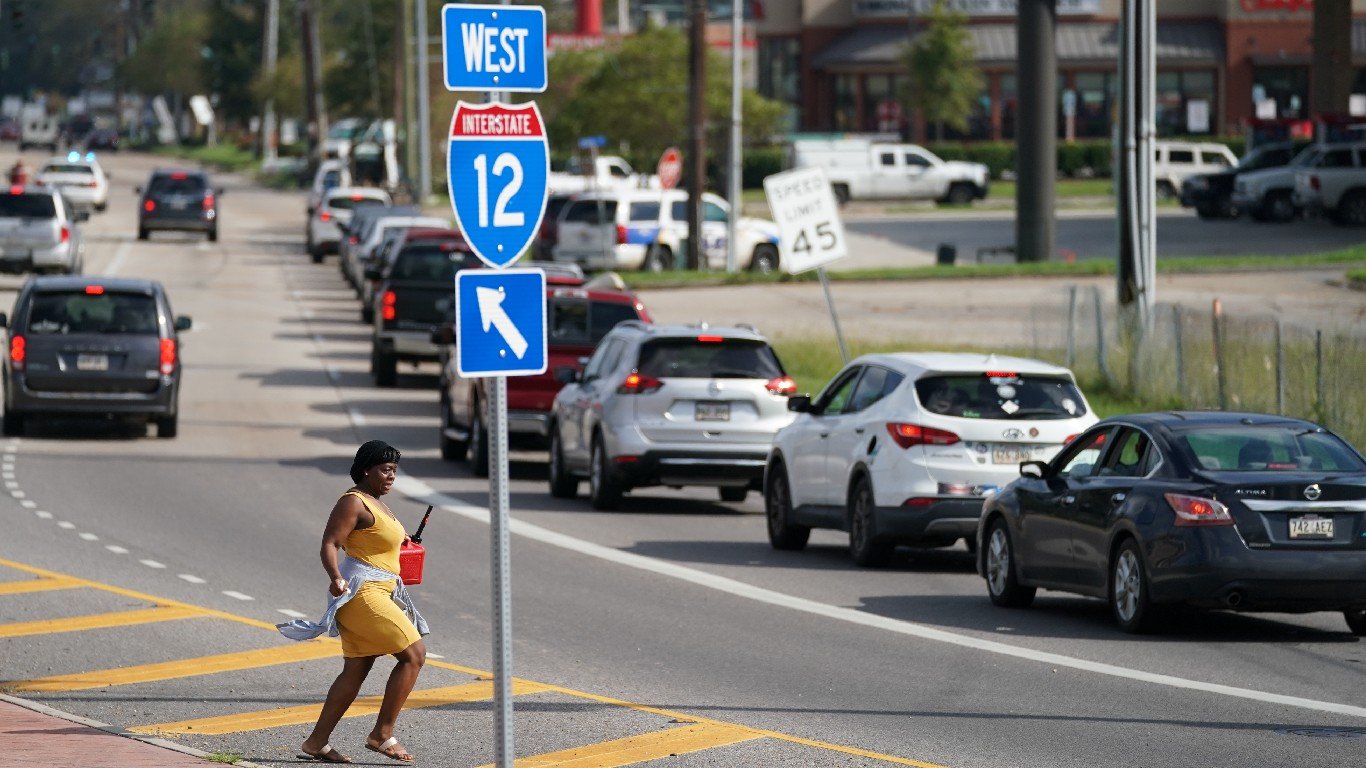
32. Baton Rouge, LA
> Annual drug deaths, 2019-2021: 47.9 per 100,000 residents
> Total drug deaths, 2019-2021: 1,239
> Poverty rate: 17.0%
> Population: 871,905
[in-text-ad-2]
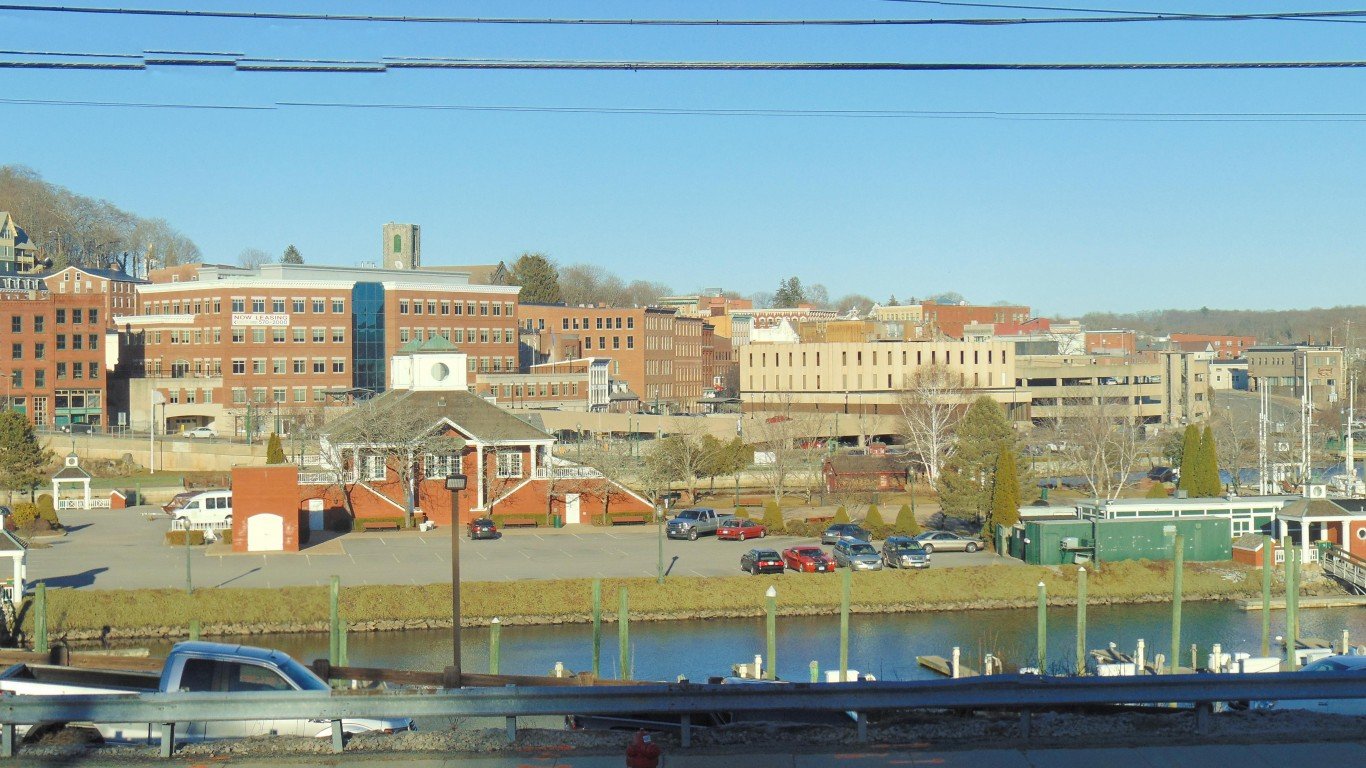
31. Cumberland, MD-WV
> Annual drug deaths, 2019-2021: 48.2 per 100,000 residents
> Total drug deaths, 2019-2021: 139
> Poverty rate: 13.5%
> Population: 94,586

30. Wheeling, WV-OH
> Annual drug deaths, 2019-2021: 48.6 per 100,000 residents
> Total drug deaths, 2019-2021: 201
> Poverty rate: 15.5%
> Population: 137,740
[in-text-ad]
29. Norwich-New London, CT
> Annual drug deaths, 2019-2021: 48.8 per 100,000 residents
> Total drug deaths, 2019-2021: 390
> Poverty rate: 8.6%
> Population: 268,805
[recirclink id=1208777]

28. Albuquerque, NM
> Annual drug deaths, 2019-2021: 49.3 per 100,000 residents
> Total drug deaths, 2019-2021: 1,361
> Poverty rate: 15.1%
> Population: 921,311

27. New Haven-Milford, CT
> Annual drug deaths, 2019-2021: 50.8 per 100,000 residents
> Total drug deaths, 2019-2021: 1,307
> Poverty rate: 11.8%
> Population: 863,700
[in-text-ad-2]

26. Deltona-Daytona Beach-Ormond Beach, FL
> Annual drug deaths, 2019-2021: 51.2 per 100,000 residents
> Total drug deaths, 2019-2021: 1,041
> Poverty rate: 13.2%
> Population: 685,344

25. Lexington-Fayette, KY
> Annual drug deaths, 2019-2021: 51.4 per 100,000 residents
> Total drug deaths, 2019-2021: 799
> Poverty rate: 13.2%
> Population: 517,846
[in-text-ad]
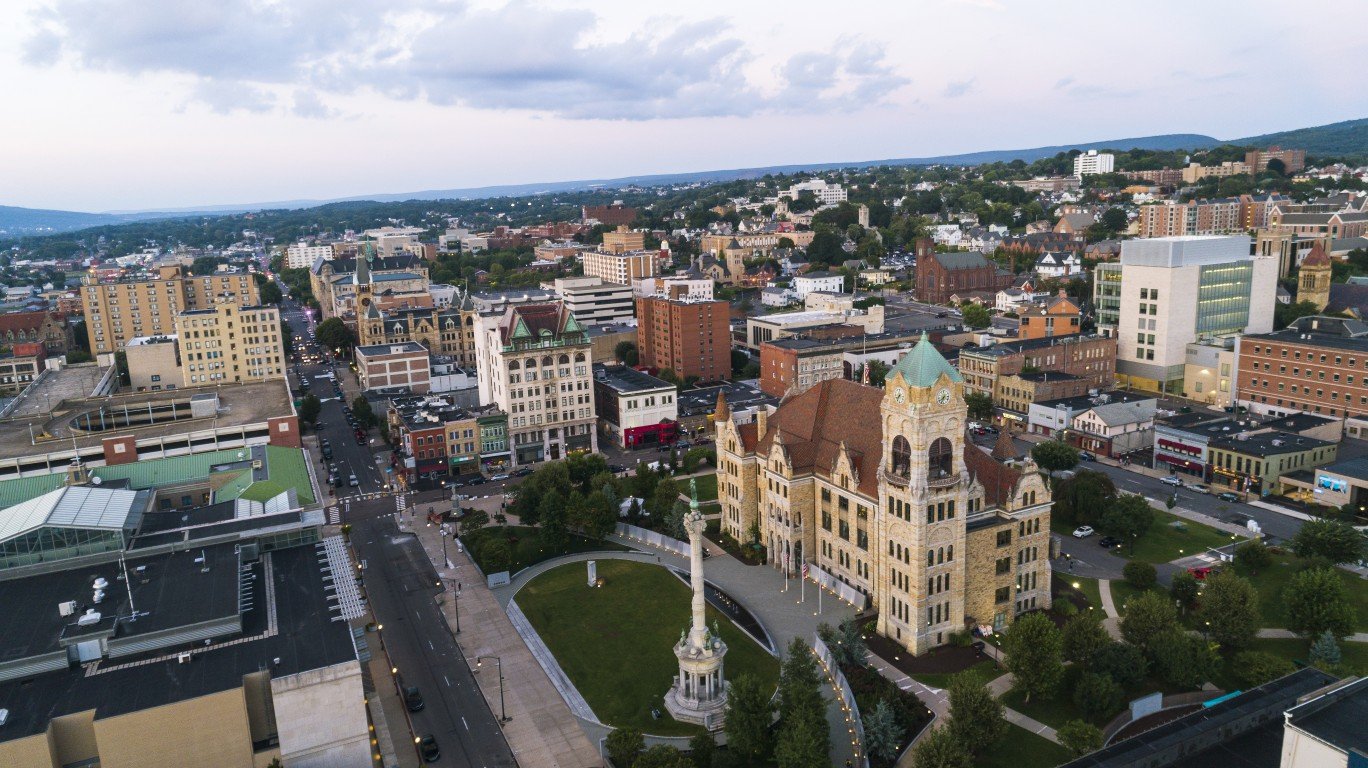
24. Scranton-Wilkes-Barre, PA
> Annual drug deaths, 2019-2021: 51.5 per 100,000 residents
> Total drug deaths, 2019-2021: 862
> Poverty rate: 13.1%
> Population: 567,750
[recirclink id=1050773]

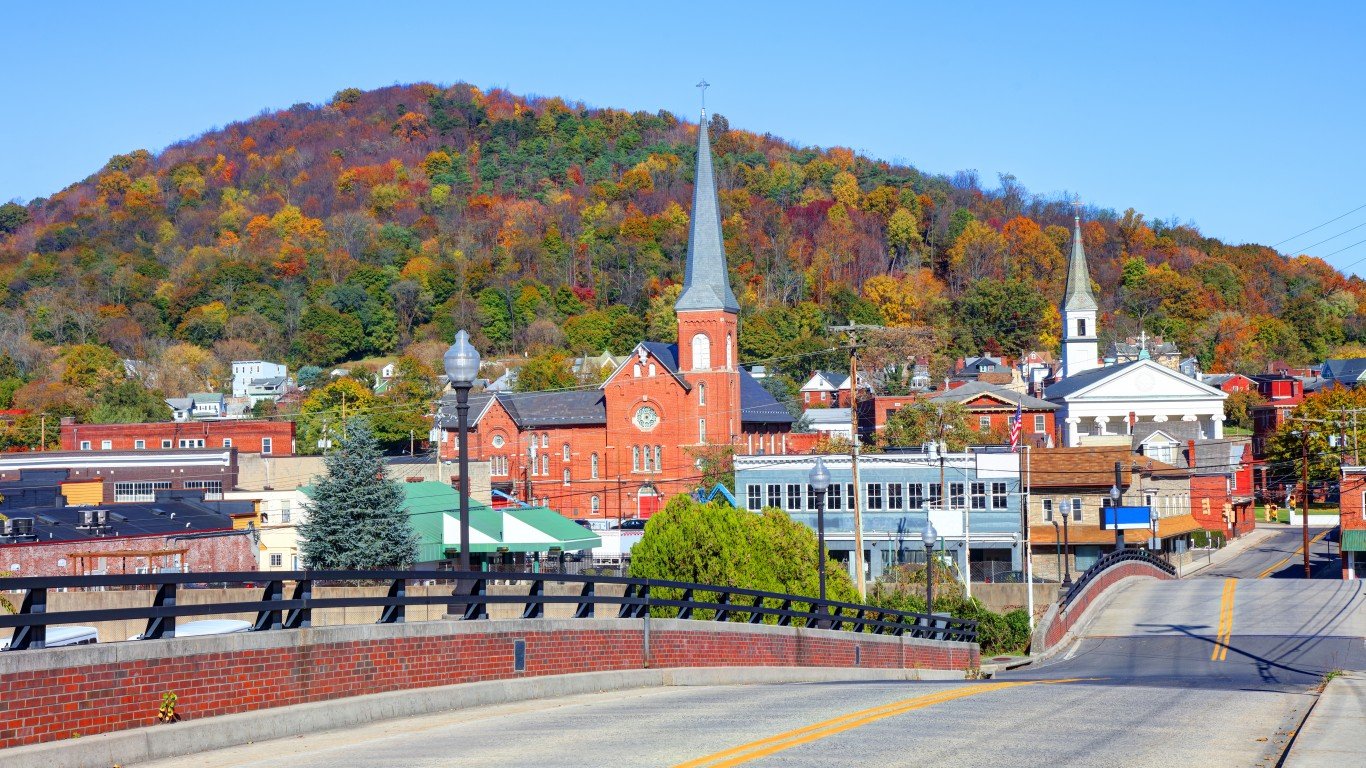
23. Parkersburg-Vienna, WV
> Annual drug deaths, 2019-2021: 52.5 per 100,000 residents
> Total drug deaths, 2019-2021: 140
> Poverty rate: 13.9%
> Population: 88,181

22. Springfield, OH
> Annual drug deaths, 2019-2021: 52.6 per 100,000 residents
> Total drug deaths, 2019-2021: 212
> Poverty rate: 16.3%
> Population: 135,633
[in-text-ad-2]

21. Pittsfield, MA
> Annual drug deaths, 2019-2021: 52.6 per 100,000 residents
> Total drug deaths, 2019-2021: 199
> Poverty rate: 9.8%
> Population: 128,657
20. Hammond, LA
> Annual drug deaths, 2019-2021: 52.9 per 100,000 residents
> Total drug deaths, 2019-2021: 215
> Poverty rate: 15.4%
> Population: 135,217
[in-text-ad]

19. Bangor, ME
> Annual drug deaths, 2019-2021: 53.2 per 100,000 residents
> Total drug deaths, 2019-2021: 243
> Poverty rate: 16.0%
> Population: 152,765
[recirclink id=1024545]

18. Vineland-Bridgeton, NJ
> Annual drug deaths, 2019-2021: 53.3 per 100,000 residents
> Total drug deaths, 2019-2021: 240
> Poverty rate: 13.3%
> Population: 153,627

17. Louisville/Jefferson County, KY-IN
> Annual drug deaths, 2019-2021: 55.4 per 100,000 residents
> Total drug deaths, 2019-2021: 2,116
> Poverty rate: 12.1%
> Population: 1,284,826
[in-text-ad-2]

16. Weirton-Steubenville, WV-OH
> Annual drug deaths, 2019-2021: 55.6 per 100,000 residents
> Total drug deaths, 2019-2021: 193
> Poverty rate: 16.9%
> Population: 113,798

15. New Bern, NC
> Annual drug deaths, 2019-2021: 56.8 per 100,000 residents
> Total drug deaths, 2019-2021: 194
> Poverty rate: 11.7%
> Population: 120,508
[in-text-ad]
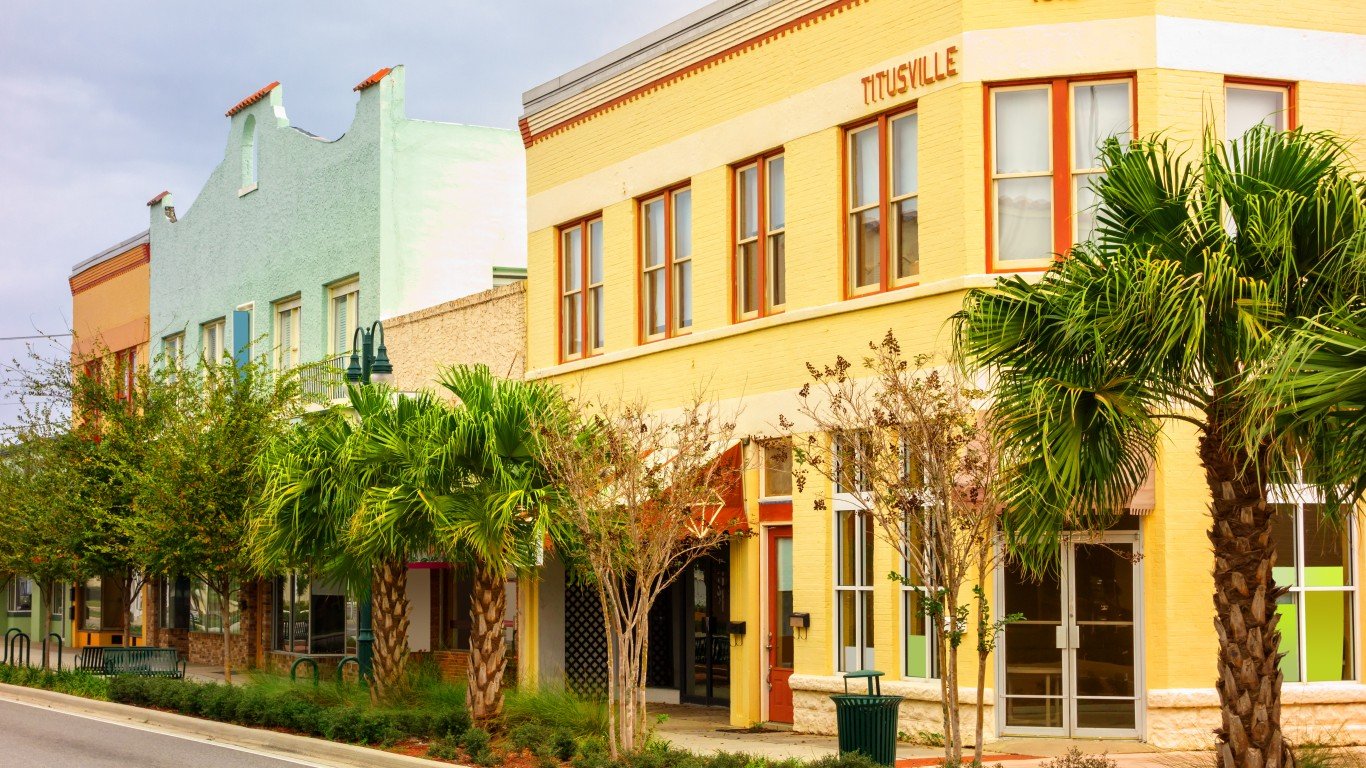
14. Palm Bay-Melbourne-Titusville, FL
> Annual drug deaths, 2019-2021: 56.9 per 100,000 residents
> Total drug deaths, 2019-2021: 1,040
> Poverty rate: 11.1%
> Population: 616,628
[recirclink id=1047417]

13. Muncie, IN
> Annual drug deaths, 2019-2021: 57.1 per 100,000 residents
> Total drug deaths, 2019-2021: 194
> Poverty rate: 18.1%
> Population: 111,871

12. Youngstown-Warren-Boardman, OH-PA
> Annual drug deaths, 2019-2021: 57.8 per 100,000 residents
> Total drug deaths, 2019-2021: 928
> Poverty rate: 16.6%
> Population: 538,069
[in-text-ad-2]
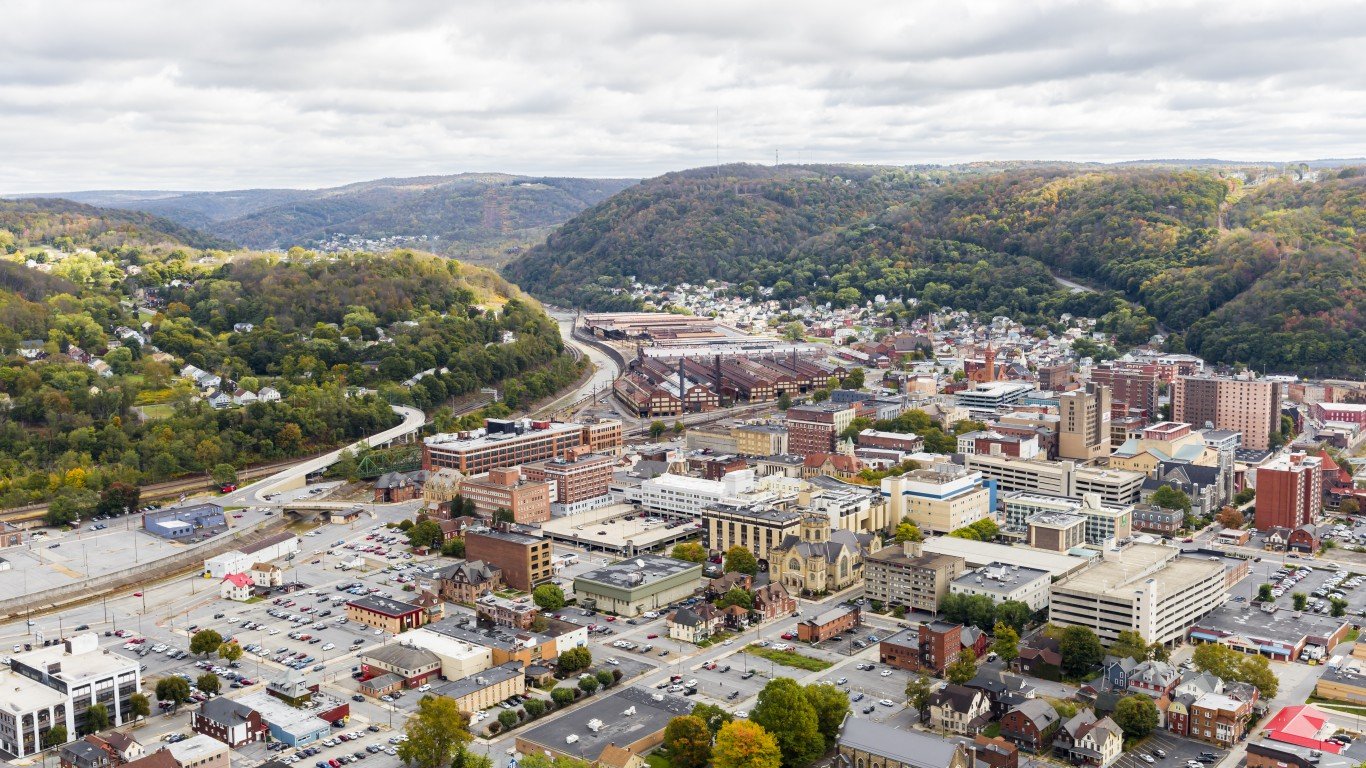
11. Johnstown, PA
> Annual drug deaths, 2019-2021: 58.3 per 100,000 residents
> Total drug deaths, 2019-2021: 228
> Poverty rate: 12.6%
> Population: 132,167

10. New Orleans-Metairie, LA
> Annual drug deaths, 2019-2021: 59.2 per 100,000 residents
> Total drug deaths, 2019-2021: 2,252
> Poverty rate: 18.4%
> Population: 1,261,726
[in-text-ad]
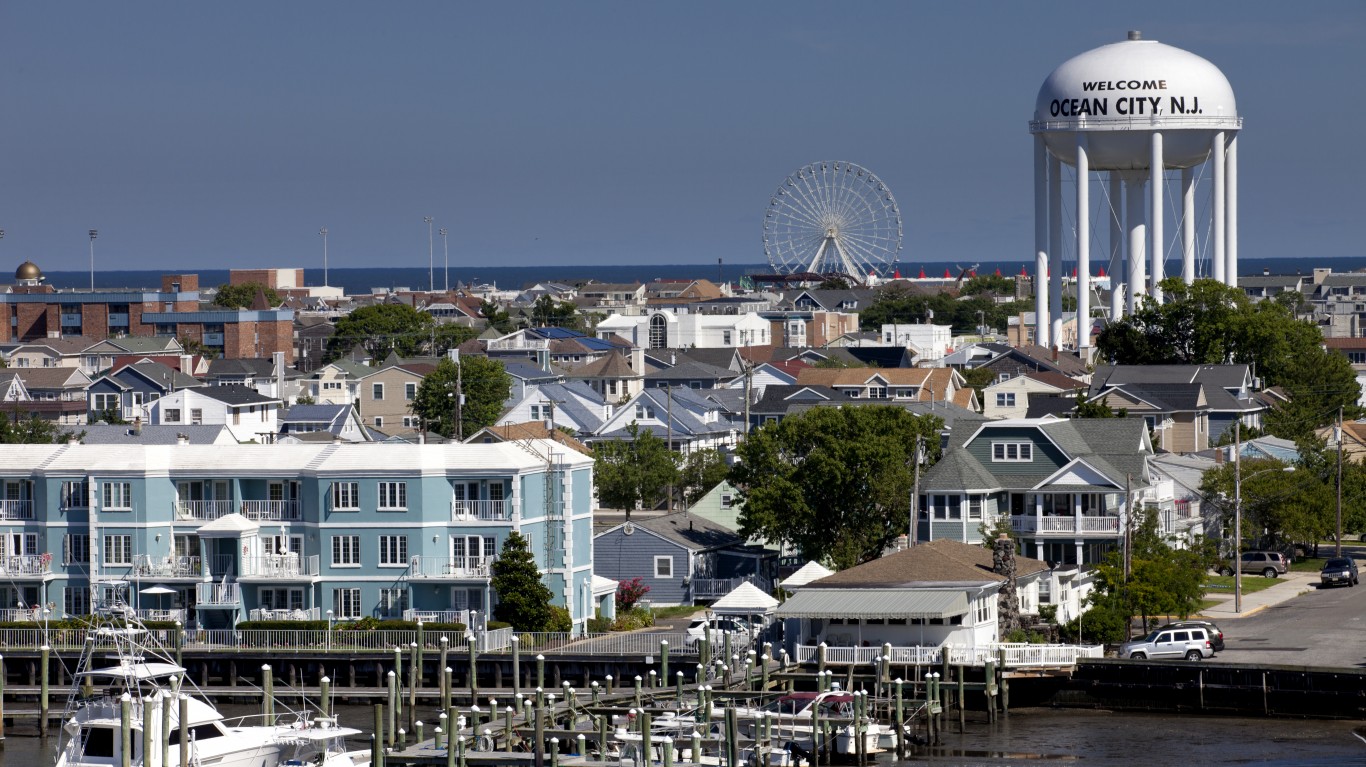
9. Ocean City, NJ
> Annual drug deaths, 2019-2021: 59.8 per 100,000 residents
> Total drug deaths, 2019-2021: 167
> Poverty rate: 6.7%
> Population: 95,661
[recirclink id=1063290]

8. Mansfield, OH
> Annual drug deaths, 2019-2021: 59.9 per 100,000 residents
> Total drug deaths, 2019-2021: 220
> Poverty rate: 12.3%
> Population: 125,195

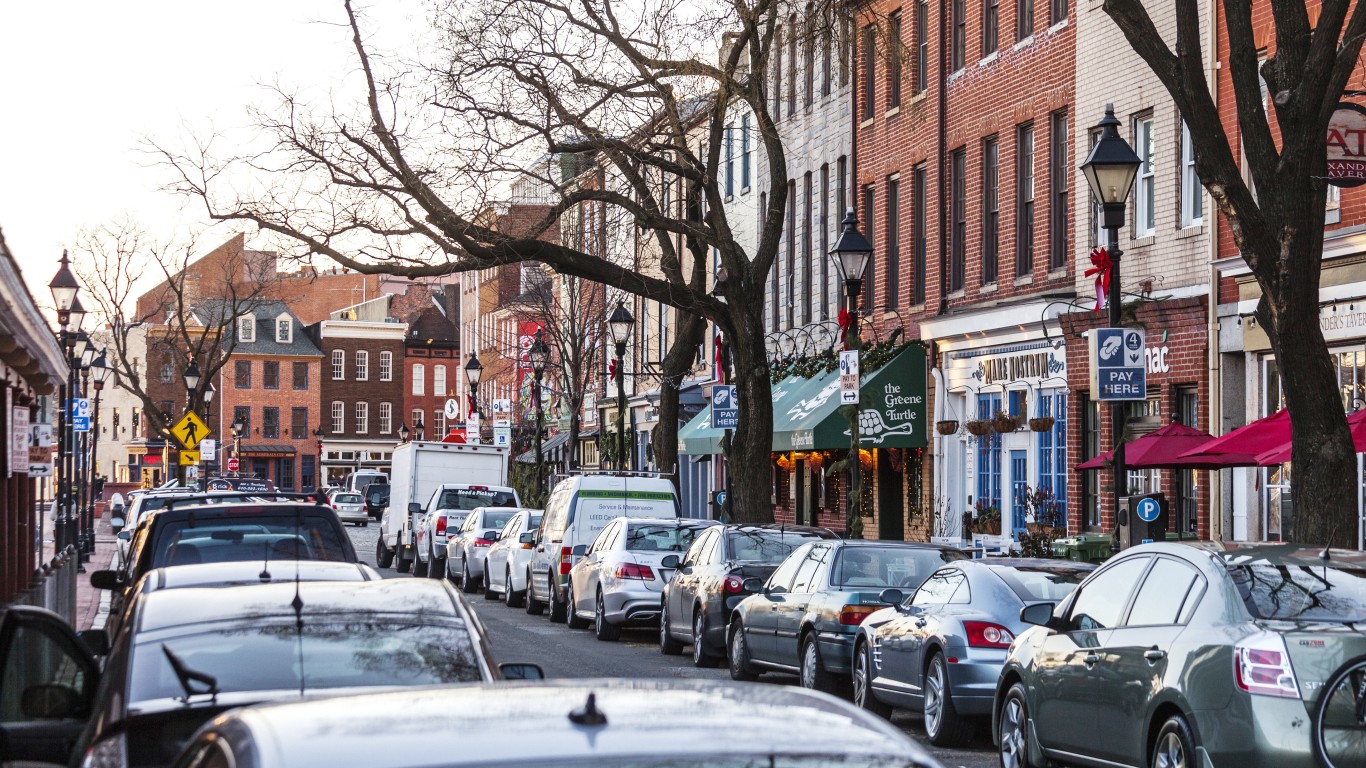
7. Atlantic City-Hammonton, NJ
> Annual drug deaths, 2019-2021: 60.4 per 100,000 residents
> Total drug deaths, 2019-2021: 484
> Poverty rate: 15.9%
> Population: 274,966
[in-text-ad-2]
6. Baltimore-Columbia-Towson, MD
> Annual drug deaths, 2019-2021: 62.9 per 100,000 residents
> Total drug deaths, 2019-2021: 5,307
> Poverty rate: 10.7%
> Population: 2,838,327

5. Knoxville, TN
> Annual drug deaths, 2019-2021: 67.8 per 100,000 residents
> Total drug deaths, 2019-2021: 1,791
> Poverty rate: 12.0%
> Population: 893,002
[in-text-ad]

4. Hagerstown-Martinsburg, MD-WV
> Annual drug deaths, 2019-2021: 67.9 per 100,000 residents
> Total drug deaths, 2019-2021: 596
> Poverty rate: 13.6%
> Population: 300,820
[recirclink id=1208777]

3. Huntington-Ashland, WV-KY-OH
> Annual drug deaths, 2019-2021: 90.3 per 100,000 residents
> Total drug deaths, 2019-2021: 963
> Poverty rate: 17.3%
> Population: 356,581

2. Charleston, WV
> Annual drug deaths, 2019-2021: 92.5 per 100,000 residents
> Total drug deaths, 2019-2021: 709
> Poverty rate: 17.0%
> Population: 252,942
[in-text-ad-2]

1. Beckley, WV
> Annual drug deaths, 2019-2021: 114.1 per 100,000 residents
> Total drug deaths, 2019-2021: 393
> Poverty rate: 22.7%
> Population: 113,698
Contact [email protected] for any questions or corrections.