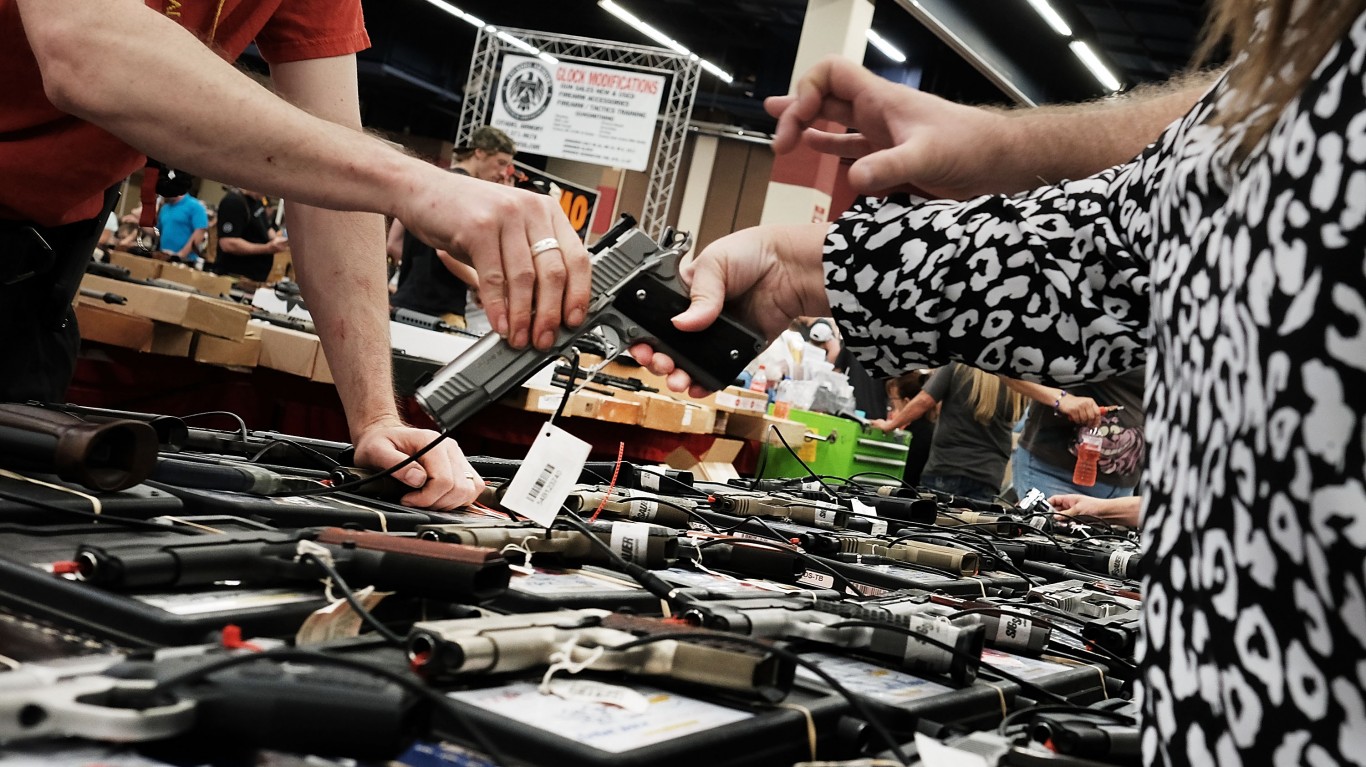
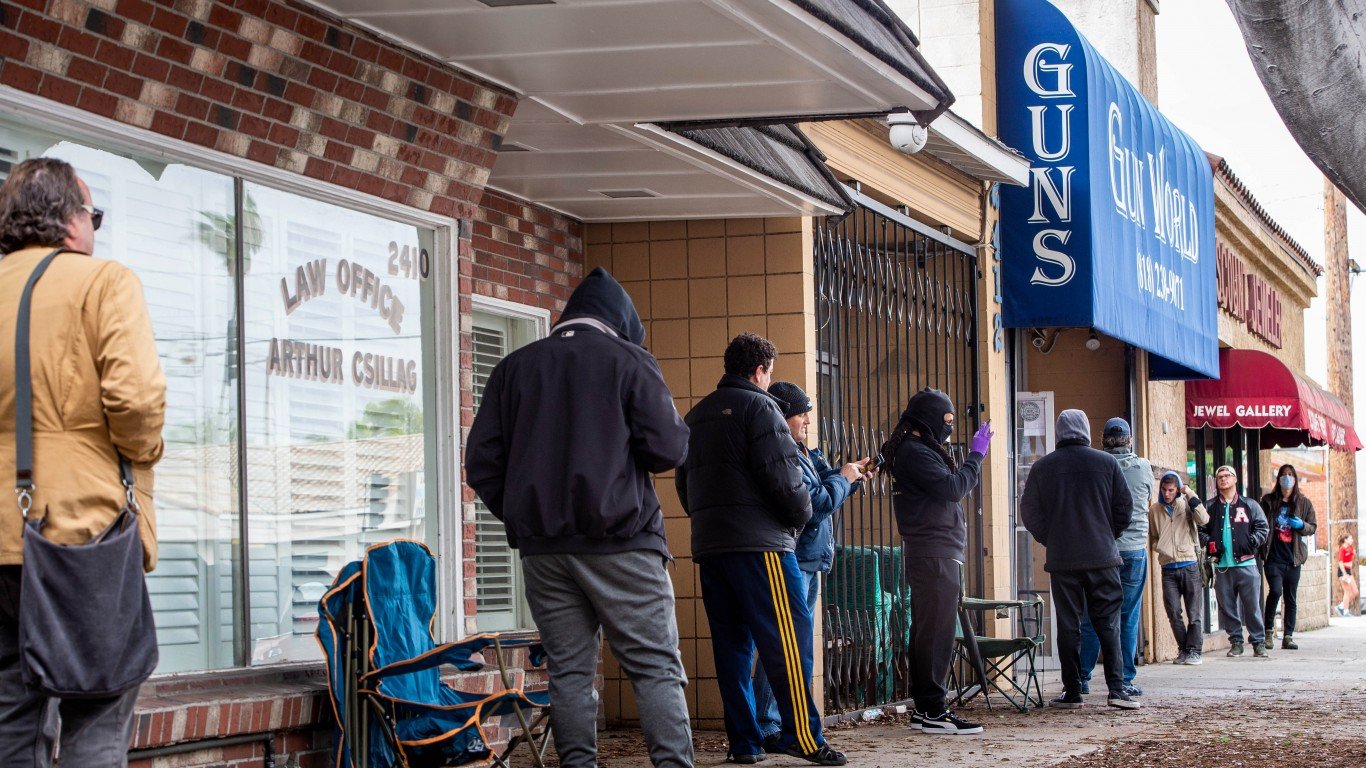
Oregon appears to be on the brink of becoming the latest state to introduce stricter gun control measures in the wake of the nation’s seemingly-endless stream of mass shootings. The state House of Representatives passed a gun control package that prohibits the sale of guns made at home without serial numbers (so called “ghost guns”) and increases the minimum age to buy most guns to 21, among other regulations. Now, based on data the FBI released on Tuesday, it appears that news of the legislation working its way through the state government may have prompted a spike in gun sales in the state.
Oregon’s background checks — a measure often used as a proxy for gun sales — spiked by almost 50% compared to the same period a year ago. While on the whole background checks are down nationwide, there are some states where gun sales appear to still be on the rise. (Also check out the states with the loosest gun laws.)
To identify the states where gun sales are increasing most, 24/7 Wall St. used data from the FBI’s National Instant Criminal Background Check System. Sixteen states reported increases in adjusted firearm background checks between April 2022 and April 2023. To reach a more accurate approximation of gun sales, we adjusted background checks by excluding checks for such categories as pawn shop transactions, returns, rentals, and rechecks (which are conducted periodically by some states on existing permit holders).
Even after removing some types of checks that are clearly unrelated to new firearm purchases, background checks still serve only as a rough approximation because every state has different background checks laws and accounting practices. (These were the best-selling guns last year.)
The states that reported the largest increases in background checks this March compared to the same period in 2022 include both states that tend to rank relatively low in gun sales per capita (approximated by checks per capita) each month and those that rank among the highest. Hawaii, even after reporting a 31.9% increase in background checks in April compared to the same month in 2022, still ranks dead last in background checks per person, at 1.3 per 1,000 state residents, compared to a national rate of 5.1 per 1,000 people.
At the other end of the list, there are multiple states like Oregon, which already had relatively high background checks, and the big increase in checks pushed the states higher up the ranks in apparent gun sales per capita. Oregon’s neighbors, Idaho and Washington, each reported double-digit percentage point increases in gun sales and now, with Oregon, rank as the three U.S. states with the most firearm background checks per capita. (These are the states where the most people bought guns in April.)
Click here to see 16 states where gun sales are still increasing.
Click here to read our detailed methodology.
16. Arkansas
> Change in background checks, Apr 2022-Apr 2023: +1.3% (+215 — 16th largest increase)
> Firearm background checks, Apr 2023: 16,191 — 21st fewest
> Firearm background checks, Apr 2022: 15,976 — 19th fewest
> Firearm background checks per 1,000 residents, Apr 2023: 5.3 — 21st fewest
> Firearm background checks per 1,000 residents, Apr 2022: 5.2 — 20th fewest
> Most common type of firearm check, Apr 2023: Handguns
> 2022 population: 3,045,637 — 18th smallest
[in-text-ad]
15. Massachusetts
> Change in background checks, Apr 2022-Apr 2023: +1.5% (+271 — 14th largest increase)
> Firearm background checks, Apr 2023: 18,755 — 6th fewest
> Firearm background checks, Apr 2022: 18,484 — 20th fewest
> Firearm background checks per 1,000 residents, Apr 2023: 2.7 — 6th fewest
> Firearm background checks per 1,000 residents, Apr 2022: 2.6 — 6th fewest
> Most common type of firearm check, Apr 2023: Handguns
> 2022 population: 6,981,974 — 16th largest
[recirclink id=1149324]
14. Louisiana
> Change in background checks, Apr 2022-Apr 2023: +1.5% (+366 — 13th largest increase)
> Firearm background checks, Apr 2023: 24,616 — 23rd fewest
> Firearm background checks, Apr 2022: 24,250 — 24th most
> Firearm background checks per 1,000 residents, Apr 2023: 5.4 — 23rd fewest
> Firearm background checks per 1,000 residents, Apr 2022: 5.3 — 21st fewest
> Most common type of firearm check, Apr 2023: Handguns
> 2022 population: 4,590,241 — 25th largest
13. California
> Change in background checks, Apr 2022-Apr 2023: +1.6% (+1,611 — 9th largest increase)
> Firearm background checks, Apr 2023: 100,320 — 5th fewest
> Firearm background checks, Apr 2022: 98,709 — 4th most
> Firearm background checks per 1,000 residents, Apr 2023: 2.6 — 5th fewest
> Firearm background checks per 1,000 residents, Apr 2022: 2.5 — 5th fewest
> Most common type of firearm check, Apr 2023: Handguns
> 2022 population: 39,029,342 — the largest
[in-text-ad-2]
12. Nebraska
> Change in background checks, Apr 2022-Apr 2023: +4.0% (+260 — 15th largest increase)
> Firearm background checks, Apr 2023: 6,725 — 8th fewest
> Firearm background checks, Apr 2022: 6,465 — 7th fewest
> Firearm background checks per 1,000 residents, Apr 2023: 3.4 — 8th fewest
> Firearm background checks per 1,000 residents, Apr 2022: 3.3 — 9th fewest
> Most common type of firearm check, Apr 2023: Long guns
> 2022 population: 1,967,923 — 14th smallest
11. Iowa
> Change in background checks, Apr 2022-Apr 2023: +6.7% (+685 — 11th largest increase)
> Firearm background checks, Apr 2023: 10,843 — 7th fewest
> Firearm background checks, Apr 2022: 10,158 — 11th fewest
> Firearm background checks per 1,000 residents, Apr 2023: 3.4 — 7th fewest
> Firearm background checks per 1,000 residents, Apr 2022: 3.2 — 8th fewest
> Most common type of firearm check, Apr 2023: Long guns
> 2022 population: 3,200,517 — 20th smallest
[in-text-ad]

10. Colorado
> Change in background checks, Apr 2022-Apr 2023: +8.1% (+3,536 — 7th largest increase)
> Firearm background checks, Apr 2023: 47,276 — 11th most
> Firearm background checks, Apr 2022: 43,740 — 16th most
> Firearm background checks per 1,000 residents, Apr 2023: 8.1 — 11th most
> Firearm background checks per 1,000 residents, Apr 2022: 7.5 — 17th most
> Most common type of firearm check, Apr 2023: Handguns
> 2022 population: 5,839,926 — 21st largest
[recirclink id=1191452]
9. Utah
> Change in background checks, Apr 2022-Apr 2023: +8.8% (+2,048 — 8th largest increase)
> Firearm background checks, Apr 2023: 25,391 — 15th most
> Firearm background checks, Apr 2022: 23,343 — 25th most
> Firearm background checks per 1,000 residents, Apr 2023: 7.5 — 15th most
> Firearm background checks per 1,000 residents, Apr 2022: 6.9 — 18th most
> Most common type of firearm check, Apr 2023: Handguns
> 2022 population: 3,380,800 — 21st smallest
8. Nevada
> Change in background checks, Apr 2022-Apr 2023: +14.0% (+1,602 — 10th largest increase)
> Firearm background checks, Apr 2023: 13,025 — 11th fewest
> Firearm background checks, Apr 2022: 11,423 — 12th fewest
> Firearm background checks per 1,000 residents, Apr 2023: 4.1 — 11th fewest
> Firearm background checks per 1,000 residents, Apr 2022: 3.6 — 10th fewest
> Most common type of firearm check, Apr 2023: Handguns
> 2022 population: 3,177,772 — 19th smallest
[in-text-ad-2]
7. Illinois
> Change in background checks, Apr 2022-Apr 2023: +26.8% (+16,174 — 4th largest increase)
> Firearm background checks, Apr 2023: 76,572 — 22nd most
> Firearm background checks, Apr 2022: 60,398 — 8th most
> Firearm background checks per 1,000 residents, Apr 2023: 6.1 — 22nd most
> Firearm background checks per 1,000 residents, Apr 2022: 4.8 — 16th fewest
> Most common type of firearm check, Apr 2023: Handguns
> 2022 population: 12,582,032 — 6th largest
6. Idaho
> Change in background checks, Apr 2022-Apr 2023: +29.9% (+5,643 — 6th largest increase)
> Firearm background checks, Apr 2023: 24,505 — the most
> Firearm background checks, Apr 2022: 18,862 — 21st fewest
> Firearm background checks per 1,000 residents, Apr 2023: 12.6 — the most
> Firearm background checks per 1,000 residents, Apr 2022: 9.7 — 4th most
> Most common type of firearm check, Apr 2023: Handguns
> 2022 population: 1,939,033 — 13th smallest
[in-text-ad]
5. Washington
> Change in background checks, Apr 2022-Apr 2023: +30.9% (+20,149 — 2nd largest increase)
> Firearm background checks, Apr 2023: 85,459 — 3rd most
> Firearm background checks, Apr 2022: 65,310 — 6th most
> Firearm background checks per 1,000 residents, Apr 2023: 11.0 — 3rd most
> Firearm background checks per 1,000 residents, Apr 2022: 8.4 — 9th most
> Most common type of firearm check, Apr 2023: Handguns
> 2022 population: 7,785,786 — 13th largest
[recirclink id=1159297]
4. Hawaii
> Change in background checks, Apr 2022-Apr 2023: +31.9% (+462 — 12th largest increase)
> Firearm background checks, Apr 2023: 1,912 — the fewest
> Firearm background checks, Apr 2022: 1,450 — the fewest
> Firearm background checks per 1,000 residents, Apr 2023: 1.3 — the fewest
> Firearm background checks per 1,000 residents, Apr 2022: 1.0 — the fewest
> Most common type of firearm check, Apr 2023: No data available
> 2022 population: 1,440,196 — 11th smallest

3. Maryland
> Change in background checks, Apr 2022-Apr 2023: +46.7% (+8,865 — 5th largest increase)
> Firearm background checks, Apr 2023: 27,849 — 15th fewest
> Firearm background checks, Apr 2022: 18,984 — 22nd fewest
> Firearm background checks per 1,000 residents, Apr 2023: 4.5 — 15th fewest
> Firearm background checks per 1,000 residents, Apr 2022: 3.1 — 7th fewest
> Most common type of firearm check, Apr 2023: Handguns
> 2022 population: 6,164,660 — 19th largest
[in-text-ad-2]

2. Oregon
> Change in background checks, Apr 2022-Apr 2023: +49.8% (+16,532 — 3rd largest increase)
> Firearm background checks, Apr 2023: 49,724 — 2nd most
> Firearm background checks, Apr 2022: 33,192 — 21st most
> Firearm background checks per 1,000 residents, Apr 2023: 11.7 — 2nd most
> Firearm background checks per 1,000 residents, Apr 2022: 7.8 — 14th most
> Most common type of firearm check, Apr 2023: Handguns
> 2022 population: 4,240,137 — 24th smallest
1. North Carolina
> Change in background checks, Apr 2022-Apr 2023: +84.5% (+36,398 — the largest increase)
> Firearm background checks, Apr 2023: 79,484 — 17th most
> Firearm background checks, Apr 2022: 43,086 — 17th most
> Firearm background checks per 1,000 residents, Apr 2023: 7.4 — 17th most
> Firearm background checks per 1,000 residents, Apr 2022: 4.0 — 11th fewest
> Most common type of firearm check, Apr 2023: Long guns
> 2022 population: 10,698,973 — 9th largest
Methodology
To identify the states where gun sales are increasing fastest, 24/7 Wall St. used data from the FBI’s National Instant Criminal Background Check System. A total of 16 states reported increases in adjusted firearm background checks between April 2022 and April 2023. To reach a more accurate approximation of gun sales, we excluded checks for such categories as pawn shop transactions, returns, rentals, and rechecks (which are conducted periodically by some states on existing permit holders).
Even after removing some types of checks that are clearly unrelated to new firearm purchases, background checks still serve only as a rough approximation, because every state has different laws in terms of when background checks are required and different accounting practices.
The most glaring example of this is Illinois, which alone accounted for about half of the background checks in the country after excluding the aforementioned categories of checks. Illinois no longer breaks down background checks separately, but did so from July 2016 through July 2021. During the four full years of data, an average of 9.2% of Illinois’s non-private sale or gun-specific permit checks were non-rechecks. We applied that average to the most recent state figures to estimate Illinois’ count. This was done only because Illinois is such a glaring example of inconsistency and because there was historical data to produce an estimate.
There are likely other states for which the background check figures listed are inflated or underestimated proxies for gun sales.
Population data came from the U.S. Census Bureau’s Population and Housing Unit Estimates Program, and are for July of 2022, the most recent data available.
Contact [email protected] for any questions or corrections.