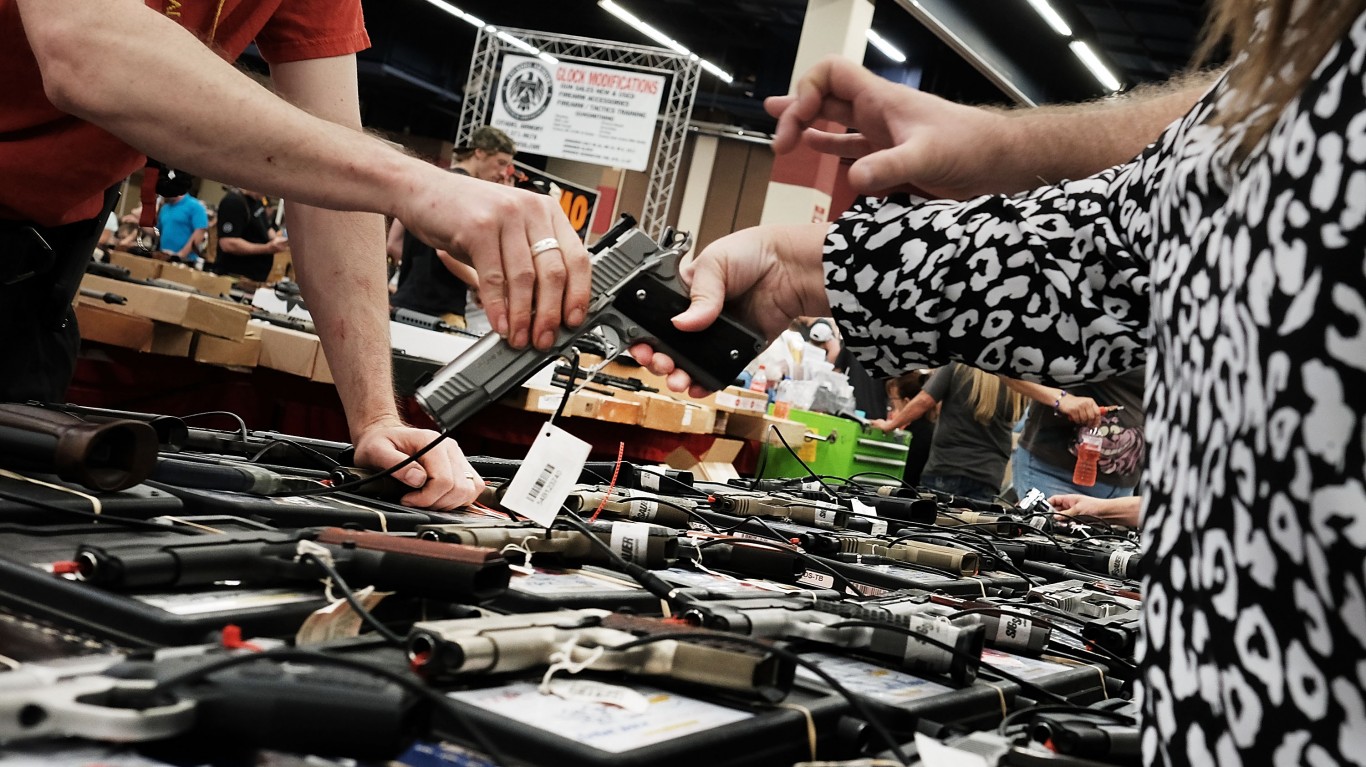
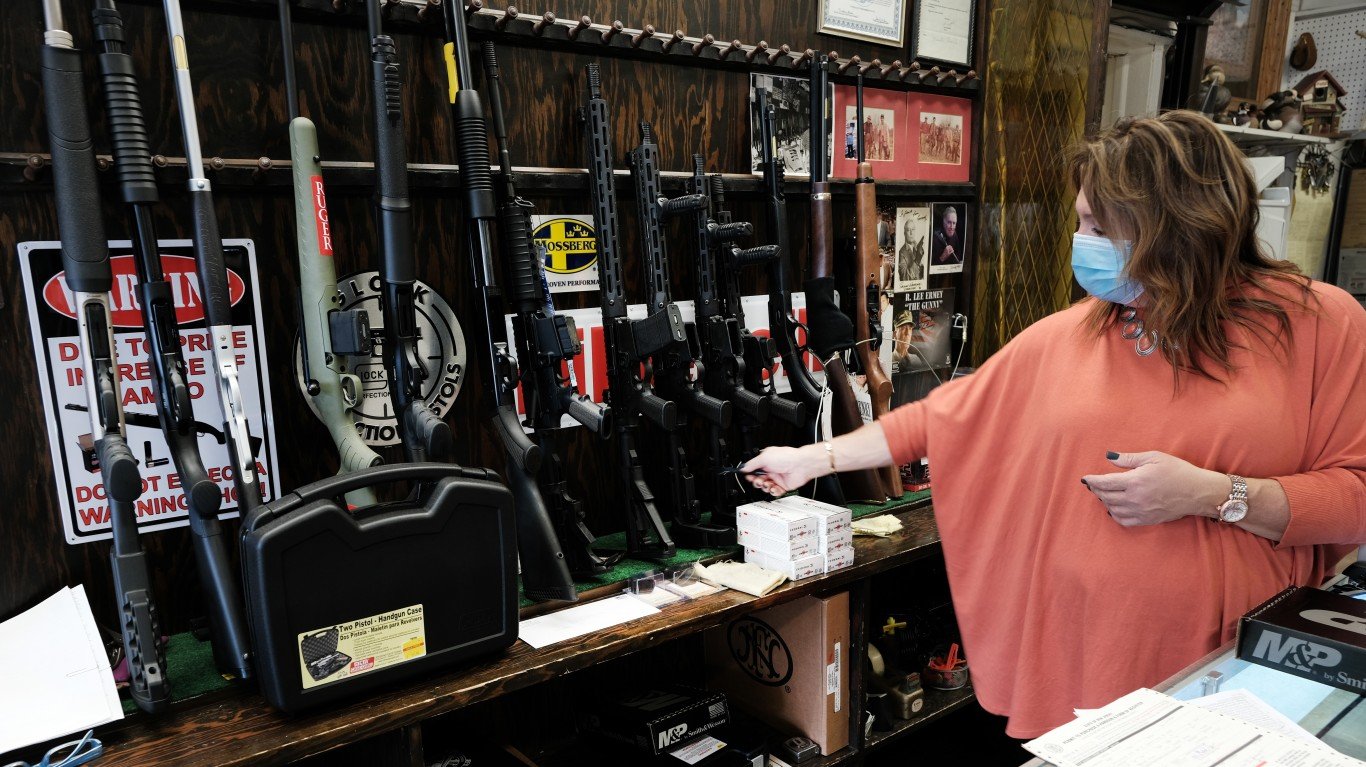
During the COVID-19 pandemic, a time of great uncertainty, Americans bought guns at a rate not seen before. An estimated 60 million firearms were purchased in the United States from 2020 through 2022, according to an analysis by The Trace, a nonprofit news organization that tracks gun violence. The report also found that during that time, 5% of the U.S. population said they bought a gun for the first time.
24/7 Wall St.’s analysis of FBI’s firearm background check data from — the best available approximation for U.S. gun sales — shows a similar pattern. Though background checks have generally trended higher over the years, they jumped from 28.4 million in 2019 to 39.7 million in 2020 and remained elevated at 38.9 million in 2021. Background checks declined meaningfully to 31.6 million in 2022, and it appears this year they are similar to 2022 levels on a national level. And while in the majority of states, gun sales appear to be down, in a dozen of states they are higher.
To identify the states where gun sales are increasing this year, 24/7 Wall St. used data from the FBI’s National Instant Criminal Background Check System. We listed the 12 states that reported at least a 1% increase in sales in the first six months of 2023 compared to the same period in 2022. To reach a more accurate approximation of gun sales, we adjusted background checks by excluding checks for such categories as pawn shop transactions, returns, rentals, and rechecks. Even after these adjustments, background checks still serve only as a rough approximation because every state has different accounting practices and background check laws. (These are the companies selling the most guns.)
The states with the biggest increases in background checks this year compared to the same period in 2022 include both states where guns are wildly popular, and those where that is decidedly not the case. Hawaii had a more than 30% increase in checks, which is the third-biggest increase, but the state still has the fewest checks per capita, with 8.2 per 1,000 state residents.
Meanwhile, Oregon, which ranks right above Hawaii with a 43.1% increase in the first half of 2023 compared to the same period in 2022, has the second highest number among states of gun checks per capita, with 66.5 per 1,000 residents. (These are the states where the most people have bought guns so far this year.)
Click here to see states where gun sales are actually up this year.

12. Colorado
> Change in background checks, Jan-June to Jan-June 2023: +1.6% (+4,235 — 6th largest increase)
> Firearm background checks, Jan-June 2023: 268,304 — 14th most
> Firearm background checks, Jan-June 2022: 264,069 — 15th most
> Firearm background checks per 1,000 residents, Jan-June 2023: 45.9 — 11th most
> Firearm background checks per 1,000 residents, Jan-June 2022: 45.2 — 13th most
> Most common type of firearm check, Jan-June 2023: Handguns
> 2022 population: 5.8 million — 21st largest
[in-text-ad]
11. West Virginia
> Change in background checks, Jan-June to Jan-June 2023: +2.1% (+1,741 — 2nd smallest increase)
> Firearm background checks, Jan-June 2023: 85,450 — 18th fewest
> Firearm background checks, Jan-June 2022: 83,709 — 17th fewest
> Firearm background checks per 1,000 residents, Jan-June 2023: 48.1 — 9th most
> Firearm background checks per 1,000 residents, Jan-June 2022: 47.2 — 10th most
> Most common type of firearm check, Jan-June 2023: Handguns
> 2022 population: 1.8 million — 12th smallest
[recirclink id=1207370]

10. Idaho
> Change in background checks, Jan-June to Jan-June 2023: +2.4% (+2,763 — 5th smallest increase)
> Firearm background checks, Jan-June 2023: 118,285 — 23rd fewest
> Firearm background checks, Jan-June 2022: 115,522 — 22nd fewest
> Firearm background checks per 1,000 residents, Jan-June 2023: 61.0 — 2nd most
> Firearm background checks per 1,000 residents, Jan-June 2022: 59.6 — 2nd most
> Most common type of firearm check, Jan-June 2023: Handguns
> 2022 population: 1.9 million — 13th smallest
9. Iowa
> Change in background checks, Jan-June to Jan-June 2023: +2.9% (+1,837 — 3rd smallest increase)
> Firearm background checks, Jan-June 2023: 66,053 — 13th fewest
> Firearm background checks, Jan-June 2022: 64,216 — 11th fewest
> Firearm background checks per 1,000 residents, Jan-June 2023: 20.6 — 8th fewest
> Firearm background checks per 1,000 residents, Jan-June 2022: 20.1 — 9th fewest
> Most common type of firearm check, Jan-June 2023: Handguns
> 2022 population: 3.2 million — 20th smallest
[in-text-ad-2]
8. New Jersey
> Change in background checks, Jan-June to Jan-June 2023: +4.9% (+3,954 — 7th largest increase)
> Firearm background checks, Jan-June 2023: 85,138 — 17th fewest
> Firearm background checks, Jan-June 2022: 81,184 — 15th fewest
> Firearm background checks per 1,000 residents, Jan-June 2023: 9.2 — 3rd fewest
> Firearm background checks per 1,000 residents, Jan-June 2022: 8.8 — 2nd fewest
> Most common type of firearm check, Jan-June 2023: Handguns
> 2022 population: 9.3 million — 11th largest
7. Nebraska
> Change in background checks, Jan-June to Jan-June 2023: +5.7% (+2,134 — 4th smallest increase)
> Firearm background checks, Jan-June 2023: 39,670 — 9th fewest
> Firearm background checks, Jan-June 2022: 37,536 — 7th fewest
> Firearm background checks per 1,000 residents, Jan-June 2023: 20.2 — 7th fewest
> Firearm background checks per 1,000 residents, Jan-June 2022: 19.1 — 8th fewest
> Most common type of firearm check, Jan-June 2023: Long guns
> 2022 population: 2.0 million — 14th smallest
[in-text-ad]
6. Utah
> Change in background checks, Jan-June to Jan-June 2023: +11.9% (+16,365 — 5th largest increase)
> Firearm background checks, Jan-June 2023: 153,703 — 25th most
> Firearm background checks, Jan-June 2022: 137,338 — 25th most
> Firearm background checks per 1,000 residents, Jan-June 2023: 45.5 — 14th most
> Firearm background checks per 1,000 residents, Jan-June 2022: 40.6 — 19th most
> Most common type of firearm check, Jan-June 2023: Handguns
> 2022 population: 3.4 million — 21st smallest
[recirclink id=1271251]
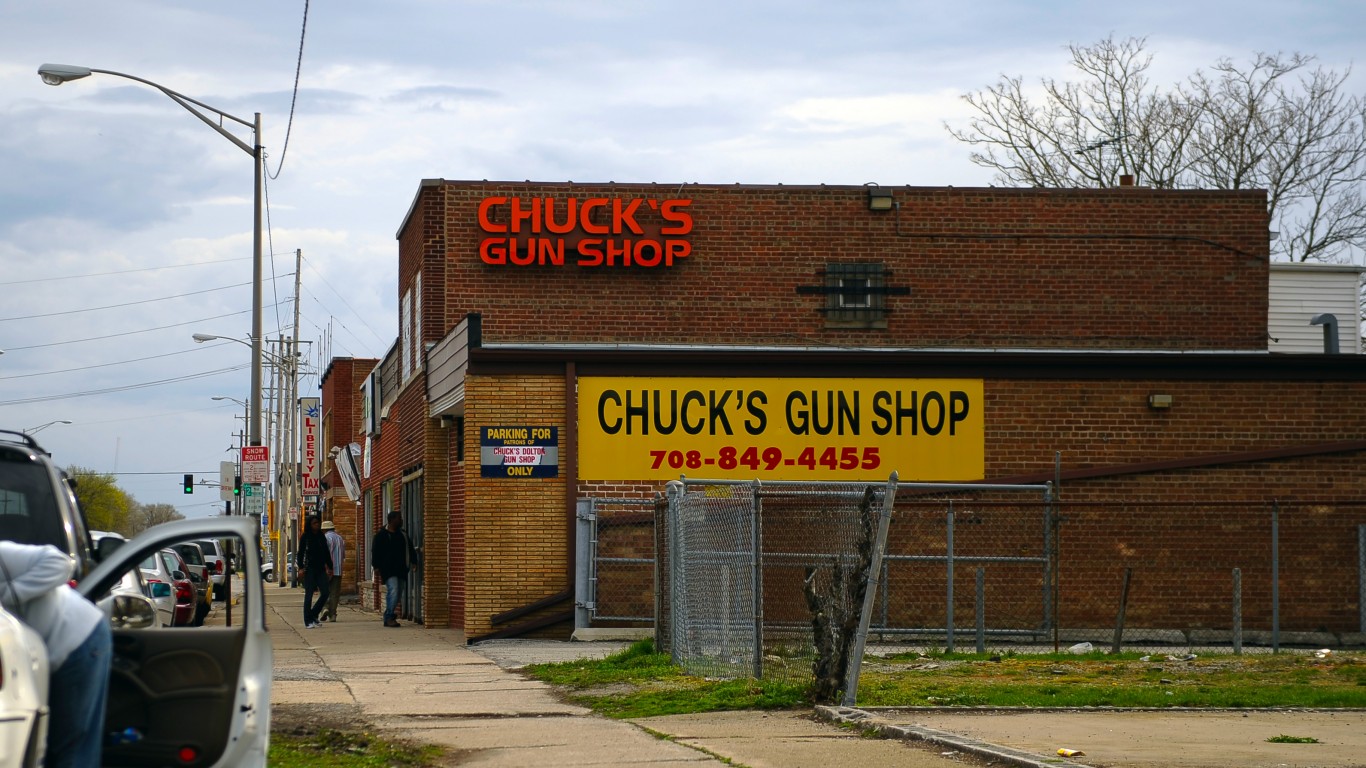
5. Illinois
> Change in background checks, Jan-June to Jan-June 2023: +16.6% (+63,768 — 3rd largest increase)
> Firearm background checks, Jan-June 2023: 447,936 — 5th most
> Firearm background checks, Jan-June 2022: 384,168 — 7th most
> Firearm background checks per 1,000 residents, Jan-June 2023: 35.6 — 24th most
> Firearm background checks per 1,000 residents, Jan-June 2022: 30.5 — 16th fewest
> Most common type of firearm check, Jan-June 2023: Handguns
> 2022 population: 12.6 million — 6th largest
4. North Carolina
> Change in background checks, Jan-June to Jan-June 2023: +21.7% (+63,647 — 4th largest increase)
> Firearm background checks, Jan-June 2023: 357,003 — 9th most
> Firearm background checks, Jan-June 2022: 293,356 — 12th most
> Firearm background checks per 1,000 residents, Jan-June 2023: 33.4 — 25th most
> Firearm background checks per 1,000 residents, Jan-June 2022: 27.4 — 13th fewest
> Most common type of firearm check, Jan-June 2023: Handguns
> 2022 population: 10.7 million — 9th largest
[in-text-ad-2]
3. Hawaii
> Change in background checks, Jan-June to Jan-June 2023: +30.4% (+2,768 — 6th smallest increase)
> Firearm background checks, Jan-June 2023: 11,863 — the fewest
> Firearm background checks, Jan-June 2022: 9,095 — the fewest
> Firearm background checks per 1,000 residents, Jan-June 2023: 8.2 — the fewest
> Firearm background checks per 1,000 residents, Jan-June 2022: 6.3 — the fewest
> Most common type of firearm check, Jan-June 2023: No data available
> 2022 population: 1.4 million — 11th smallest

2. Oregon
> Change in background checks, Jan-June to Jan-June 2023: +43.1% (+84,948 — the largest increase)
> Firearm background checks, Jan-June 2023: 282,164 — 12th most
> Firearm background checks, Jan-June 2022: 197,216 — 22nd most
> Firearm background checks per 1,000 residents, Jan-June 2023: 66.5 — the most
> Firearm background checks per 1,000 residents, Jan-June 2022: 46.5 — 12th most
> Most common type of firearm check, Jan-June 2023: Handguns
> 2022 population: 4.2 million — 24th smallest
[in-text-ad]

1. Maryland
> Change in background checks, Jan-June to Jan-June 2023: +63.0% (+70,680 — 2nd largest increase)
> Firearm background checks, Jan-June 2023: 182,870 — 21st most
> Firearm background checks, Jan-June 2022: 112,190 — 20th fewest
> Firearm background checks per 1,000 residents, Jan-June 2023: 29.7 — 17th fewest
> Firearm background checks per 1,000 residents, Jan-June 2022: 18.2 — 7th fewest
> Most common type of firearm check, Jan-June 2023: Handguns
> 2022 population: 6.2 million — 19th largest
Methodology:
To identify the states where gun sales are increasing fastest, 24/7 Wall St. used data from the FBI’s National Instant Criminal Background Check System. We included the 12 states that reported at least a 1% increase in adjusted firearm background checks between the first six months of 2022 and the same period in 2023. To reach a more accurate approximation of gun sales, we excluded checks for such categories as pawn shop transactions, returns, rentals, and rechecks (which are conducted periodically by some states on existing permit holders).
Even after removing some types of checks that are clearly unrelated to new firearm purchases, background checks still serve only as a rough approximation, because every state has different laws in terms of when background checks are required and different accounting practices.
The most glaring example of this is Illinois, which alone accounted for about half of the background checks in the country after excluding the aforementioned categories of checks. Illinois no longer breaks down background checks separately, but did so from July 2016 through July 2021. During the four full years of data, an average of 9.2% of Illinois’s non-private sale or gun-specific permit checks were non-rechecks. We applied that average to the most recent state figures to estimate Illinois’ count. This was done only because Illinois is such a glaring example of inconsistency and because there was historical data to produce an estimate.
There are likely other states for which the background check figures listed are inflated or underestimated proxies for gun sales.
Population data came from the U.S. Census Bureau’s Population and Housing Unit Estimates Program, and are for July of 2022, the most recent data available.
Contact [email protected] for any questions or corrections.