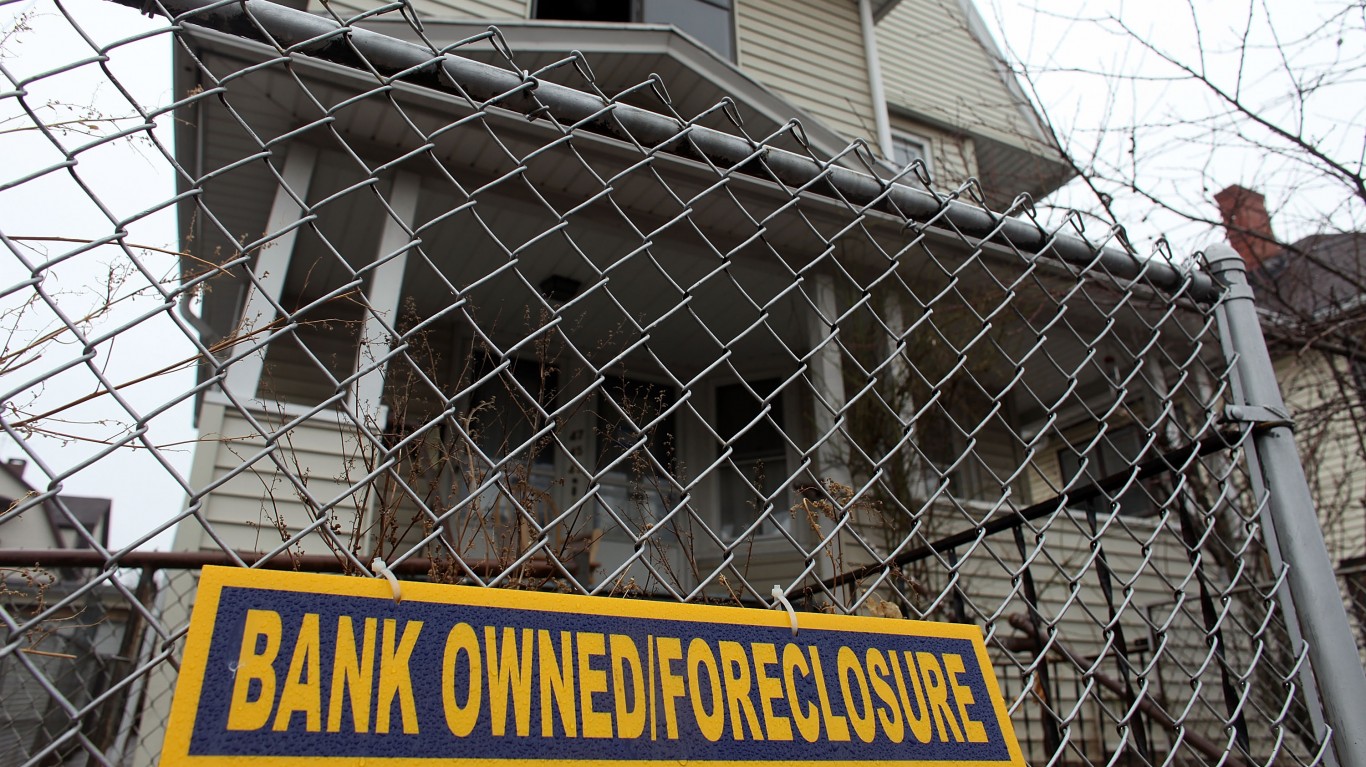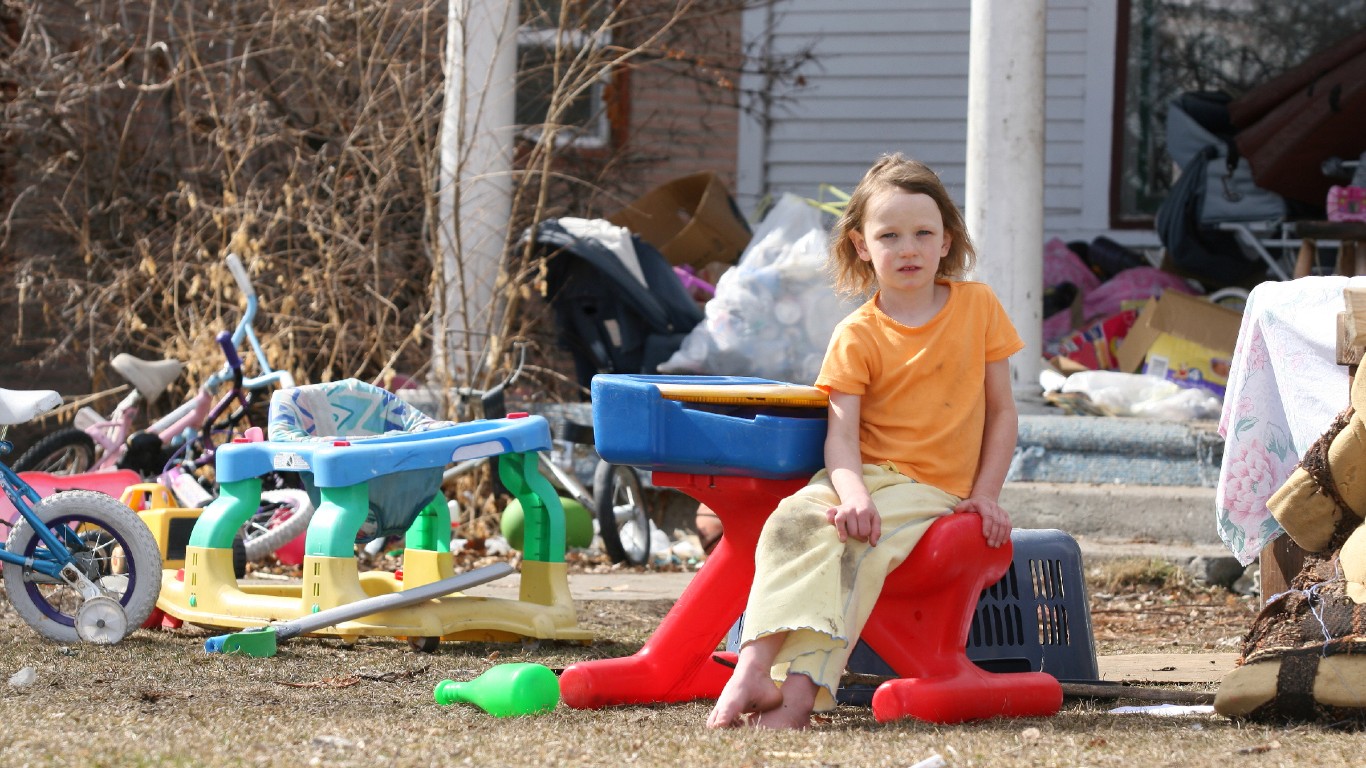
According to new data from the Census Bureau’s 2022 American Community Survey, the official U.S. poverty rate is 12.6%. While the overall rate of poverty may have stayed relatively unchanged in the past year, the share of Americans living below the poverty level in 2022 was nearly double that of 2021, which is the largest one-year increase of all time. This rise has not only reversed several years of historic progress but illustrates how the changing economy can negatively affect many Americans. There are currently more than 37 million people living in poverty.
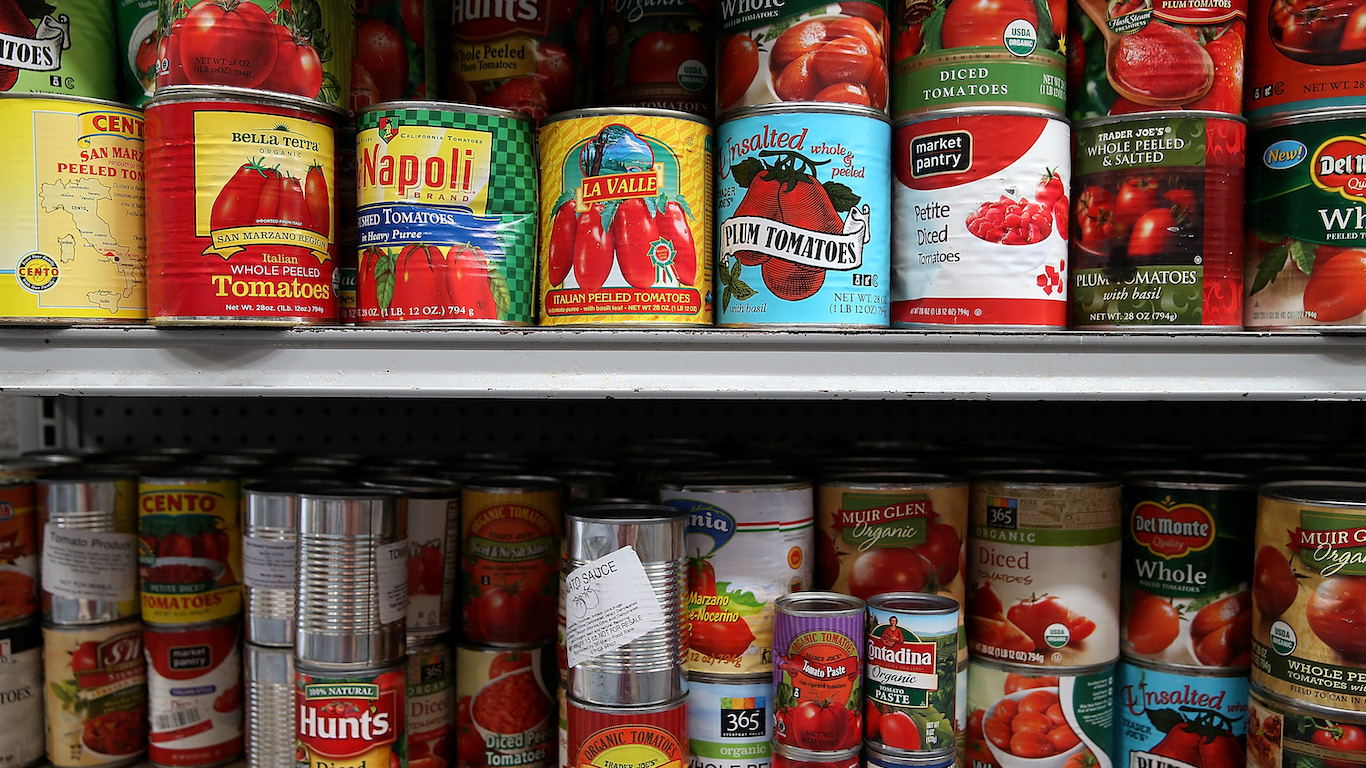
In some major cities, the share of the population living below the poverty line is far higher. Much of the increase in real poverty was due to the expiration of safety net programs created or expanded during the pandemic, such as unemployment and nutrition benefits, rental assistance, and an expanded child tax credit. (Here are 25 ways the federal poverty rate doesn’t tell the whole story.)
24/7 Wall St. reviewed one-year poverty status data from the recent ACS to determine the American cities with the highest poverty rates. Nearly 380 metropolitan statistical areas were ranked based on the percentage of the population for whom the poverty status was determined as falling below the poverty line.
The Sunbelt, which comprises 18 states, is the site of some of the fastest economic growth in the United States, but a bulk of the country’s poorest cities are in the South. Of the 50 metro areas with the highest poverty rates, 33 are in the South, while 11 are in the West, and five are in the Midwest. Binghamton, New York, stands out as the one metropolitan area in the Northeast with a poverty rate above 18.0%.
Chronic unemployment is a struggle for many of the poorest cities nationwide. Of the 50 cities with the highest poverty rates, 33 had average annual unemployment rates higher than 3.6% — the national figure in 2022. In the border city of El Centro, California, where 22.6% of residents live in poverty, seasonal fluctuations in demand for agricultural workers and a downturn in Mexican tourism activity have resulted in a nation-leading unemployment rate of 14.7%. (See also: people are leaving these 50 American cities in droves.)
Adding to the employment factor and low wages in U.S. cities with the highest poverty rates may be low educational attainment. While income and financial security tend to rise with college attainment, the percentage of adults with at least a bachelor’s degree is lower than the 35.7% national figure in 44 of the 50 cities with the highest poverty rates. In the Central Valley metro of Hanford-Corcoran, California, where 18.8% of the population lives in poverty, just 15.9% of adults have a bachelor’s degree, the fourth lowest college attainment rate of any metro nationwide.
Here are the U.S. cities with the highest poverty rates.
See below for our detailed methodology.
50. Bakersfield, CA
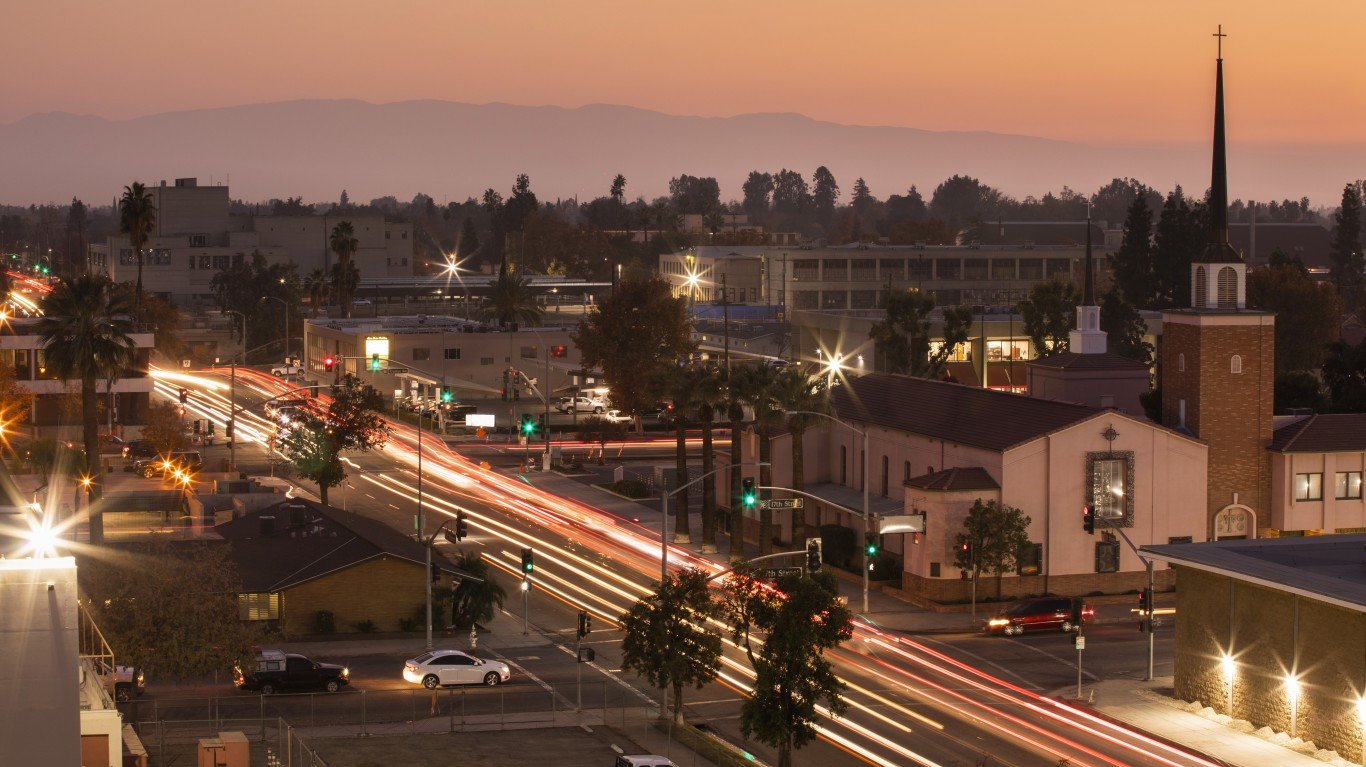
- Poverty rate: 17.9%
- Unemployment rate, 2022: 6.9%
- Households receiving SNAP benefits: 19.7%
- Median household income: $66,234
- Total population: 916,108
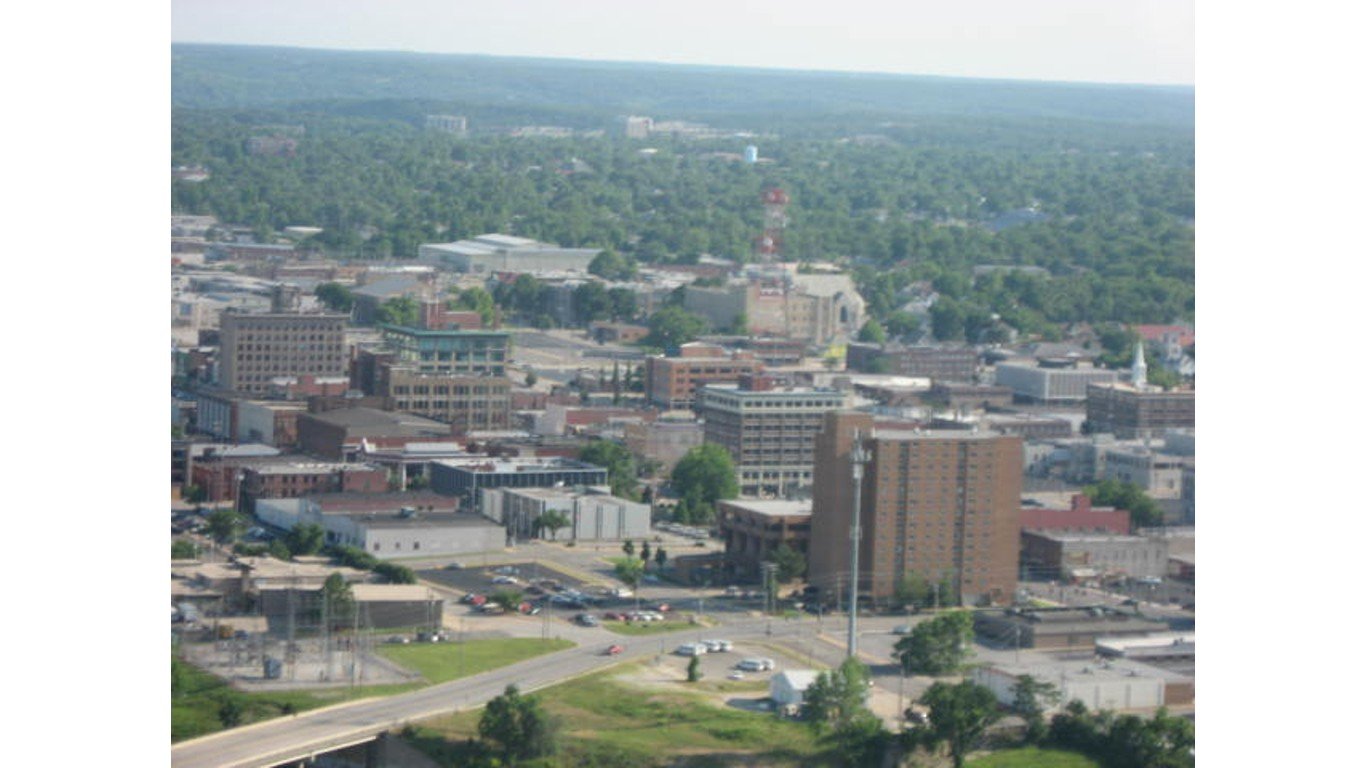
49. Hot Springs, AR

- Poverty rate: 17.9%
- Unemployment rate, 2022: 3.8%
- Households receiving SNAP benefits: 9.6%
- Median household income: $53,145
- Total population: 100,089
48. Jonesboro, AR

- Poverty rate: 17.9%
- Unemployment rate, 2022: 2.8%
- Households receiving SNAP benefits: 13.9%
- Median household income: $59,582
- Total population: 135,512
47. Gainesville, FL
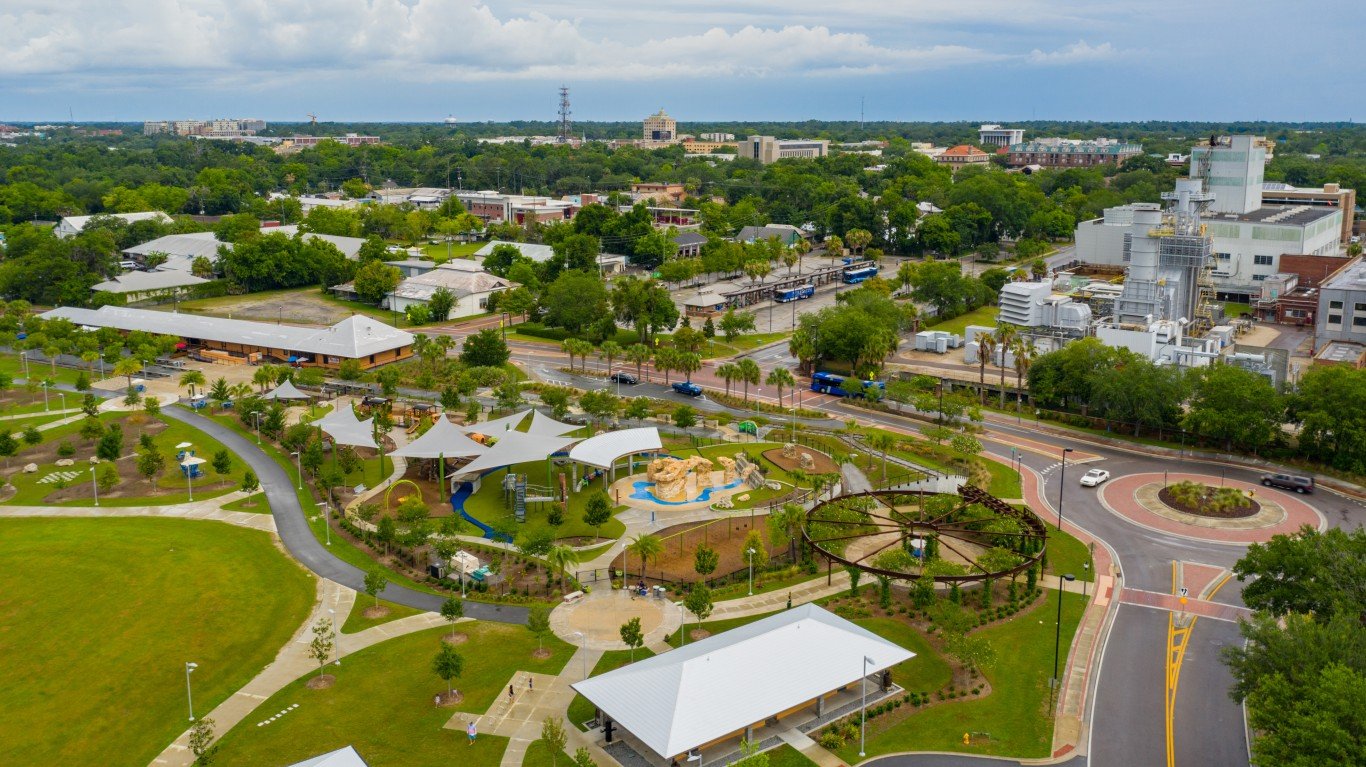
- Poverty rate: 18.0%
- Unemployment rate, 2022: 2.8%
- Households receiving SNAP benefits: 10.6%
- Median household income: $59,516
- Total population: 350,903
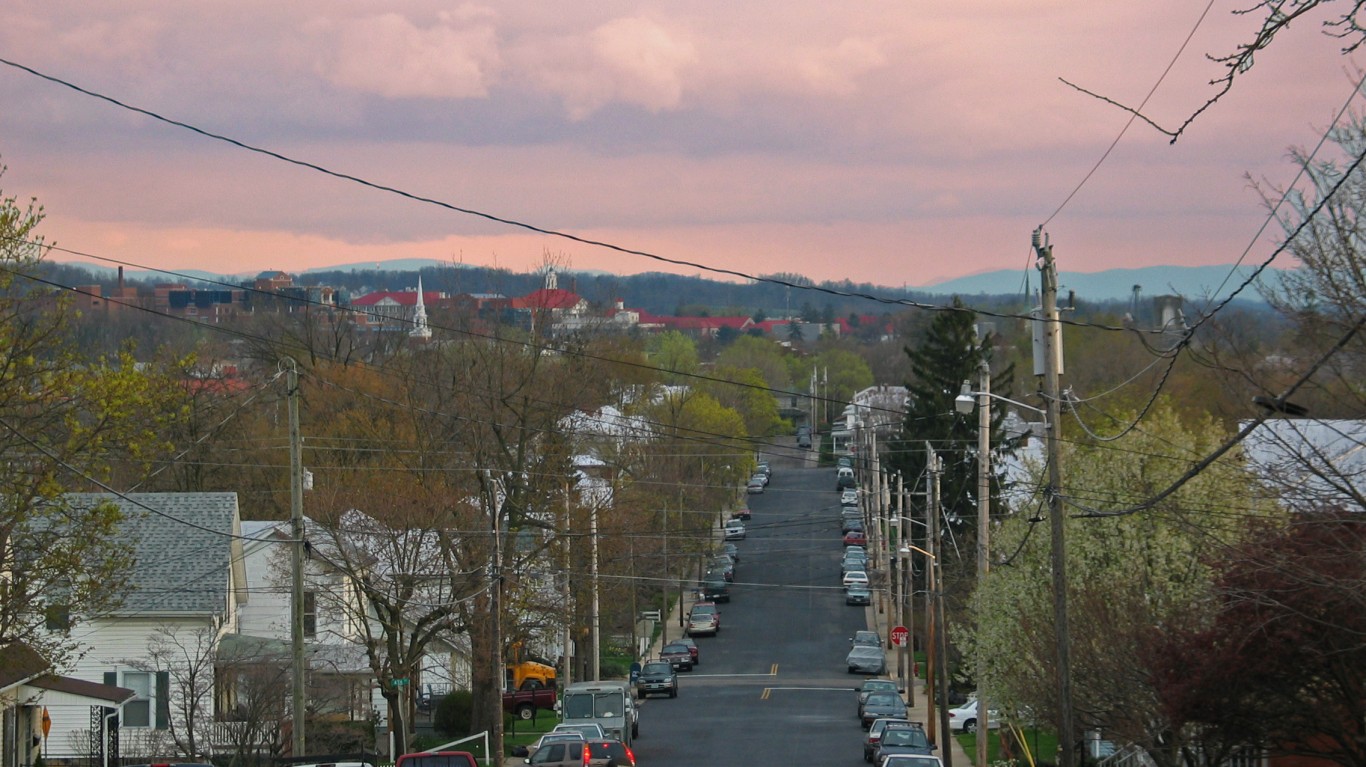
46. Morgantown, WV
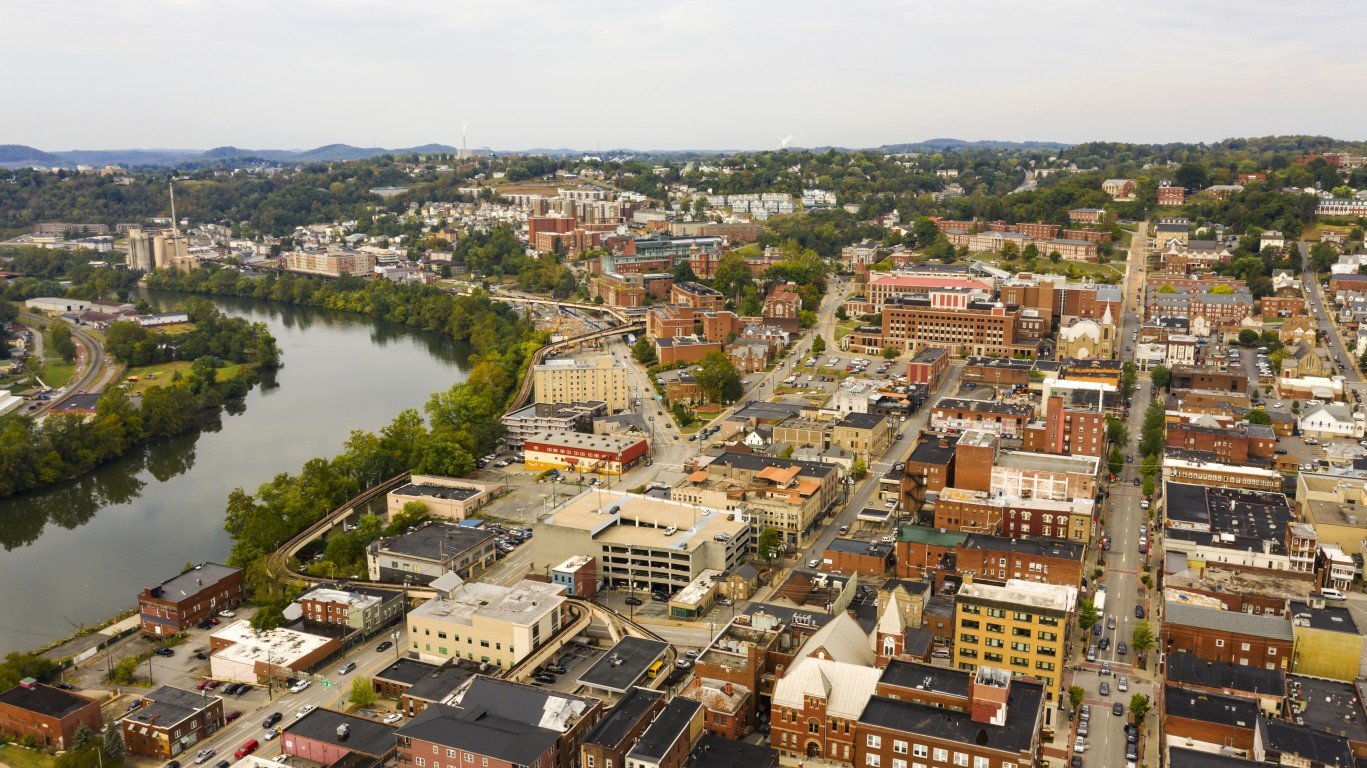
- Poverty rate: 18.2%
- Unemployment rate, 2022: 3.5%
- Households receiving SNAP benefits: 12.1%
- Median household income: $56,132
- Total population: 141,041
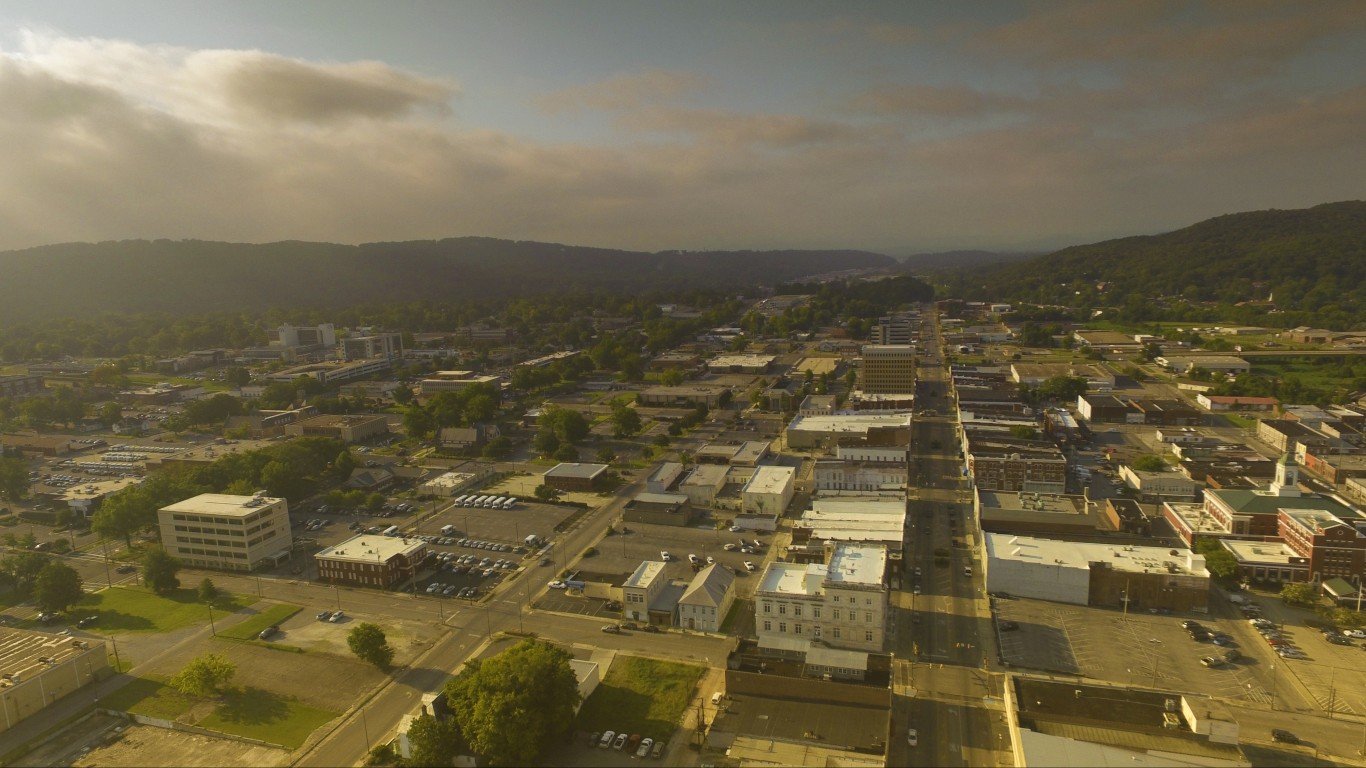
45. Fort Smith, AR-OK
- Poverty rate: 18.2%
- Unemployment rate, 2022: 3.3%
- Households receiving SNAP benefits: 15.9%
- Median household income: $49,980
- Total population: 246,751
44. Visalia, CA
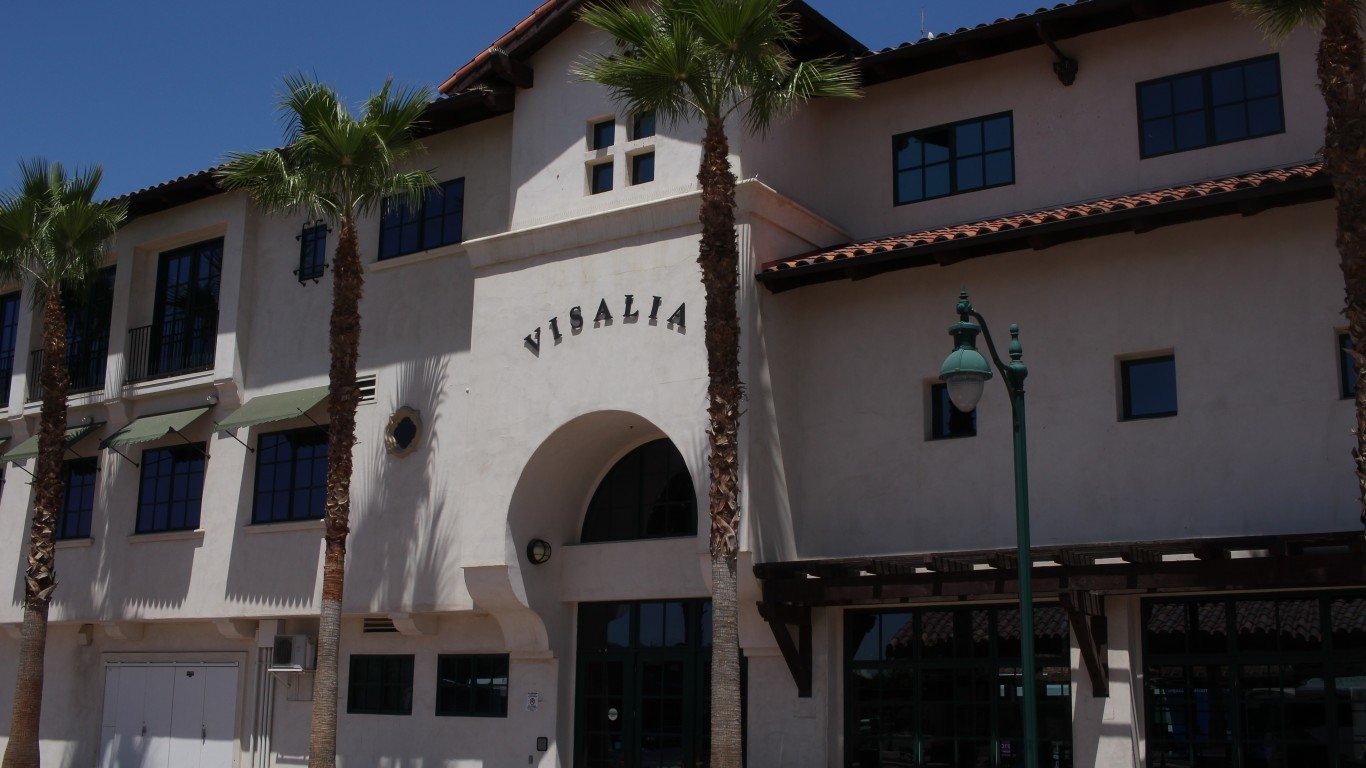
- Poverty rate: 18.2%
- Unemployment rate, 2022: 8.2%
- Households receiving SNAP benefits: 24.3%
- Median household income: $64,722
- Total population: 477,544
43. Joplin, MO
- Poverty rate: 18.3%
- Unemployment rate, 2022: 2.4%
- Households receiving SNAP benefits: 13.4%
- Median household income: $54,041
- Total population: 184,086
42. Anniston-Oxford, AL
- Poverty rate: 18.3%
- Unemployment rate, 2022: 3.0%
- Households receiving SNAP benefits: 18.3%
- Median household income: $52,819
- Total population: 115,788
41. Saginaw, MI
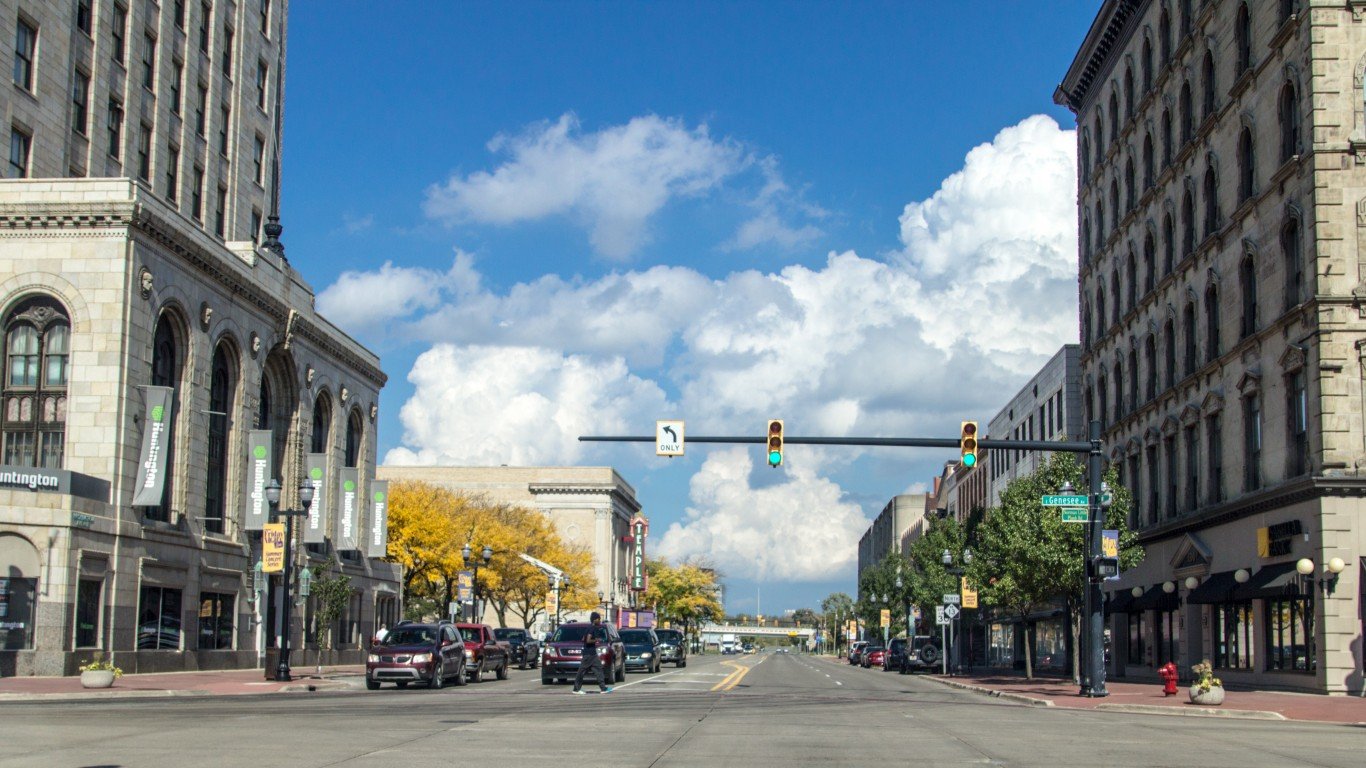
- Poverty rate: 18.4%
- Unemployment rate, 2022: 5.6%
- Households receiving SNAP benefits: 19.7%
- Median household income: $53,646
- Total population: 188,330
40. Lafayette-West Lafayette, IN

- Poverty rate: 18.4%
- Unemployment rate, 2022: 2.8%
- Households receiving SNAP benefits: 6.7%
- Median household income: $56,176
- Total population: 226,250
39. Columbus, GA-AL

- Poverty rate: 18.5%
- Unemployment rate, 2022: 3.6%
- Households receiving SNAP benefits: 16.9%
- Median household income: $54,106
- Total population: 324,416
38. Homosassa Springs, FL
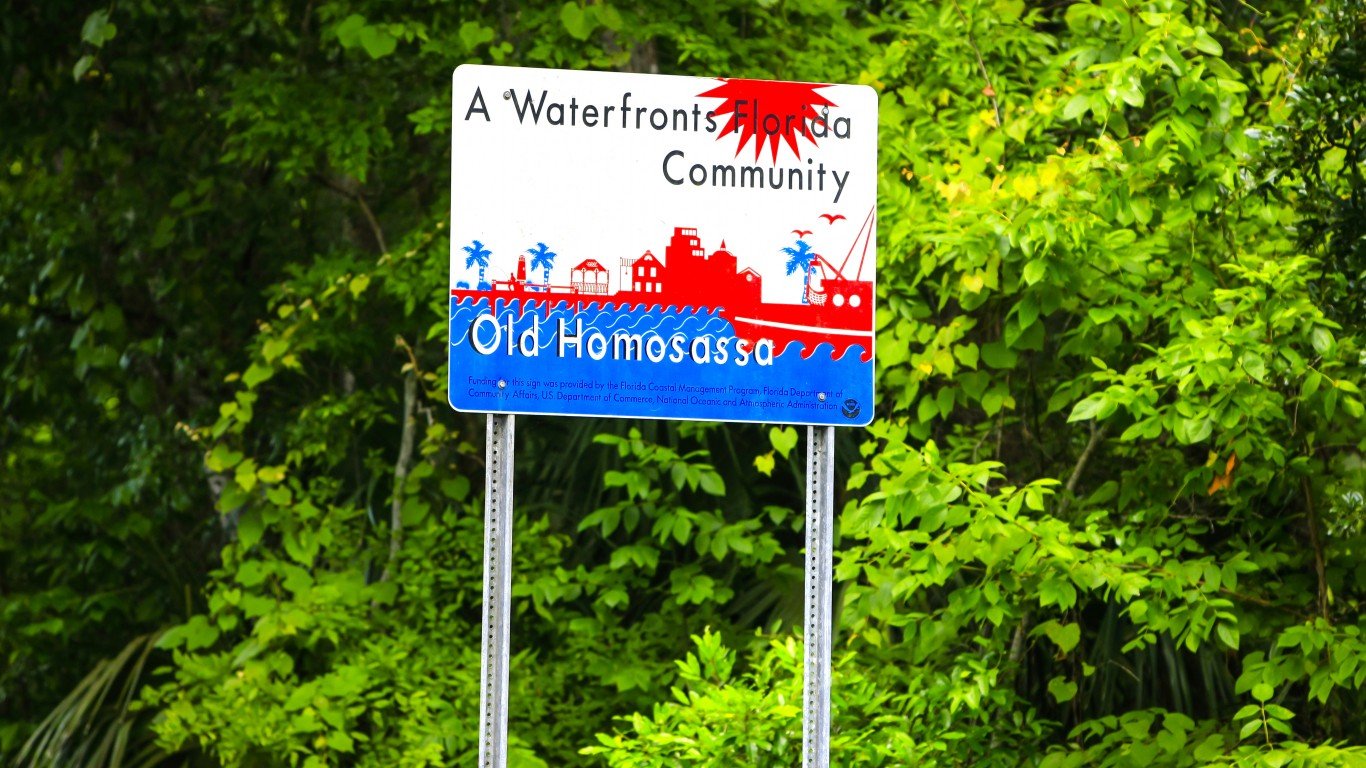
- Poverty rate: 18.5%
- Unemployment rate, 2022: 4.1%
- Households receiving SNAP benefits: 13.6%
- Median household income: $51,532
- Total population: 162,529
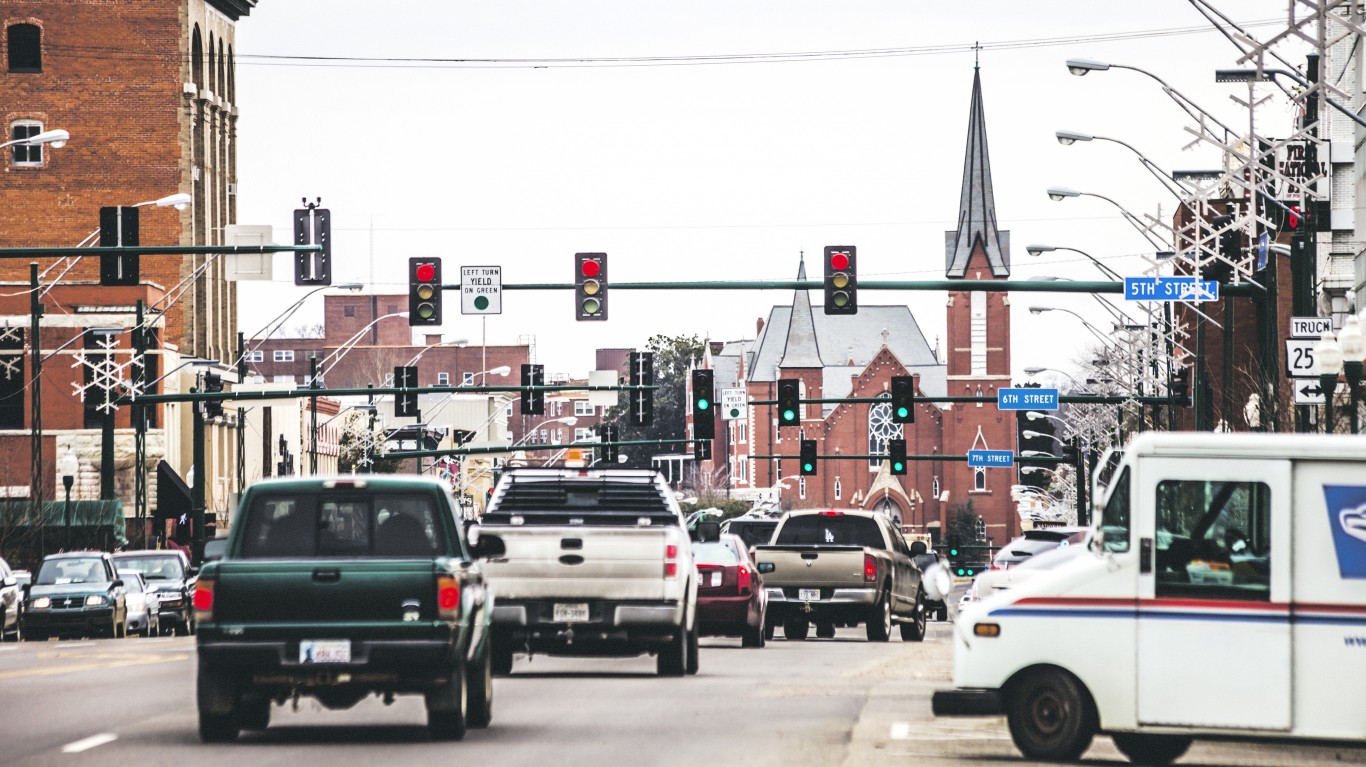
37. Bowling Green, KY

- Poverty rate: 18.5%
- Unemployment rate, 2022: 3.7%
- Households receiving SNAP benefits: 13.1%
- Median household income: $59,629
- Total population: 184,636
36. Binghamton, NY

- Poverty rate: 18.7%
- Unemployment rate, 2022: 3.7%
- Households receiving SNAP benefits: 12.9%
- Median household income: $63,427
- Total population: 244,889
35. Mobile, AL

- Poverty rate: 18.7%
- Unemployment rate, 2022: 3.2%
- Households receiving SNAP benefits: 17.2%
- Median household income: $54,313
- Total population: 428,780
34. Fresno, CA

- Poverty rate: 18.7%
- Unemployment rate, 2022: 6.4%
- Households receiving SNAP benefits: 22.7%
- Median household income: $69,571
- Total population: 1,015,190
33. Hanford-Corcoran, CA

- Poverty rate: 18.8%
- Unemployment rate, 2022: 7.0%
- Households receiving SNAP benefits: 18.9%
- Median household income: $64,368
- Total population: 152,981
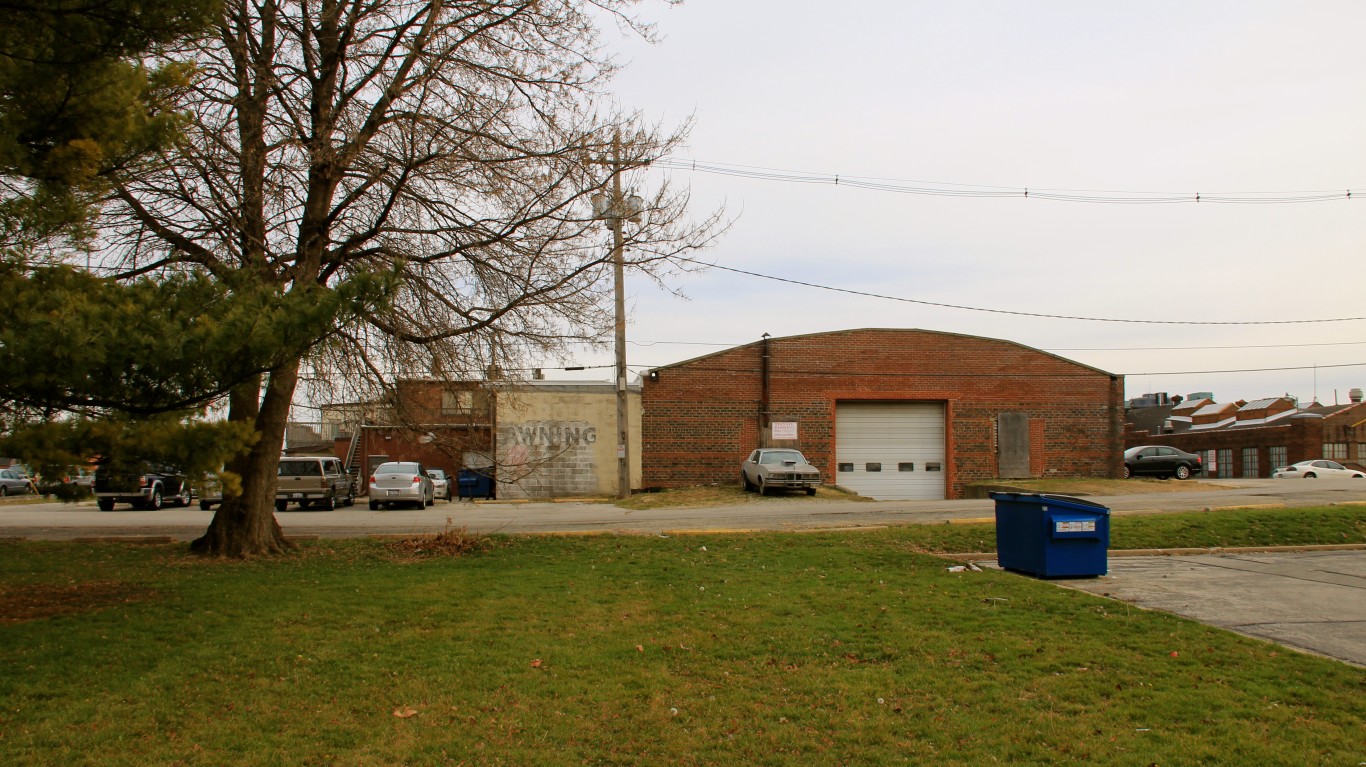
32. Muncie, IN

- Poverty rate: 18.8%
- Unemployment rate, 2022: 3.5%
- Households receiving SNAP benefits: 12.8%
- Median household income: $54,087
- Total population: 112,031
31. Chico, CA

- Poverty rate: 18.8%
- Unemployment rate, 2022: 4.5%
- Households receiving SNAP benefits: 14.1%
- Median household income: $64,426
- Total population: 207,303
30. Goldsboro, NC

- Poverty rate: 18.9%
- Unemployment rate, 2022: 4.0%
- Households receiving SNAP benefits: 26.1%
- Median household income: $55,588
- Total population: 117,286
29. Cumberland, MD-WV
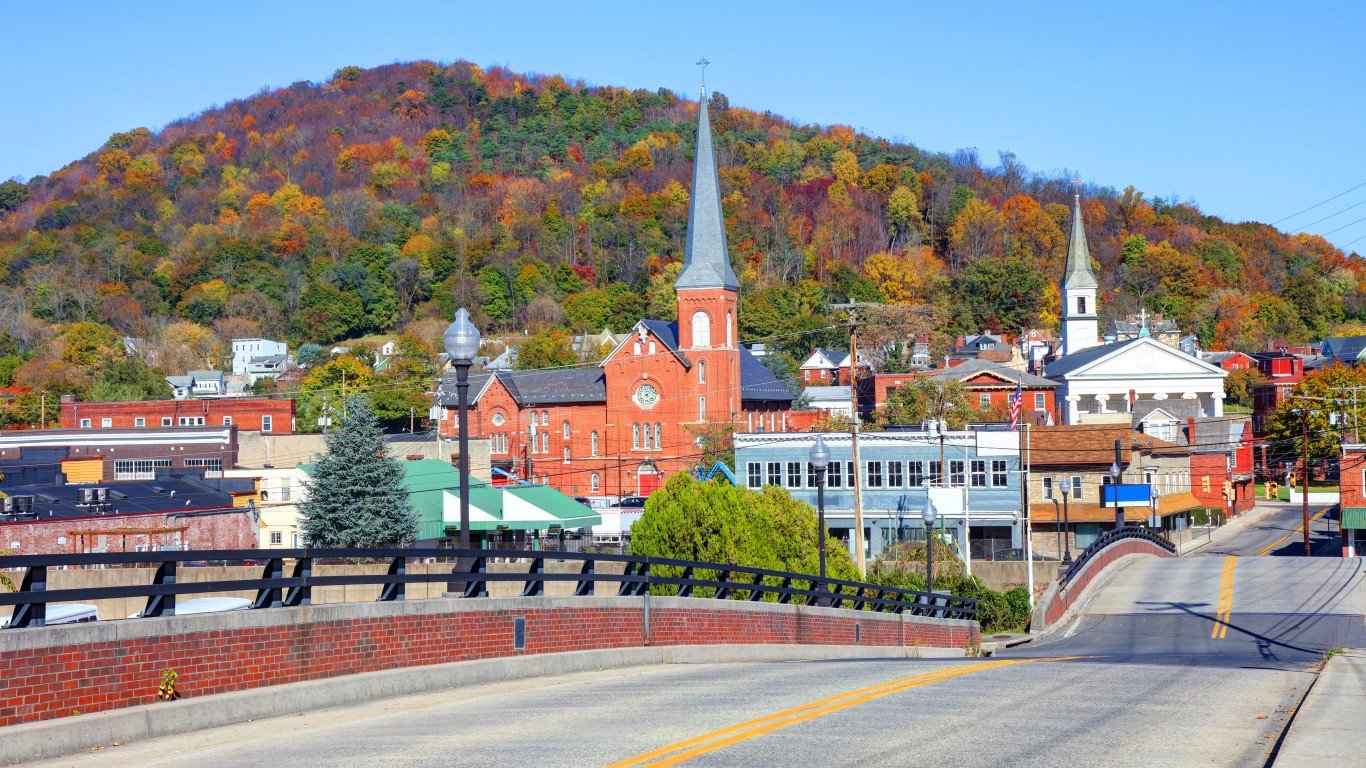
- Poverty rate: 18.9%
- Unemployment rate, 2022: 4.0%
- Households receiving SNAP benefits: 21.3%
- Median household income: $54,618
- Total population: 94,122
28. Grants Pass, OR
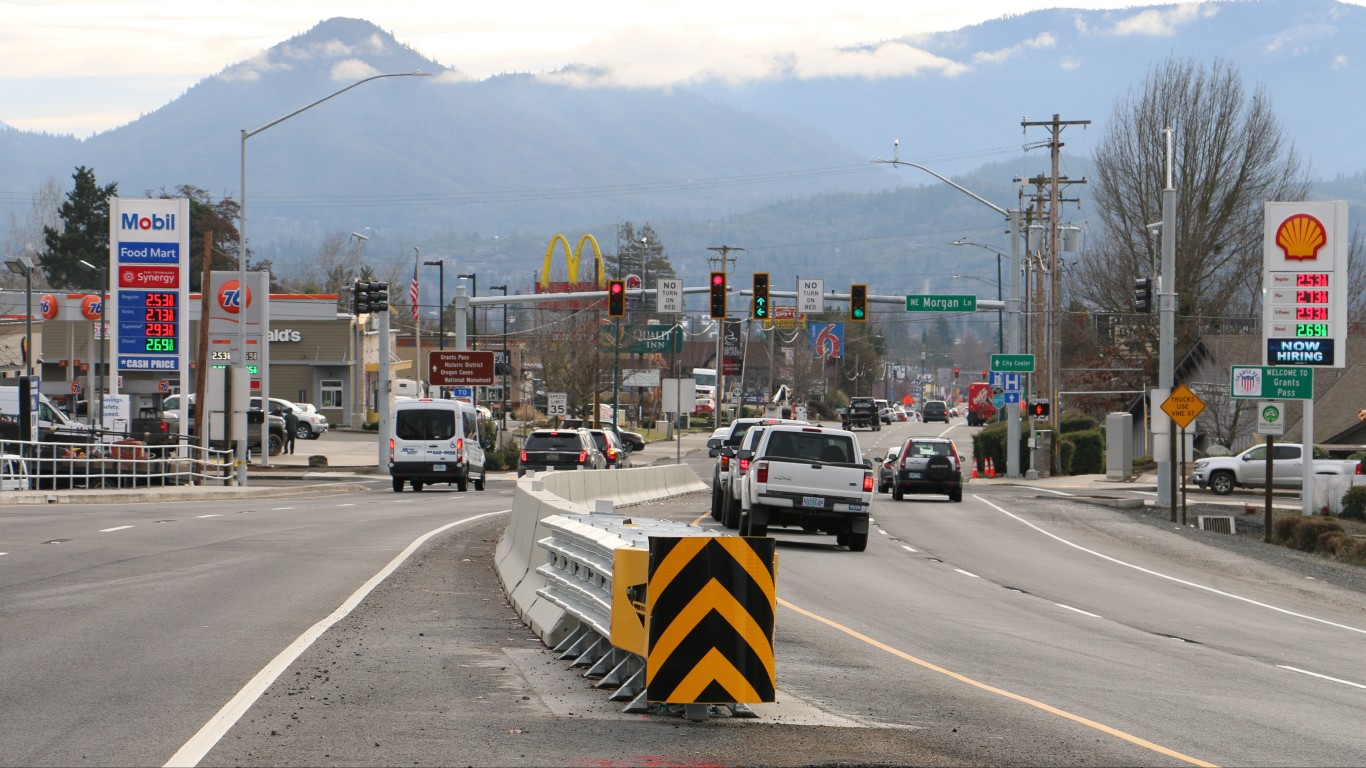
- Poverty rate: 19.0%
- Unemployment rate, 2022: 5.6%
- Households receiving SNAP benefits: 23.2%
- Median household income: $53,838
- Total population: 87,730
27. Harrisonburg, VA
- Poverty rate: 19.1%
- Unemployment rate, 2022: 2.9%
- Households receiving SNAP benefits: 9.3%
- Median household income: $64,993
- Total population: 136,555
26. Shreveport-Bossier City, LA

- Poverty rate: 19.1%
- Unemployment rate, 2022: 3.7%
- Households receiving SNAP benefits: 17.5%
- Median household income: $52,775
- Total population: 385,154
25. Champaign-Urbana, IL
- Poverty rate: 19.1%
- Unemployment rate, 2022: 3.7%
- Households receiving SNAP benefits: 10.1%
- Median household income: $62,108
- Total population: 223,265
24. Merced, CA

- Poverty rate: 19.3%
- Unemployment rate, 2022: 7.7%
- Households receiving SNAP benefits: 20.2%
- Median household income: $66,164
- Total population: 290,014
23. Hammond, LA
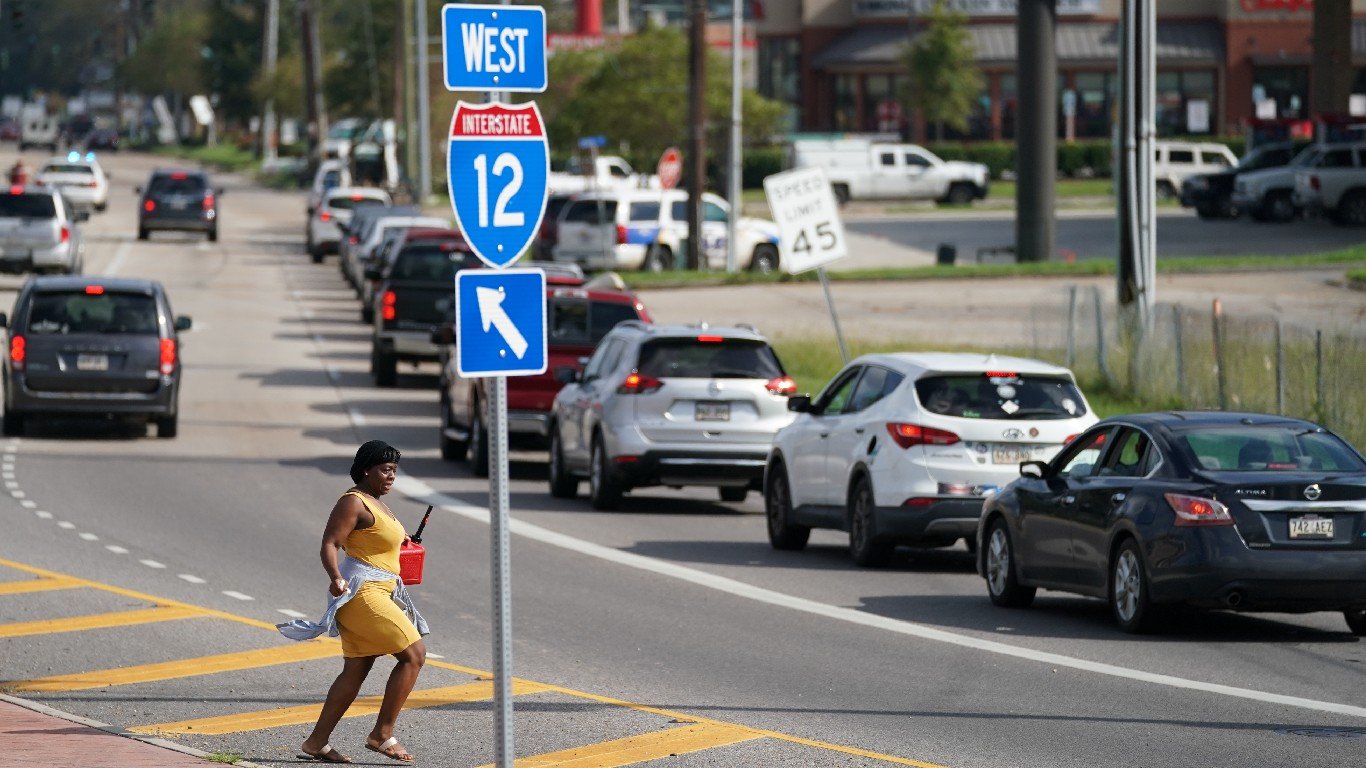
- Poverty rate: 19.4%
- Unemployment rate, 2022: 4.3%
- Households receiving SNAP benefits: 24.4%
- Median household income: $55,391
- Total population: 137,048
22. Pine Bluff, AR

- Poverty rate: 19.5%
- Unemployment rate, 2022: 5.0%
- Households receiving SNAP benefits: 13.6%
- Median household income: $44,263
- Total population: 84,460
21. Tallahassee, FL

- Poverty rate: 19.6%
- Unemployment rate, 2022: 3.0%
- Households receiving SNAP benefits: 12.3%
- Median household income: $58,018
- Total population: 391,680
20. Charleston, WV

- Poverty rate: 19.7%
- Unemployment rate, 2022: 3.9%
- Households receiving SNAP benefits: 19.0%
- Median household income: $53,157
- Total population: 250,554
19. Beckley, WV

- Poverty rate: 19.8%
- Unemployment rate, 2022: 4.0%
- Households receiving SNAP benefits: 20.8%
- Median household income: $52,633
- Total population: 112,369
18. Hattiesburg, MS

- Poverty rate: 20.0%
- Unemployment rate, 2022: 3.5%
- Households receiving SNAP benefits: 14.8%
- Median household income: $54,560
- Total population: 172,263
17. Laredo, TX
- Poverty rate: 20.1%
- Unemployment rate, 2022: 4.1%
- Households receiving SNAP benefits: 25.2%
- Median household income: $59,603
- Total population: 267,780
16. Macon-Bibb County, GA
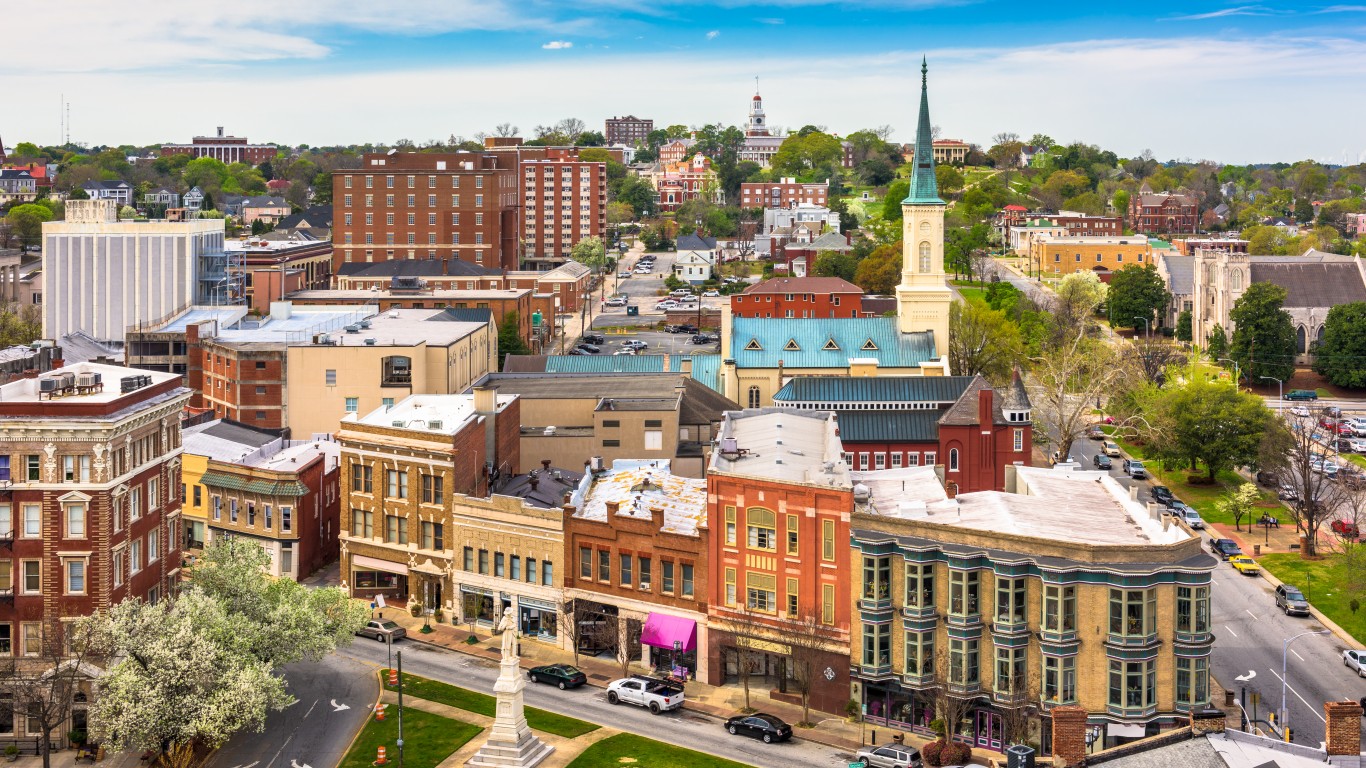
- Poverty rate: 20.1%
- Unemployment rate, 2022: 3.5%
- Households receiving SNAP benefits: 19.9%
- Median household income: $52,574
- Total population: 235,805
15. Greenville, NC

- Poverty rate: 20.1%
- Unemployment rate, 2022: 4.1%
- Households receiving SNAP benefits: 13.2%
- Median household income: $57,049
- Total population: 173,542
14. Lafayette, LA
- Poverty rate: 20.2%
- Unemployment rate, 2022: 3.4%
- Households receiving SNAP benefits: 19.0%
- Median household income: $50,837
- Total population: 481,125
13. Athens-Clarke County, GA

- Poverty rate: 20.6%
- Unemployment rate, 2022: 3.0%
- Households receiving SNAP benefits: 11.2%
- Median household income: $61,978
- Total population: 220,191
12. Parkersburg-Vienna, WV

- Poverty rate: 20.8%
- Unemployment rate, 2022: 4.2%
- Households receiving SNAP benefits: 17.5%
- Median household income: $55,222
- Total population: 89,559
11. Florence, SC
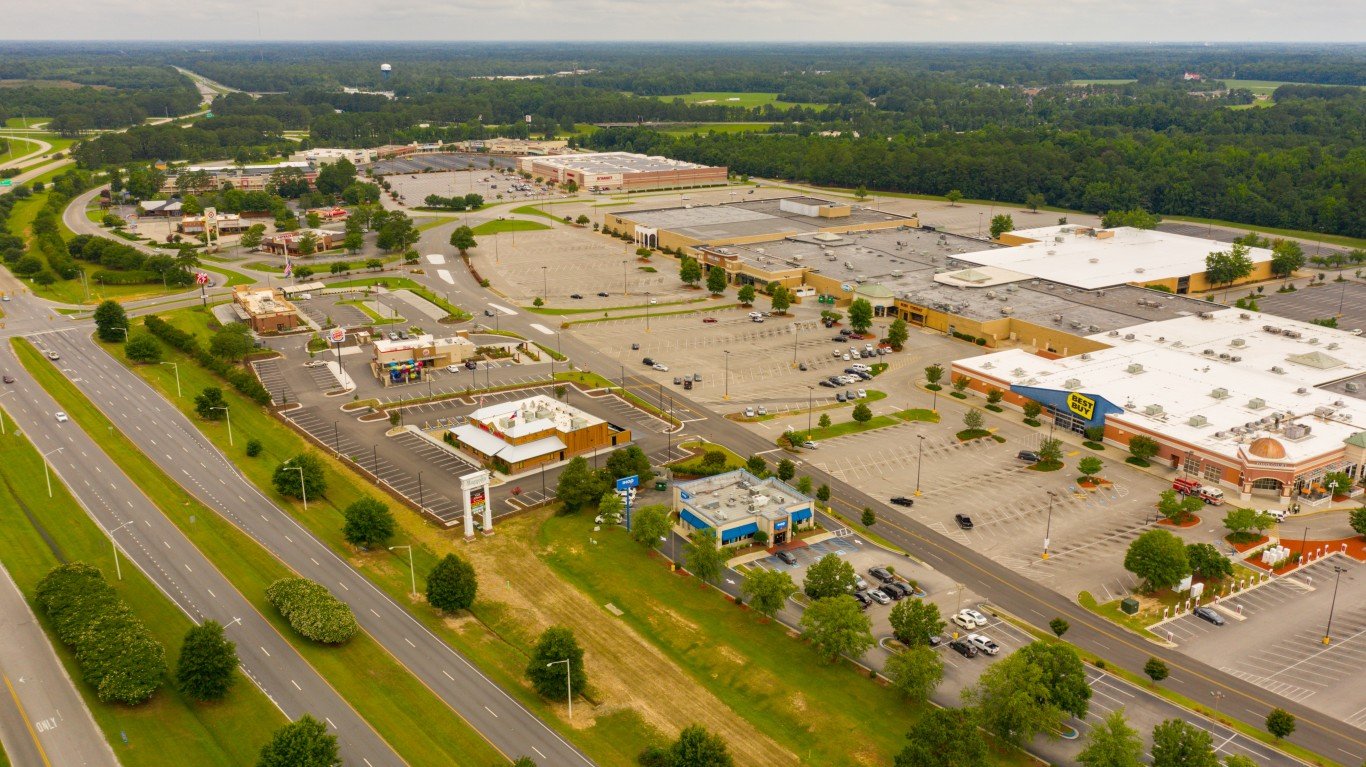
- Poverty rate: 21.1%
- Unemployment rate, 2022: 3.3%
- Households receiving SNAP benefits: 18.6%
- Median household income: $50,219
- Total population: 199,119
10. El Paso, TX

- Poverty rate: 21.3%
- Unemployment rate, 2022: 4.3%
- Households receiving SNAP benefits: 21.1%
- Median household income: $53,359
- Total population: 871,323
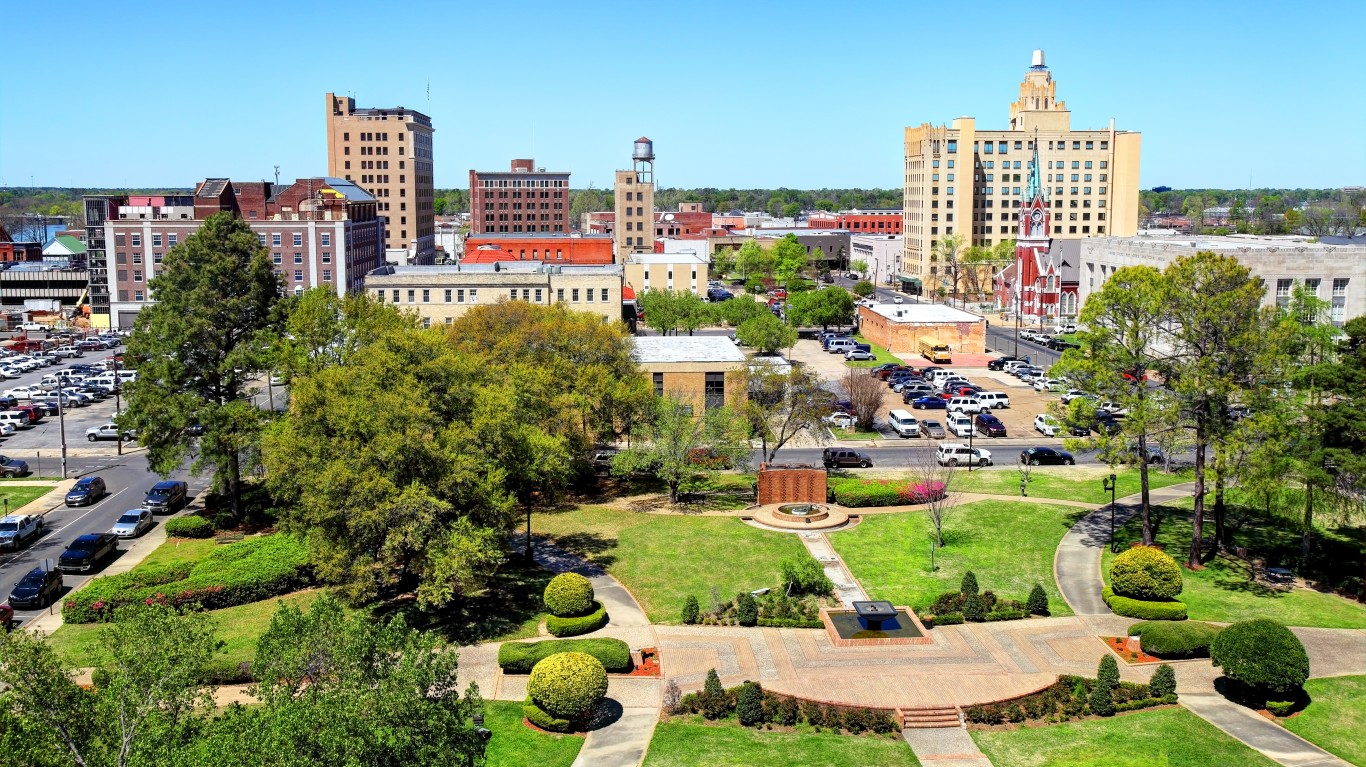
9. Texarkana, TX-AR
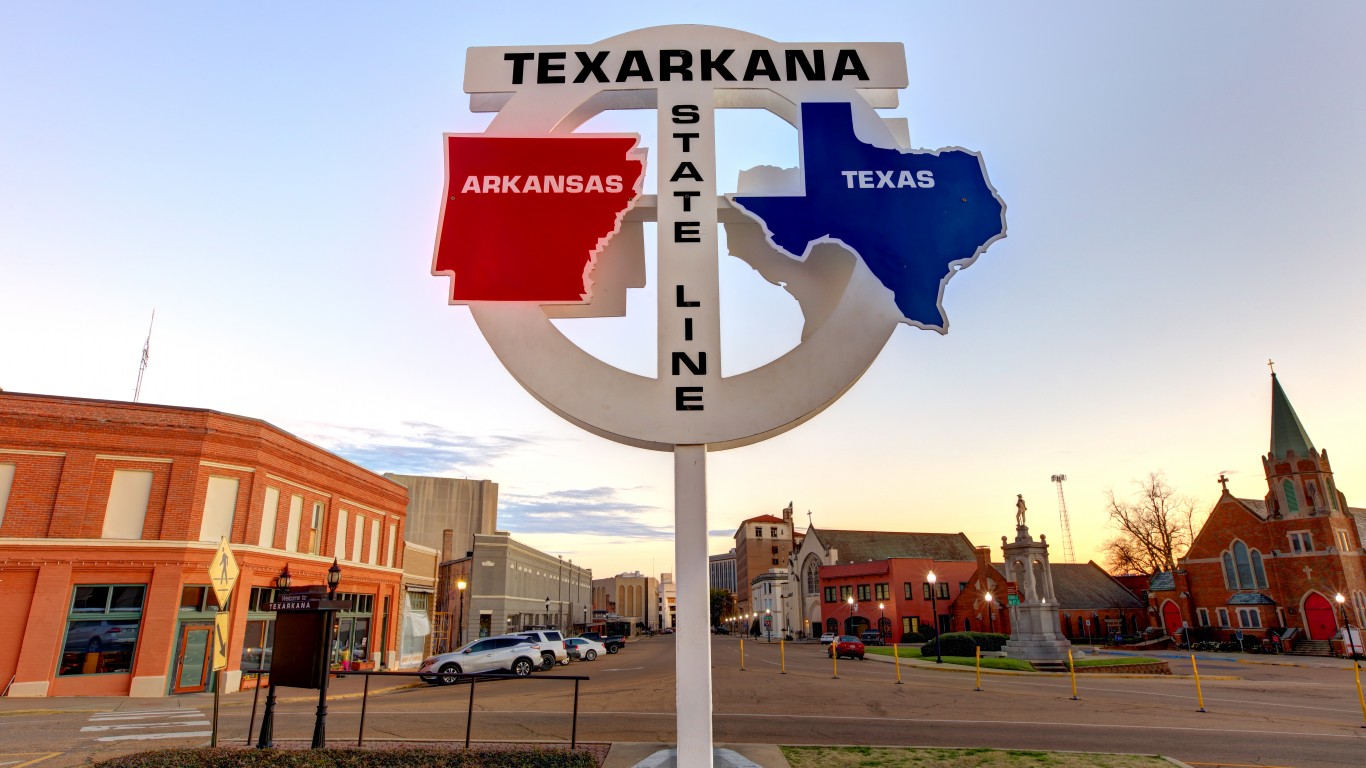
- Poverty rate: 21.6%
- Unemployment rate, 2022: 4.3%
- Households receiving SNAP benefits: 17.6%
- Median household income: $48,230
- Total population: 144,322
8. Brownsville-Harlingen, TX
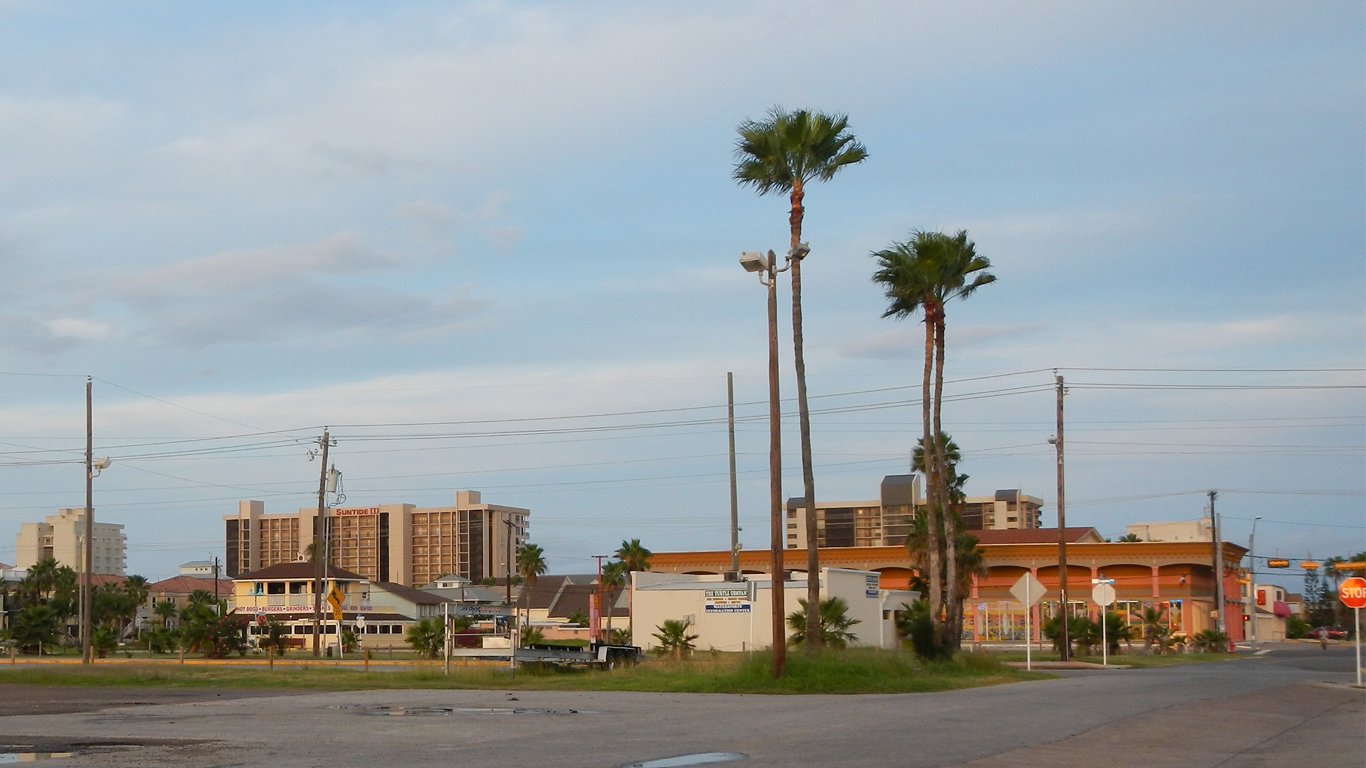
- Poverty rate: 22.3%
- Unemployment rate, 2022: 5.7%
- Households receiving SNAP benefits: 26.4%
- Median household income: $50,649
- Total population: 425,208
7. El Centro, CA
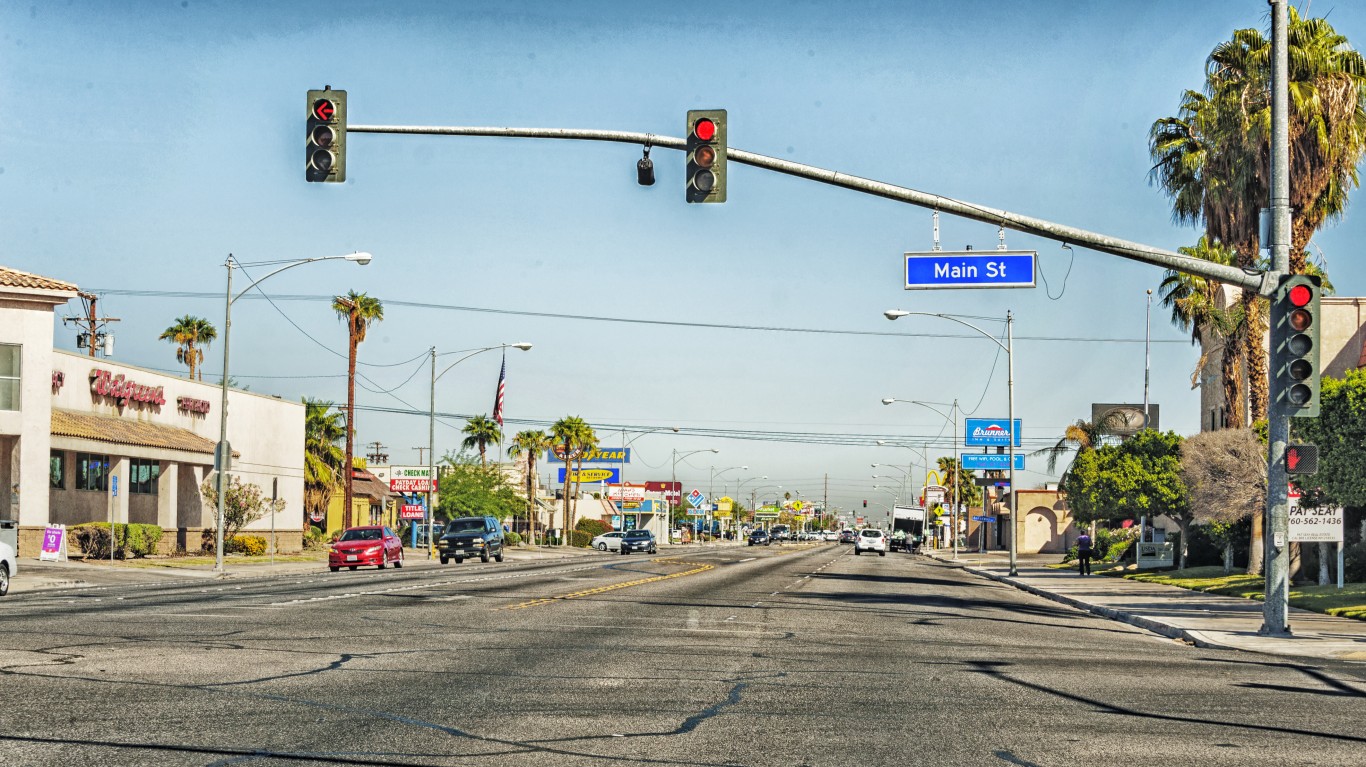
- Poverty rate: 22.6%
- Unemployment rate, 2022: 14.7%
- Households receiving SNAP benefits: 28.2%
- Median household income: $57,310
- Total population: 178,713
6. Farmington, NM
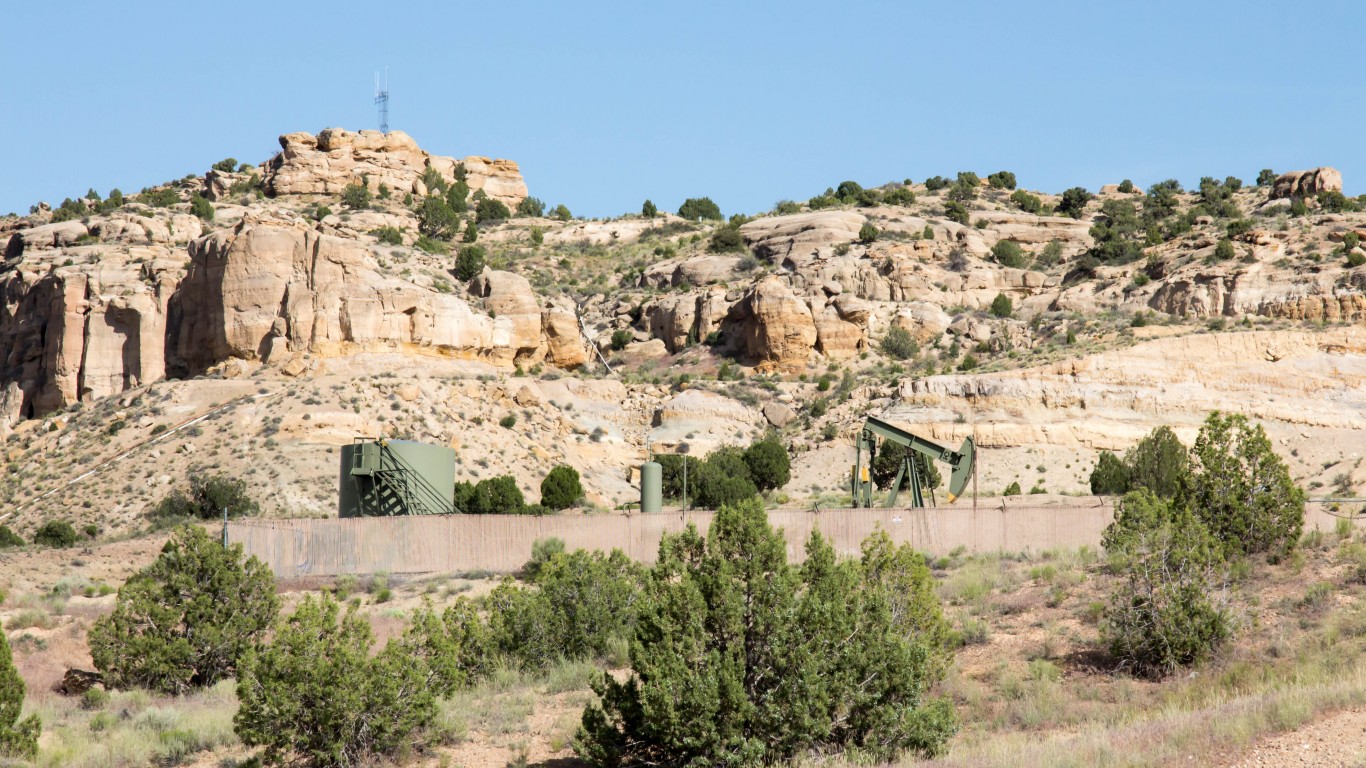
- Poverty rate: 24.1%
- Unemployment rate, 2022: 4.6%
- Households receiving SNAP benefits: 22.0%
- Median household income: $50,264
- Total population: 120,418
5. Madera, CA
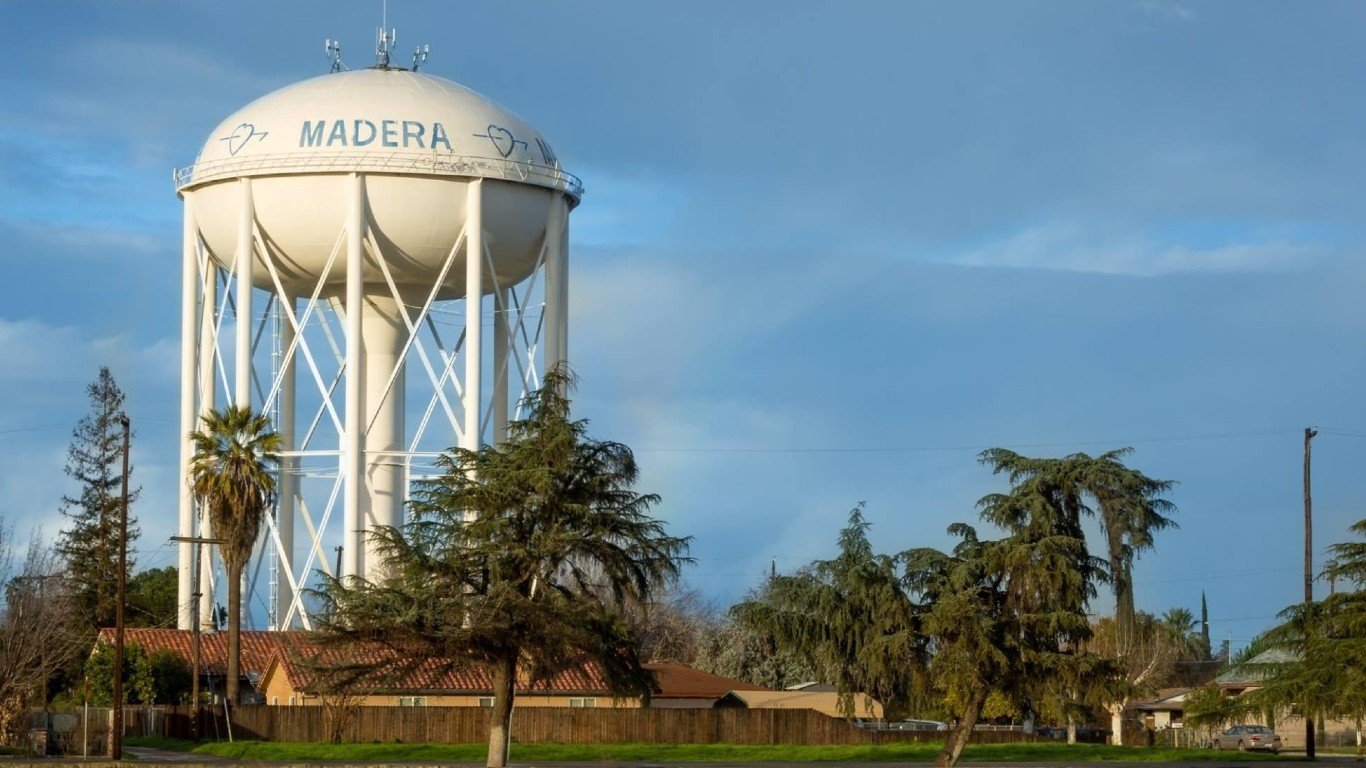
- Poverty rate: 24.3%
- Unemployment rate, 2022: 6.1%
- Households receiving SNAP benefits: 21.7%
- Median household income: $76,920
- Total population: 160,256
4. Las Cruces, NM
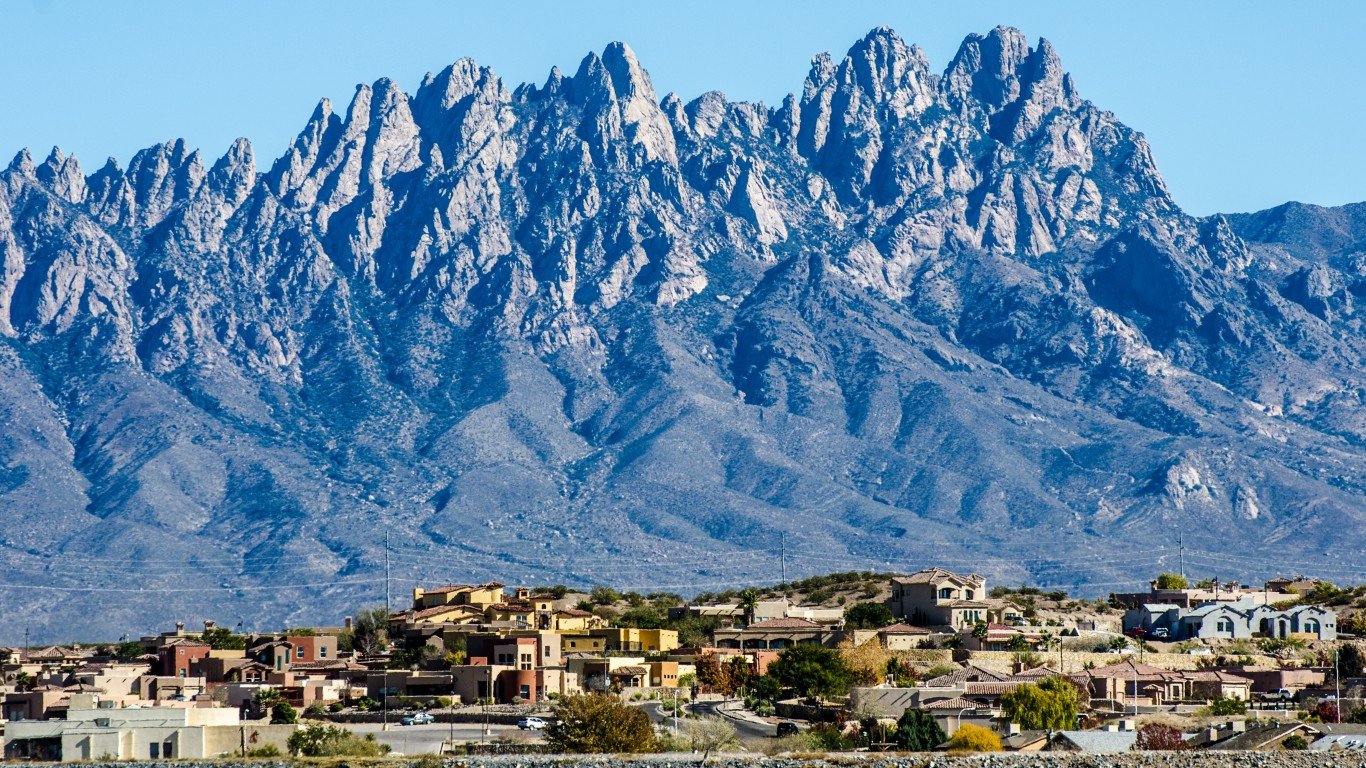
- Poverty rate: 24.5%
- Unemployment rate, 2022: 4.4%
- Households receiving SNAP benefits: 26.6%
- Median household income: $51,967
- Total population: 223,337
3. Monroe, LA
- Poverty rate: 24.9%
- Unemployment rate, 2022: 3.7%
- Households receiving SNAP benefits: 22.1%
- Median household income: $44,507
- Total population: 202,869
2. Albany, GA
- Poverty rate: 26.2%
- Unemployment rate, 2022: 3.8%
- Households receiving SNAP benefits: 27.5%
- Median household income: $48,376
- Total population: 146,387
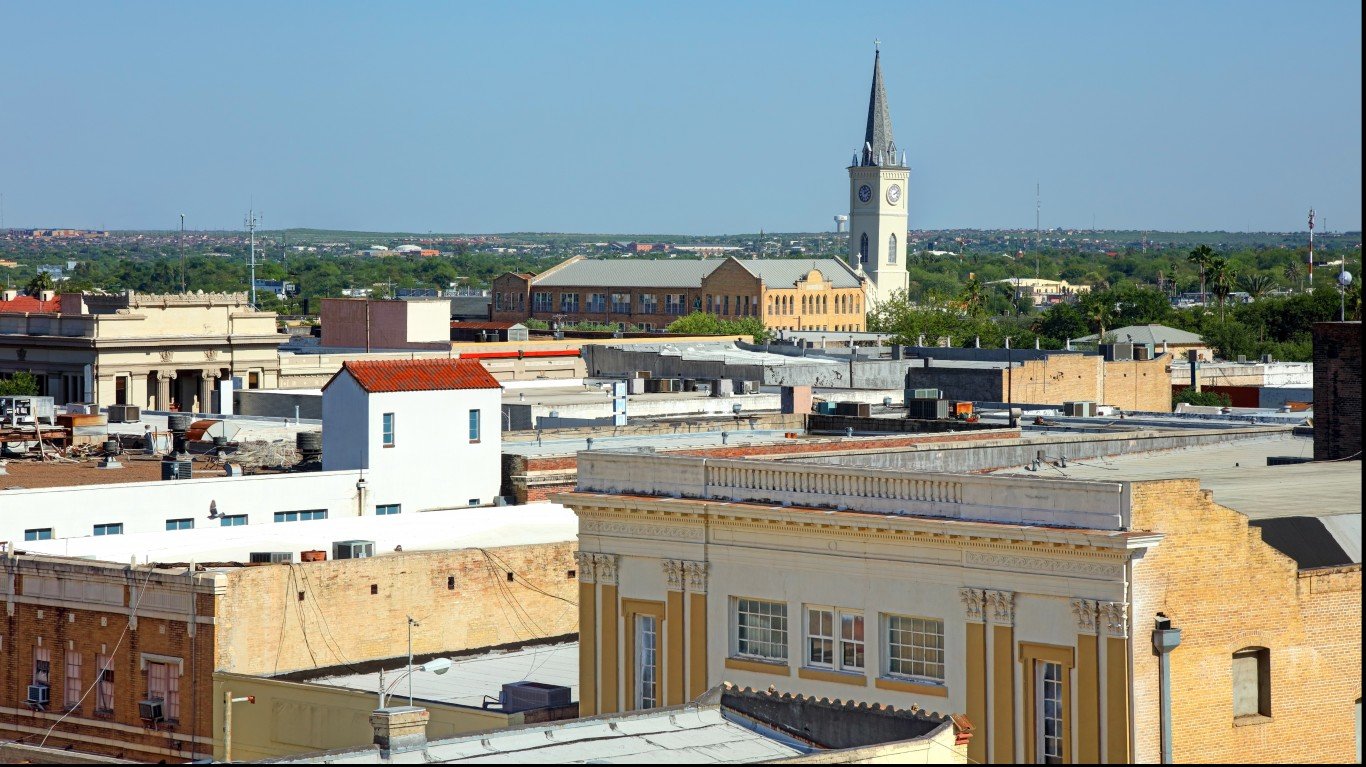
1. McAllen-Edinburg-Mission, TX
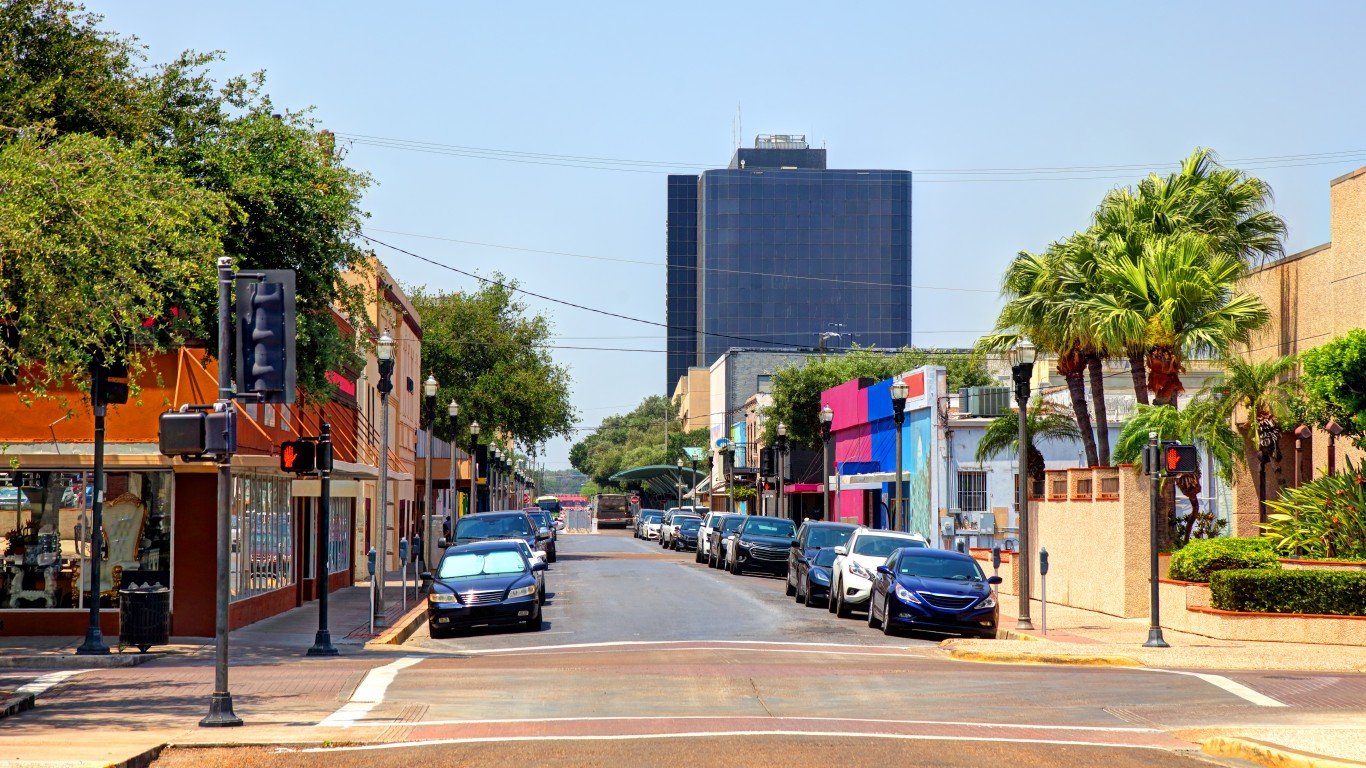
- Poverty rate: 27.6%
- Unemployment rate, 2022: 6.5%
- Households receiving SNAP benefits: 29.5%
- Median household income: $49,142
- Total population: 888,367
Methodology
24/7 Wall St. reviewed one-year data on poverty status from the U.S. Census Bureau’s 2022 American Community Survey to determine the American cities with the highest poverty rates. Metropolitan statistical areas (377) were ranked based on the percentage of the population for whom poverty status is determined that falls below the poverty line.
Supplemental data on the percentage of households receiving food stamps or SNAP benefits, median household income, and total population also came from the 2022 ACS. Data on annual average unemployment in 2022 came from the Bureau of Labor Statistics Local Area Unemployment Statistics program. Cities where 20% or more of the population is enrolled in college or graduate school were excluded.
Contact [email protected] for any questions or corrections.