
Geographic mobility is at a historic low in the United States. Only 8.7% of the population moved to a new home in 2022, the second smallest share since record keeping began in 1948, and only slightly higher than the all-time low of 8.4% reported in 2021.
And while over half of all movers in 2022 relocated to another place in the same county, there are parts of the country that Americans are leaving behind entirely. Moreover, they are leaving at much faster rates than average.
Using metro area-level data from the U.S. Census Bureau’s Population Estimates Program, 24/7 Wall St. identified the cities losing the most people. Metro areas were ranked based on the percentage change in population due to net migration from July 1, 2021 to June 30, 2022. Data was aggregated from the county level to the metropolitan level using MSA definitions for July 2023 from the Census Bureau.
Among the 50 metro areas on this list, the group of people who moved out between July 2021 and June 2022 outnumbers those who moved in by anywhere from about 350 to nearly 222,900. In some cases, this amounted to a population decline of over 2% – not factoring in population change from births or deaths.
Notably, in each of these 50 metro areas, outbound migration was offset by an influx of international migrants. In nearly a dozen cities on this list, net migration from abroad contributed to an influx of well over 1,000 new residents. Without these new arrivals, population declines would have been far more pronounced. (Here is a look at the best U.S. cities for immigrants, according to data.)
Regionally, these metro areas are spread across the country. However, many of them are clustered within a single state. California, for example, is home to 10 metro areas on this list, New York is home to eight, and Louisiana, six.
These cities include many of the largest – and most expensive – places in the country. Cities like Chicago, New York, Los Angeles, and San Francisco, have each lost about 1% or more of their population in the last year due to migration alone. (Here is a look at the 23 cities with the most expensive rent in America.)
Click here to see the cities people are leaving in droves.

Source: fotoguy22 / iStock via Getty Images
50. Springfield, IL
> Pop. change due to net migration, 2021 to 2022: -0.4% (-897)
> Net domestic migration, 2021 to 2022: -1,185
> Net international migration, 2021 to 2022: +288
> Total population, 2022: 206,655
[in-text-ad]

Source: leightrail / iStock Editorial via Getty Images
49. Champaign-Urbana, IL
> Pop. change due to net migration, 2021 to 2022: -0.4% (-1,029)
> Net domestic migration, 2021 to 2022: -2,939
> Net international migration, 2021 to 2022: +1,910
> Total population, 2022: 236,514
 24/7 Wall St.
Source: DenisTangneyJr / iStock via Getty Images
48. Grand Forks, ND-MN
> Pop. change due to net migration, 2021 to 2022: -0.4% (-450)
> Net domestic migration, 2021 to 2022: -652
> Net international migration, 2021 to 2022: +202
> Total population, 2022: 103,144
Source: DenisTangneyJr / E+ via Getty Images
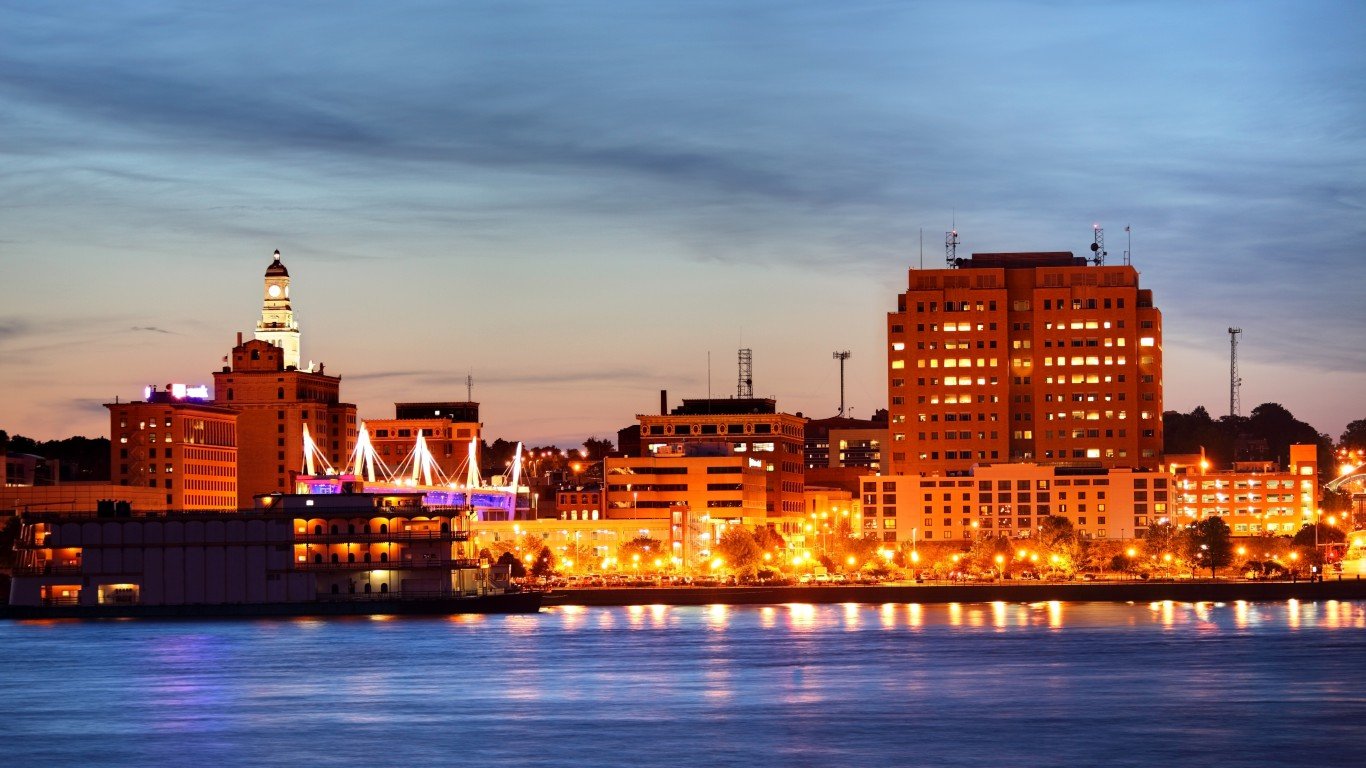
47. Davenport-Moline-Rock Island, IA-IL
> Pop. change due to net migration, 2021 to 2022: -0.4% (-1,677)
> Net domestic migration, 2021 to 2022: -2,225
> Net international migration, 2021 to 2022: +548
> Total population, 2022: 379,374
[in-text-ad-2]

Source: bluejayphoto / iStock via Getty Images
46. Hanford-Corcoran, CA
> Pop. change due to net migration, 2021 to 2022: -0.4% (-674)
> Net domestic migration, 2021 to 2022: -780
> Net international migration, 2021 to 2022: +106
> Total population, 2022: 152,981

Source: DenisTangneyJr / iStock via Getty Images
45. Rochester, NY
> Pop. change due to net migration, 2021 to 2022: -0.4% (-4,703)
> Net domestic migration, 2021 to 2022: -6,882
> Net international migration, 2021 to 2022: +2,179
> Total population, 2022: 1,056,701
[in-text-ad]

Source: jetcityimage / iStock Editorial via Getty Images
44. Lima, OH
> Pop. change due to net migration, 2021 to 2022: -0.5% (-460)
> Net domestic migration, 2021 to 2022: -521
> Net international migration, 2021 to 2022: +61
> Total population, 2022: 101,115
 24/7 Wall St.
Source: ghornephoto / iStock via Getty Images
43. Peoria, IL
> Pop. change due to net migration, 2021 to 2022: -0.5% (-1,656)
> Net domestic migration, 2021 to 2022: -2,246
> Net international migration, 2021 to 2022: +590
> Total population, 2022: 363,445

42. Charleston, WV
> Pop. change due to net migration, 2021 to 2022: -0.5% (-939)
> Net domestic migration, 2021 to 2022: -1,175
> Net international migration, 2021 to 2022: +236
> Total population, 2022: 204,297
[in-text-ad-2]

Source: eddygaleotti / iStock Editorial via Getty Images
41. Kahului-Wailuku, HI
> Pop. change due to net migration, 2021 to 2022: -0.5% (-750)
> Net domestic migration, 2021 to 2022: -1,308
> Net international migration, 2021 to 2022: +558
> Total population, 2022: 164,433

40. Elkhart-Goshen, IN
> Pop. change due to net migration, 2021 to 2022: -0.5% (-953)
> Net domestic migration, 2021 to 2022: -1,320
> Net international migration, 2021 to 2022: +367
> Total population, 2022: 206,890
[in-text-ad]

Source: Ultima_Gaina / iStock via Getty Images
39. Vineland, NJ
> Pop. change due to net migration, 2021 to 2022: -0.5% (-727)
> Net domestic migration, 2021 to 2022: -995
> Net international migration, 2021 to 2022: +268
> Total population, 2022: 151,356

Source: ChrisBoswell / iStock via Getty Images
38. Binghamton, NY
> Pop. change due to net migration, 2021 to 2022: -0.5% (-1,265)
> Net domestic migration, 2021 to 2022: -1,749
> Net international migration, 2021 to 2022: +484
> Total population, 2022: 244,889

Source: OlegAlbinsky / iStock Unreleased via Getty Images
37. Kingston, NY
> Pop. change due to net migration, 2021 to 2022: -0.5% (-956)
> Net domestic migration, 2021 to 2022: -1,180
> Net international migration, 2021 to 2022: +224
> Total population, 2022: 182,319
[in-text-ad-2]

Source: DebraMillet / iStock via Getty Images
36. Syracuse, NY
> Pop. change due to net migration, 2021 to 2022: -0.6% (-3,800)
> Net domestic migration, 2021 to 2022: -5,252
> Net international migration, 2021 to 2022: +1,452
> Total population, 2022: 653,633

Source: ChrisBoswell / iStock via Getty Images
35. Trenton-Princeton, NJ
> Pop. change due to net migration, 2021 to 2022: -0.6% (-2,283)
> Net domestic migration, 2021 to 2022: -4,374
> Net international migration, 2021 to 2022: +2,091
> Total population, 2022: 380,688
[in-text-ad]

34. Eagle Pass, TX
> Pop. change due to net migration, 2021 to 2022: -0.6% (-346)
> Net domestic migration, 2021 to 2022: -543
> Net international migration, 2021 to 2022: +197
> Total population, 2022: 57,843
 24/7 Wall St.
Source: BackyardProduction / iStock via Getty Images
33. Vallejo, CA
> Pop. change due to net migration, 2021 to 2022: -0.6% (-2,714)
> Net domestic migration, 2021 to 2022: -3,593
> Net international migration, 2021 to 2022: +879
> Total population, 2022: 448,747

Source: makasana / iStock via Getty Images
32. Sumter, SC
> Pop. change due to net migration, 2021 to 2022: -0.6% (-664)
> Net domestic migration, 2021 to 2022: -758
> Net international migration, 2021 to 2022: +94
> Total population, 2022: 104,012
[in-text-ad-2]

Source: DenisTangneyJr / iStock Unreleased via Getty Images
31. Modesto, CA
> Pop. change due to net migration, 2021 to 2022: -0.6% (-3,501)
> Net domestic migration, 2021 to 2022: -4,386
> Net international migration, 2021 to 2022: +885
> Total population, 2022: 551,275

Source: CRobertson / iStock Editorial via Getty Images
30. Jackson, MS
> Pop. change due to net migration, 2021 to 2022: -0.6% (-3,907)
> Net domestic migration, 2021 to 2022: -4,319
> Net international migration, 2021 to 2022: +412
> Total population, 2022: 610,904
[in-text-ad]

Source: DenisTangneyJr / iStock via Getty Images
29. Fayetteville, NC
> Pop. change due to net migration, 2021 to 2022: -0.6% (-2,506)
> Net domestic migration, 2021 to 2022: -3,492
> Net international migration, 2021 to 2022: +986
> Total population, 2022: 390,486
 24/7 Wall St.
Source: jmoor17 / iStock Unreleased via Getty Images
28. El Centro, CA
> Pop. change due to net migration, 2021 to 2022: -0.7% (-1,196)
> Net domestic migration, 2021 to 2022: -1,431
> Net international migration, 2021 to 2022: +235
> Total population, 2022: 178,713

Source: DenisTangneyJr / iStock via Getty Images
27. Odessa, TX
> Pop. change due to net migration, 2021 to 2022: -0.7% (-1,120)
> Net domestic migration, 2021 to 2022: -2,025
> Net international migration, 2021 to 2022: +905
> Total population, 2022: 160,869
[in-text-ad-2]

Source: DenisTangneyJr / iStock via Getty Images
26. Monroe, LA
> Pop. change due to net migration, 2021 to 2022: -0.7% (-1,663)
> Net domestic migration, 2021 to 2022: -1,829
> Net international migration, 2021 to 2022: +166
> Total population, 2022: 222,695

Source: BOB WESTON / iStock via Getty Images
25. St. Joseph, MO-KS
> Pop. change due to net migration, 2021 to 2022: -0.7% (-901)
> Net domestic migration, 2021 to 2022: -1,017
> Net international migration, 2021 to 2022: +116
> Total population, 2022: 119,690
[in-text-ad]

Source: SeanPavonePhoto / iStock via Getty Images
24. Columbus, GA-AL
> Pop. change due to net migration, 2021 to 2022: -0.8% (-2,602)
> Net domestic migration, 2021 to 2022: -3,188
> Net international migration, 2021 to 2022: +586
> Total population, 2022: 324,110

Source: Grant Wylie / iStock via Getty Images
23. Medford, OR
> Pop. change due to net migration, 2021 to 2022: -0.8% (-1,789)
> Net domestic migration, 2021 to 2022: -1,822
> Net international migration, 2021 to 2022: +33
> Total population, 2022: 221,644

Source: DenisTangneyJr / iStock via Getty Images
22. Laredo, TX
> Pop. change due to net migration, 2021 to 2022: -0.8% (-2,201)
> Net domestic migration, 2021 to 2022: -3,156
> Net international migration, 2021 to 2022: +955
> Total population, 2022: 267,780
[in-text-ad-2]

Source: lippyjr / iStock Editorial via Getty Images
21. Fairbanks-College, AK
> Pop. change due to net migration, 2021 to 2022: -0.8% (-791)
> Net domestic migration, 2021 to 2022: -919
> Net international migration, 2021 to 2022: +128
> Total population, 2022: 95,356

Source: DenisTangneyJr / E+ via Getty Images
20. Shreveport-Bossier City, LA
> Pop. change due to net migration, 2021 to 2022: -0.9% (-3,583)
> Net domestic migration, 2021 to 2022: -3,906
> Net international migration, 2021 to 2022: +323
> Total population, 2022: 385,154
[in-text-ad]

Source: benkrut / iStock via Getty Images
19. Decatur, IL
> Pop. change due to net migration, 2021 to 2022: -1.0% (-982)
> Net domestic migration, 2021 to 2022: -1,113
> Net international migration, 2021 to 2022: +131
> Total population, 2022: 101,483

Source: lhongfoto / iStock Unreleased via Getty Images
18. Chicago-Naperville-Elgin, IL-IN
> Pop. change due to net migration, 2021 to 2022: -1.0% (-90,426)
> Net domestic migration, 2021 to 2022: -116,964
> Net international migration, 2021 to 2022: +26,538
> Total population, 2022: 9,274,140

Source: Ryan Herron / E+ via Getty Images
17. Los Angeles-Long Beach-Anaheim, CA
> Pop. change due to net migration, 2021 to 2022: -1.0% (-125,592)
> Net domestic migration, 2021 to 2022: -170,450
> Net international migration, 2021 to 2022: +44,858
> Total population, 2022: 12,872,322
[in-text-ad-2]

Source: DenisTangneyJr / iStock via Getty Images
16. Alexandria, LA
> Pop. change due to net migration, 2021 to 2022: -1.0% (-1,513)
> Net domestic migration, 2021 to 2022: -1,623
> Net international migration, 2021 to 2022: +110
> Total population, 2022: 149,189

Source: benedek / iStock via Getty Images
15. Oxnard-Thousand Oaks-Ventura, CA
> Pop. change due to net migration, 2021 to 2022: -1.0% (-8,640)
> Net domestic migration, 2021 to 2022: -9,419
> Net international migration, 2021 to 2022: +779
> Total population, 2022: 832,605
[in-text-ad]

Source: Allison Tackette / iStock via Getty Images
14. Urban Honolulu, HI
> Pop. change due to net migration, 2021 to 2022: -1.1% (-11,095)
> Net domestic migration, 2021 to 2022: -15,236
> Net international migration, 2021 to 2022: +4,141
> Total population, 2022: 995,638
 24/7 Wall St.
Source: rarrarorro / iStock via Getty Images
13. San Francisco-Oakland-Fremont, CA
> Pop. change due to net migration, 2021 to 2022: -1.1% (-51,617)
> Net domestic migration, 2021 to 2022: -79,139
> Net international migration, 2021 to 2022: +27,522
> Total population, 2022: 4,579,599

Source: Eloi_Omella / E+ via Getty Images
12. New York-Newark-Jersey City, NY-NJ
> Pop. change due to net migration, 2021 to 2022: -1.1% (-222,850)
> Net domestic migration, 2021 to 2022: -322,497
> Net international migration, 2021 to 2022: +99,647
> Total population, 2022: 19,557,311
[in-text-ad-2]

Source: DenisTangneyJr / iStock via Getty Images
11. San Jose-Sunnyvale-Santa Clara, CA
> Pop. change due to net migration, 2021 to 2022: -1.2% (-24,380)
> Net domestic migration, 2021 to 2022: -42,762
> Net international migration, 2021 to 2022: +18,382
> Total population, 2022: 1,938,524

Source: benedek / iStock Unreleased via Getty Images
10. Ithaca, NY
> Pop. change due to net migration, 2021 to 2022: -1.3% (-1,328)
> Net domestic migration, 2021 to 2022: -1,829
> Net international migration, 2021 to 2022: +501
> Total population, 2022: 104,777
[in-text-ad]

Source: DenisTangneyJr / iStock via Getty Images
9. Lake Charles, LA
> Pop. change due to net migration, 2021 to 2022: -1.4% (-3,297)
> Net domestic migration, 2021 to 2022: -3,672
> Net international migration, 2021 to 2022: +375
> Total population, 2022: 239,346

Source: photoquest7 / iStock via Getty Images
8. Napa, CA
> Pop. change due to net migration, 2021 to 2022: -1.4% (-1,897)
> Net domestic migration, 2021 to 2022: -2,043
> Net international migration, 2021 to 2022: +146
> Total population, 2022: 134,300

Source: DenisTangneyJr / iStock via Getty Images
7. Elmira, NY
> Pop. change due to net migration, 2021 to 2022: -1.4% (-1,164)
> Net domestic migration, 2021 to 2022: -1,214
> Net international migration, 2021 to 2022: +50
> Total population, 2022: 81,426
[in-text-ad-2]
![54th at sunset [Image 2 of 6] by DVIDSHUB](https://247wallst.com/wp-content/uploads/2022/05/imageForEntry34-88o.jpg "54th at sunset [Image 2 of 6] by DVIDSHUB")
6. Minot, ND
> Pop. change due to net migration, 2021 to 2022: -1.4% (-1,103)
> Net domestic migration, 2021 to 2022: -1,188
> Net international migration, 2021 to 2022: +85
> Total population, 2022: 76,279

Source: DenisTangneyJr / iStock via Getty Images
5. Manhattan, KS
> Pop. change due to net migration, 2021 to 2022: -1.5% (-2,056)
> Net domestic migration, 2021 to 2022: -2,500
> Net international migration, 2021 to 2022: +444
> Total population, 2022: 133,072
[in-text-ad]

4. Salinas, CA
> Pop. change due to net migration, 2021 to 2022: -1.6% (-7,147)
> Net domestic migration, 2021 to 2022: -7,894
> Net international migration, 2021 to 2022: +747
> Total population, 2022: 432,858

Source: KathyKafka / iStock via Getty Images
3. Watertown-Fort Drum, NY
> Pop. change due to net migration, 2021 to 2022: -1.6% (-1,938)
> Net domestic migration, 2021 to 2022: -2,126
> Net international migration, 2021 to 2022: +188
> Total population, 2022: 116,637

Source: benedek / iStock Unreleased via Getty Images
2. New Orleans-Metairie, LA
> Pop. change due to net migration, 2021 to 2022: -2.1% (-21,162)
> Net domestic migration, 2021 to 2022: -24,334
> Net international migration, 2021 to 2022: +3,172
> Total population, 2022: 972,913
[in-text-ad-2]

1. Houma-Bayou Cane-Thibodaux, LA
> Pop. change due to net migration, 2021 to 2022: -3.0% (-6,270)
> Net domestic migration, 2021 to 2022: -6,412
> Net international migration, 2021 to 2022: +142
> Total population, 2022: 200,656
Sponsored: Want to Retire Early? Start Here
Want retirement to come a few years earlier than you’d planned? Orare you ready to retire now, but want an extra set of eyes on your finances?
Now you can speak with up to 3 financial experts in your area for FREE. By simply clicking here you can begin to match with financial professionals who can help you build your plan to retire early. And the best part? The first conversation with them is free.
Click here to match with up to 3 financial pros who would be excited to help you make financial decisions.
Thank you for reading! Have some feedback for us?
Contact the 24/7 Wall St. editorial team.
Editors' Picks