Some States Are Vaccinating for COVID Faster Than Others, Here’s How Maryland Stacks Up
An estimated 222,682,315 Americans have been fully vaccinated against COVID-19, or 68.1% of the U.S. population. Some states are proving more effective than others in getting their residents vaccinated. In Maryland, 76.6% of the population are fully vaccinated, higher than…

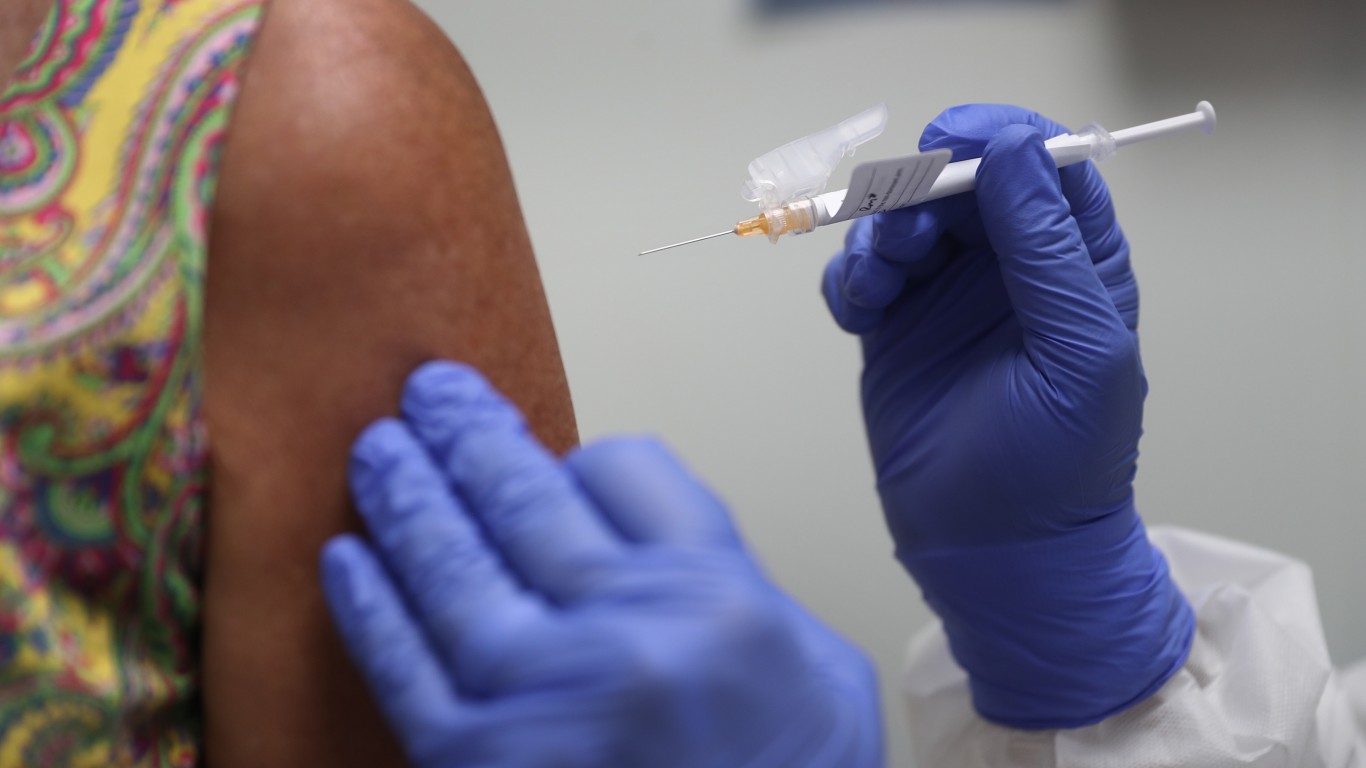
An estimated 222,682,315 Americans have been fully vaccinated against COVID-19, or 68.1% of the U.S. population.
Some states are proving more effective than others in getting their residents vaccinated. In Maryland, 76.6% of the population are fully vaccinated, higher than the U.S. average.
Though Maryland is doing a better job vaccinating its population than other states, there are still significant quantities of the vaccine sitting idle. As of July 18, Maryland has received about 17,202,700 vaccinations and administered about 73.6% of those doses.
Meanwhile, the virus continues to spread. In total, there have been 1,154,978 confirmed cases of the virus in Maryland as of July 18 — or 19,114 for every 100,000 people. For context, there have been 26,906 known infections for every 100,000 people nationwide.
All COVID-19 and vaccination data used in this story are current as of July 18, 2022.
| Rank | Place | Share of pop. fully vaccinated | Fully vaccinated residents | Total COVID-19 cases per 100k people |
|---|---|---|---|---|
| 1 | Rhode Island | 84.1% | 889,412 | 36,522 |
| 2 | Vermont | 81.8% | 512,291 | 20,280 |
| 3 | Maine | 81.0% | 1,084,551 | 20,370 |
| 4 | Connecticut | 80.1% | 2,860,091 | 23,514 |
| 5 | Massachusetts | 80.0% | 5,524,061 | 28,056 |
| 6 | Washington D.C. | 79.0% | 540,890 | 23,301 |
| 7 | Hawaii | 79.0% | 1,122,122 | 21,793 |
| 8 | New York | 77.6% | 15,162,143 | 29,123 |
| 9 | Maryland | 76.6% | 4,630,717 | 19,114 |
| 10 | New Jersey | 76.4% | 6,802,022 | 28,409 |
| 11 | Virginia | 74.1% | 6,307,510 | 22,409 |
| 12 | Washington | 73.9% | 5,567,197 | 22,505 |
| 13 | California | 72.9% | 28,824,931 | 26,153 |
| 14 | New Mexico | 72.2% | 1,512,682 | 27,454 |
| 15 | New Hampshire | 71.9% | 975,450 | 24,685 |
| 16 | Colorado | 71.8% | 4,087,310 | 27,457 |
| 17 | Oregon | 70.8% | 2,966,806 | 19,807 |
| 18 | Delaware | 70.7% | 684,079 | 29,838 |
| 19 | Minnesota | 70.2% | 3,938,992 | 27,828 |
| 20 | Pennsylvania | 69.7% | 8,932,293 | 23,722 |
| 21 | Illinois | 68.8% | 8,762,881 | 27,361 |
| 22 | Florida | 68.3% | 14,549,762 | 31,120 |
| 23 | Wisconsin | 66.3% | 3,855,151 | 30,039 |
| 24 | Utah | 65.8% | 2,080,418 | 31,311 |
| 25 | Nebraska | 64.4% | 1,241,668 | 26,306 |
| 26 | Arizona | 63.5% | 4,552,363 | 30,133 |
| 27 | North Carolina | 63.3% | 6,576,141 | 28,162 |
| 28 | Texas | 63.1% | 18,103,722 | 25,226 |
| 29 | South Dakota | 62.9% | 555,362 | 28,028 |
| 30 | Kansas | 62.7% | 1,826,799 | 28,153 |
| 31 | Iowa | 62.5% | 1,972,517 | 25,532 |
| 32 | Nevada | 62.5% | 1,895,353 | 26,029 |
| 33 | Alaska | 62.3% | 459,677 | 36,166 |
| 34 | Michigan | 60.7% | 6,063,790 | 26,373 |
| 35 | Ohio | 58.9% | 6,885,058 | 24,529 |
| 36 | South Carolina | 58.5% | 2,974,902 | 30,951 |
| 37 | Oklahoma | 58.3% | 2,297,268 | 27,819 |
| 38 | Kentucky | 58.0% | 2,590,737 | 31,884 |
| 39 | Montana | 57.8% | 613,840 | 27,237 |
| 40 | West Virginia | 57.8% | 1,043,095 | 29,962 |
| 41 | Idaho | 57.0% | 999,610 | 26,819 |
| 42 | Missouri | 56.9% | 3,485,985 | 24,852 |
| 43 | Indiana | 56.8% | 3,803,600 | 26,818 |
| 44 | North Dakota | 56.3% | 428,006 | 33,287 |
| 45 | Georgia | 56.0% | 5,894,561 | 25,611 |
| 46 | Tennessee | 55.5% | 3,756,545 | 31,853 |
| 47 | Arkansas | 55.2% | 1,664,181 | 29,246 |
| 48 | Louisiana | 53.9% | 2,511,808 | 26,934 |
| 49 | Mississippi | 52.3% | 1,561,513 | 28,542 |
| 50 | Alabama | 51.9% | 2,534,488 | 28,391 |
| 51 | Wyoming | 51.6% | 297,846 | 28,973 |