Most American households earn more than $62,800 annually, according to data from the U.S. Census Bureau. While it is one of the most prosperous countries in the world, the U.S. also has some of the worst income inequality. As a result, the national median income does not reflect the economic struggles of millions of Americans.
In nearly every state, there are counties or county equivalents where the median household income is well below the $62,843 national median. In half of all states there is at least one county where the median annual household income is less than $40,000. Using five-year estimates from the 2019 American Community Survey from the Census, 24/7 Wall St. identified the poorest county in every state.
While there are several notable exceptions, many of the counties on this list are relatively rural and far removed from major metropolitan areas that often serve as hubs of economic activity.
Sumter ranks as the poorest county in Alabama. With a median annual household income of just $24,320, it is one of only 10 U.S. counties or county equivalents where most households earn less than $25,000 a year. Sumter County residents are also nearly twice as likely as the typical Alabaman to live below the poverty line.
Incomes tend to rise with educational attainment, and lower-income areas are also often home to smaller shares of college educated adults. In Sumter County, just 21.6% of residents 25 and older have a bachelor’s degree or higher, compared to 25.5% of adults in Alabama and 32.1% of adults nationwide.
| State | Poorest County | Largest Place in County | Median Household Income | State Median Household Income | Poverty Rate | State Poverty Rate | Adult Bachelor’s Attainment | State Adult Bachelor’s Attainment | Unemployment rate, Nov. 2020 | State Unemployment Rate |
|---|---|---|---|---|---|---|---|---|---|---|
| Alabama | Sumter County | Livingston | $24,320 | $50,536 | 31.8% | 16.7% | 21.6% | 25.5% | 4.1% | 4.0% |
| Alaska | Yukon-Koyukuk Census Area | Fort Yukon | $41,413 | $77,640 | 25.4% | 10.7% | 13.6% | 29.6% | 9.9% | 8.1% |
| Arizona | Apache County | Chinle | $32,508 | $58,945 | 35.5% | 15.1% | 12.3% | 29.5% | 12.6% | 7.6% |
| Arkansas | Lafayette County | Stamps | $32,397 | $47,597 | 25.9% | 17.0% | 15.8% | 23.0% | 8.4% | 5.7% |
| California | Trinity County | Weaverville | $40,846 | $75,235 | 19.0% | 13.4% | 19.5% | 33.9% | 6.1% | 7.9% |
| Colorado | Bent County | Las Animas | $30,900 | $72,331 | 29.5% | 10.3% | 11.4% | 40.9% | 4.7% | 6.2% |
| Connecticut | Windham County | Willimantic | $66,550 | $78,444 | 11.4% | 9.9% | 24.3% | 39.3% | 7.3% | 7.7% |
| Delaware | Kent County | Dover | $60,910 | $68,287 | 13.5% | 11.8% | 23.7% | 32.0% | 5.0% | 4.7% |
| Florida | DeSoto County | Arcadia | $35,438 | $55,660 | 26.8% | 14.0% | 11.5% | 29.9% | 4.4% | 6.3% |
| Georgia | Jenkins County | Millen | $27,375 | $58,700 | 30.5% | 15.1% | 7.9% | 31.3% | 5.4% | 5.4% |
| Hawaii | Hawaii County | Hilo | $62,409 | $81,275 | 15.6% | 9.4% | 29.4% | 33.0% | 9.8% | 10.1% |
| Idaho | Madison County | Rexburg | $39,160 | $55,785 | 30.9% | 13.1% | 36.4% | 27.6% | 2.5% | 4.8% |
| Illinois | Pulaski County | Mounds | $34,640 | $65,886 | 20.5% | 12.5% | 12.5% | 34.7% | 7.9% | 6.5% |
| Indiana | Crawford County | Marengo | $41,662 | $56,303 | 17.9% | 13.4% | 10.3% | 26.5% | 5.2% | 4.9% |
| Iowa | Appanoose County | Centerville | $40,167 | $60,523 | 17.7% | 11.5% | 16.3% | 28.6% | 3.4% | 3.1% |
| Kansas | Chautauqua County | Sedan | $40,298 | $59,597 | 18.5% | 12.0% | 15.9% | 33.4% | 5.5% | 5.3% |
| Kentucky | Bell County | Middlesborough | $26,272 | $50,589 | 35.5% | 17.3% | 9.2% | 24.2% | 6.2% | 5.1% |
| Louisiana | Claiborne Parish | Homer | $26,776 | $49,469 | 33.6% | 19.2% | 12.8% | 24.1% | 6.3% | 8.1% |
| Maine | Piscataquis County | Dover-Foxcroft | $40,890 | $57,918 | 18.5% | 11.8% | 18.4% | 31.8% | 4.8% | 4.7% |
| Maryland | Allegany County | Cumberland | $45,893 | $84,805 | 16.5% | 9.2% | 18.9% | 40.2% | 6.6% | 6.6% |
| Massachusetts | Hampden County | Springfield | $55,429 | $81,215 | 16.4% | 10.3% | 27.1% | 43.7% | 7.5% | 6.2% |
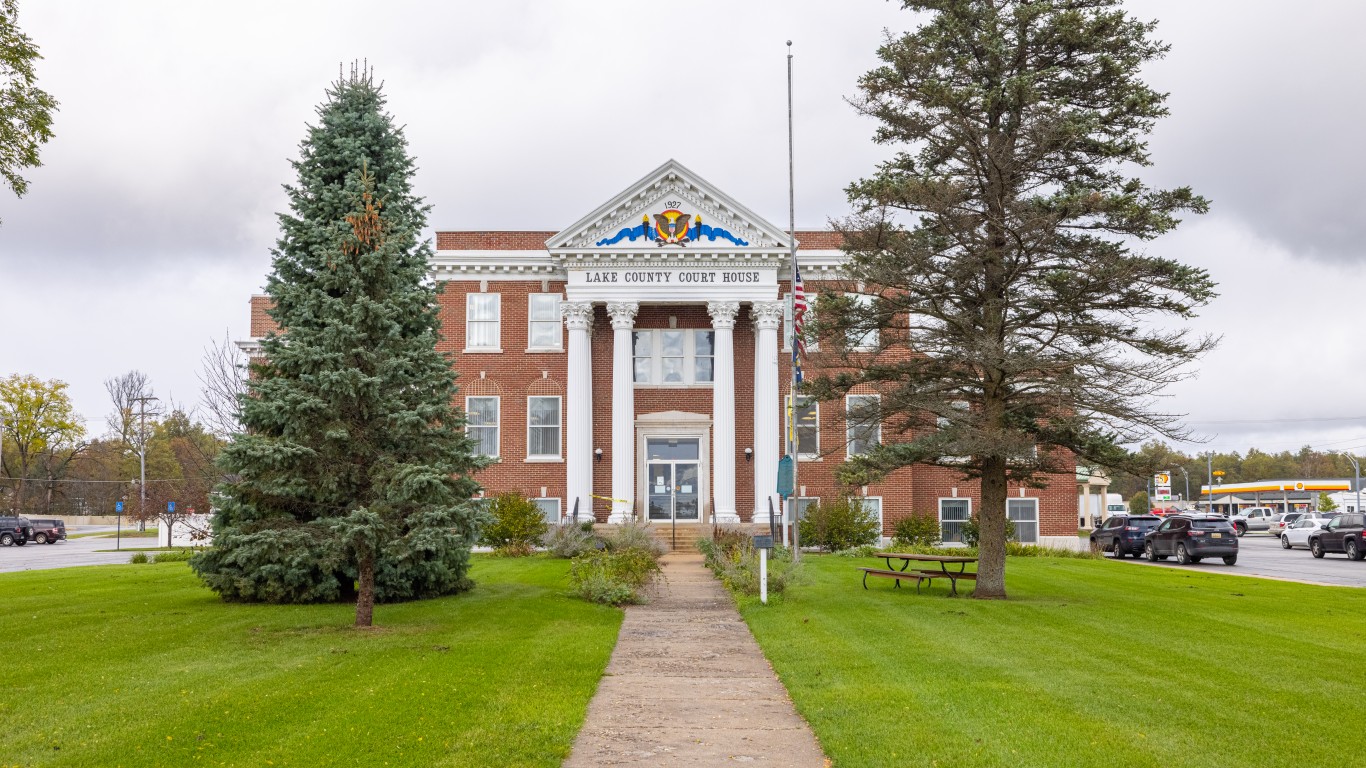
| Michigan | Lake County | Baldwin | $37,320 | $57,144 | 21.0% | 14.4% | 11.9% | 29.1% | 6.6% | 6.3% |
| Minnesota | Mahnomen County | Mahnomen | $44,688 | $71,306 | 23.3% | 9.7% | 13.2% | 36.1% | 6.6% | 3.9% |
| Mississippi | Leflore County | Greenwood | $26,735 | $45,081 | 36.8% | 20.3% | 18.5% | 22.0% | 9.2% | 6.0% |
| Missouri | Ozark County | Gainesville | $31,947 | $55,461 | 29.6% | 13.7% | 11.0% | 29.2% | 4.7% | 3.9% |
| Montana | Glacier County | Cut Bank | $36,045 | $54,970 | 31.0% | 13.1% | 21.4% | 32.0% | 8.0% | 4.3% |
| Nebraska | Dundy County | Benkelman | $41,716 | $61,439 | 10.6% | 11.1% | 23.3% | 31.9% | 2.2% | 2.7% |
| Nevada | Nye County | Pahrump | $47,300 | $60,365 | 16.4% | 13.1% | 10.7% | 24.7% | 7.6% | 9.9% |
| New Hampshire | Coos County | Berlin | $47,117 | $76,768 | 12.5% | 7.6% | 18.2% | 37.0% | 4.4% | 3.5% |
| New Jersey | Cumberland County | Vineland | $54,149 | $82,545 | 16.5% | 10.0% | 15.6% | 39.7% | 11.2% | 9.9% |
| New Mexico | Quay County | Tucumcari | $29,035 | $49,754 | 20.4% | 19.1% | 17.1% | 27.3% | 7.1% | 7.3% |
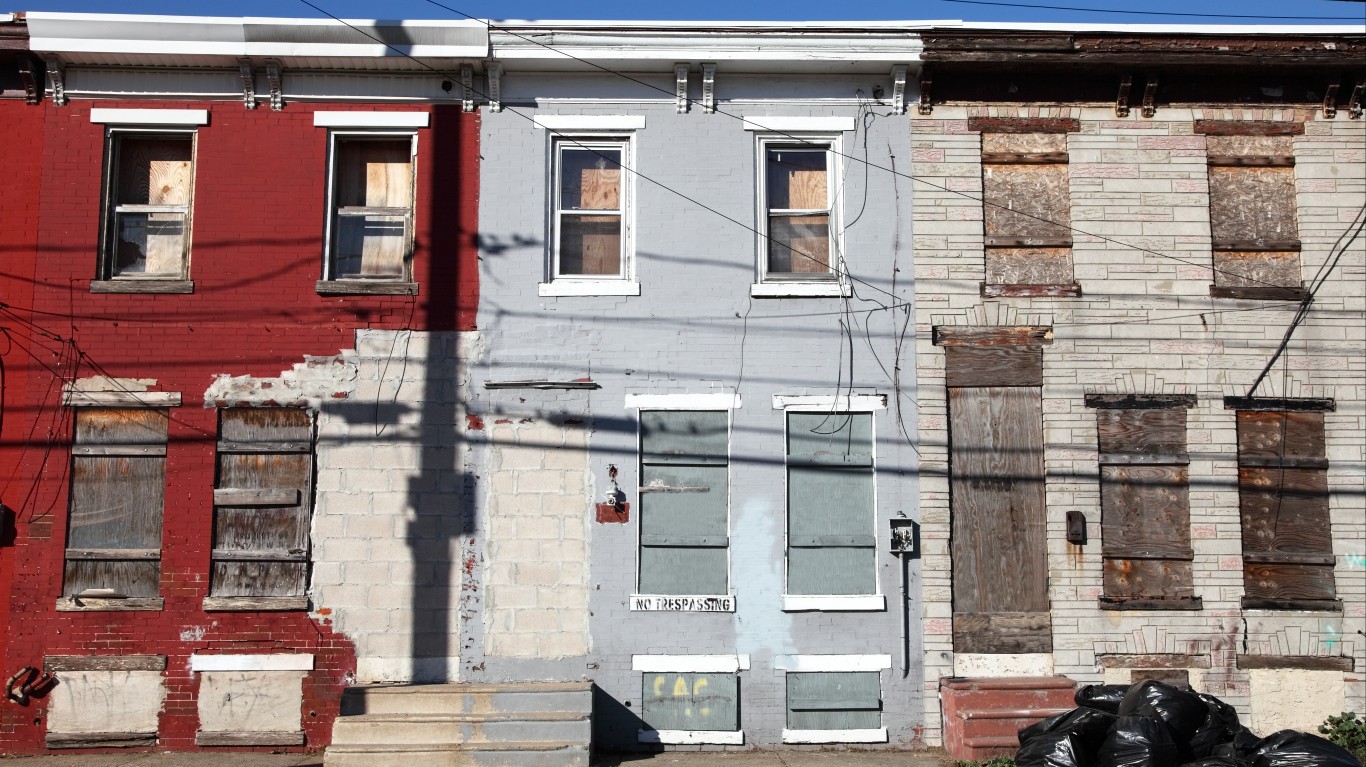
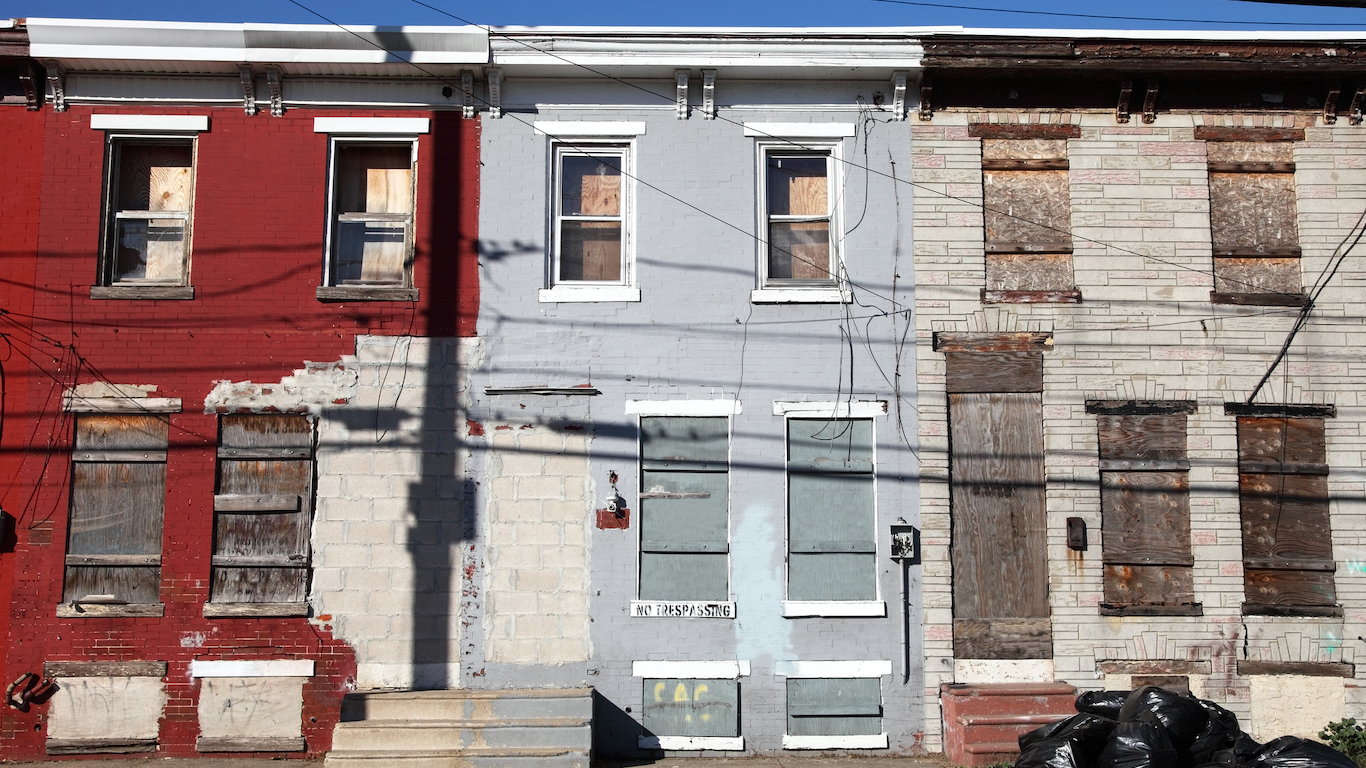
| New York | Bronx County | New York | $40,088 | $68,486 | 28.0% | 14.1% | 20.1% | 36.6% | 16.0% | 8.1% |
| North Carolina | Robeson County | Lumberton | $34,976 | $54,602 | 27.7% | 14.7% | 13.7% | 31.3% | 8.3% | 6.1% |
| North Dakota | Rolette County | Belcourt | $43,158 | $64,894 | 27.1% | 10.7% | 19.6% | 30.0% | 10.5% | 4.1% |
| Ohio | Adams County | West Union | $39,079 | $56,602 | 20.7% | 14.0% | 13.2% | 28.3% | 6.2% | 5.2% |
| Oklahoma | Choctaw County | Hugo | $34,489 | $52,919 | 27.7% | 15.7% | 13.4% | 25.5% | 8.0% | 5.8% |
| Oregon | Malheur County | Ontario | $43,313 | $62,818 | 21.8% | 13.2% | 13.7% | 33.7% | 3.6% | 5.5% |
| Pennsylvania | Forest County | Tionesta | $39,717 | $61,744 | 18.1% | 12.4% | 8.1% | 31.4% | 7.2% | 6.1% |
| Rhode Island | Providence County | Providence | $58,974 | $67,167 | 15.2% | 12.4% | 29.0% | 34.2% | 7.6% | 7.0% |
| South Carolina | Dillon County | Dillon | $30,812 | $53,199 | 32.6% | 15.2% | 11.1% | 28.1% | 4.7% | 4.1% |
| South Dakota | Corson County | McLaughlin | $35,759 | $58,275 | 44.8% | 13.1% | 17.8% | 28.8% | 4.0% | 3.3% |
| Tennessee | Jackson County | Gainesboro | $35,207 | $53,320 | 19.2% | 15.2% | 11.0% | 27.3% | 5.6% | 5.0% |
| Texas | Starr County | Rio Grande City | $30,387 | $61,874 | 34.7% | 14.7% | 9.9% | 29.9% | 19.0% | 8.0% |
| Utah | Wayne County | Loa | $44,245 | $71,621 | 9.6% | 9.8% | 23.4% | 34.0% | 5.8% | 3.9% |
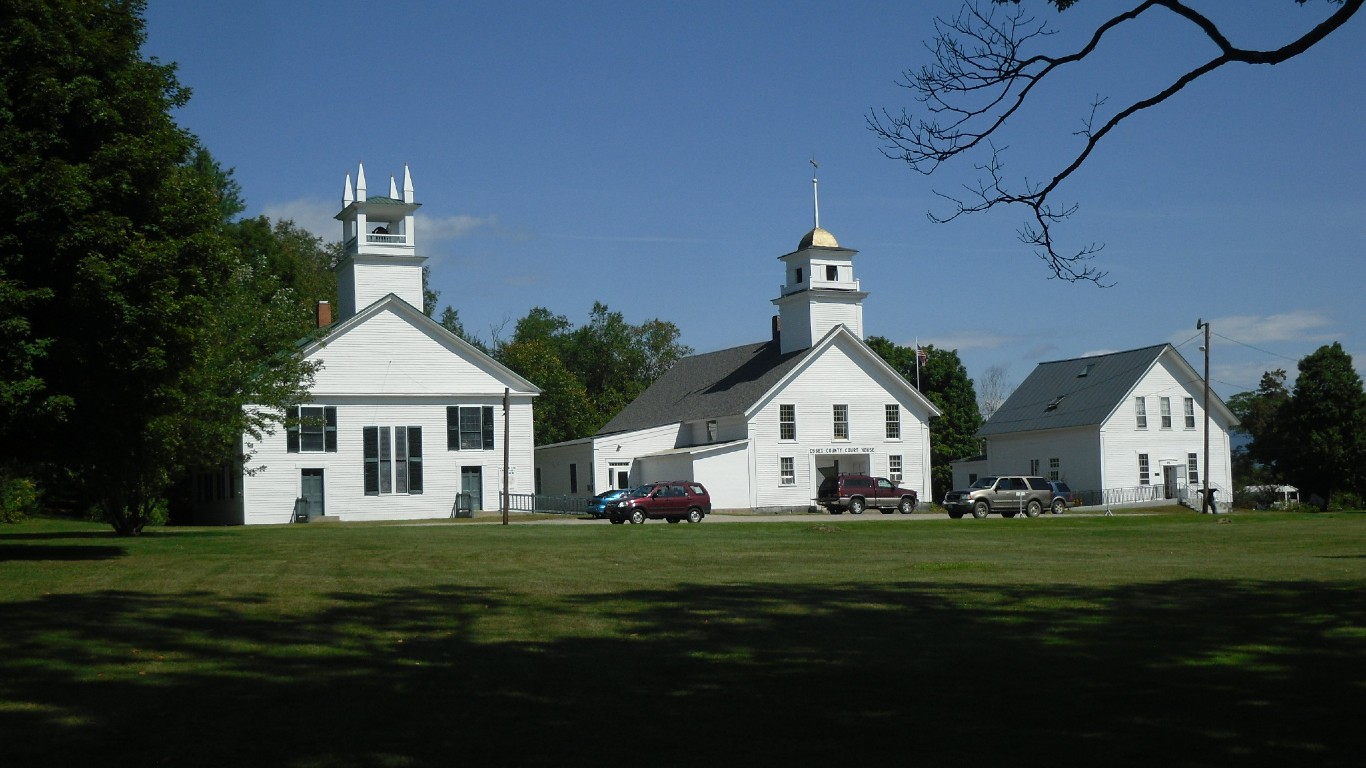
| Vermont | Essex County | Island Pond | $44,349 | $61,973 | 13.4% | 10.9% | 16.2% | 38.0% | 2.8% | 2.8% |
| Virginia | Dickenson County | Clintwood | $29,932 | $74,222 | 25.7% | 10.6% | 10.7% | 38.8% | 5.9% | 4.6% |
| Washington | Ferry County | Republic | $41,939 | $73,775 | 17.3% | 10.8% | 18.8% | 36.0% | 8.2% | 5.9% |
| West Virginia | McDowell County | Welch | $27,682 | $46,711 | 33.2% | 17.6% | 5.4% | 20.6% | 10.3% | 5.7% |
| Wisconsin | Ashland County | Ashland | $42,510 | $61,747 | 17.4% | 11.3% | 19.8% | 30.1% | 6.4% | 4.5% |
| Wyoming | Albany County | Laramie | $49,322 | $64,049 | 20.7% | 11.0% | 51.8% | 27.4% | 3.0% | 4.9% |