
[cnxvideo id=”655422″ placement=”ros”]Texas Instruments Inc. (NASDAQ: TXN) has done well, along with the broader market and semiconductor stock rally. With a gain of 11% so far in 2017, its performance is quite similar to that of the Van Eck Semiconductors index ETF and the Nasdaq 100. Still, that is twice the gain of the S&P 500.
Bank of America Merrill Lynch’s global research team has this week published a list of the firm’s Top 10 U.S. Ideas Quarterly for the second quarter of 2017. The firm has eight Buy ratings and two Underperform ratings across five sectors, and the charts of these stocks were used to identify the absolute and relative price trends as well as potential technical catalysts for the Top 10 U.S. Ideas.
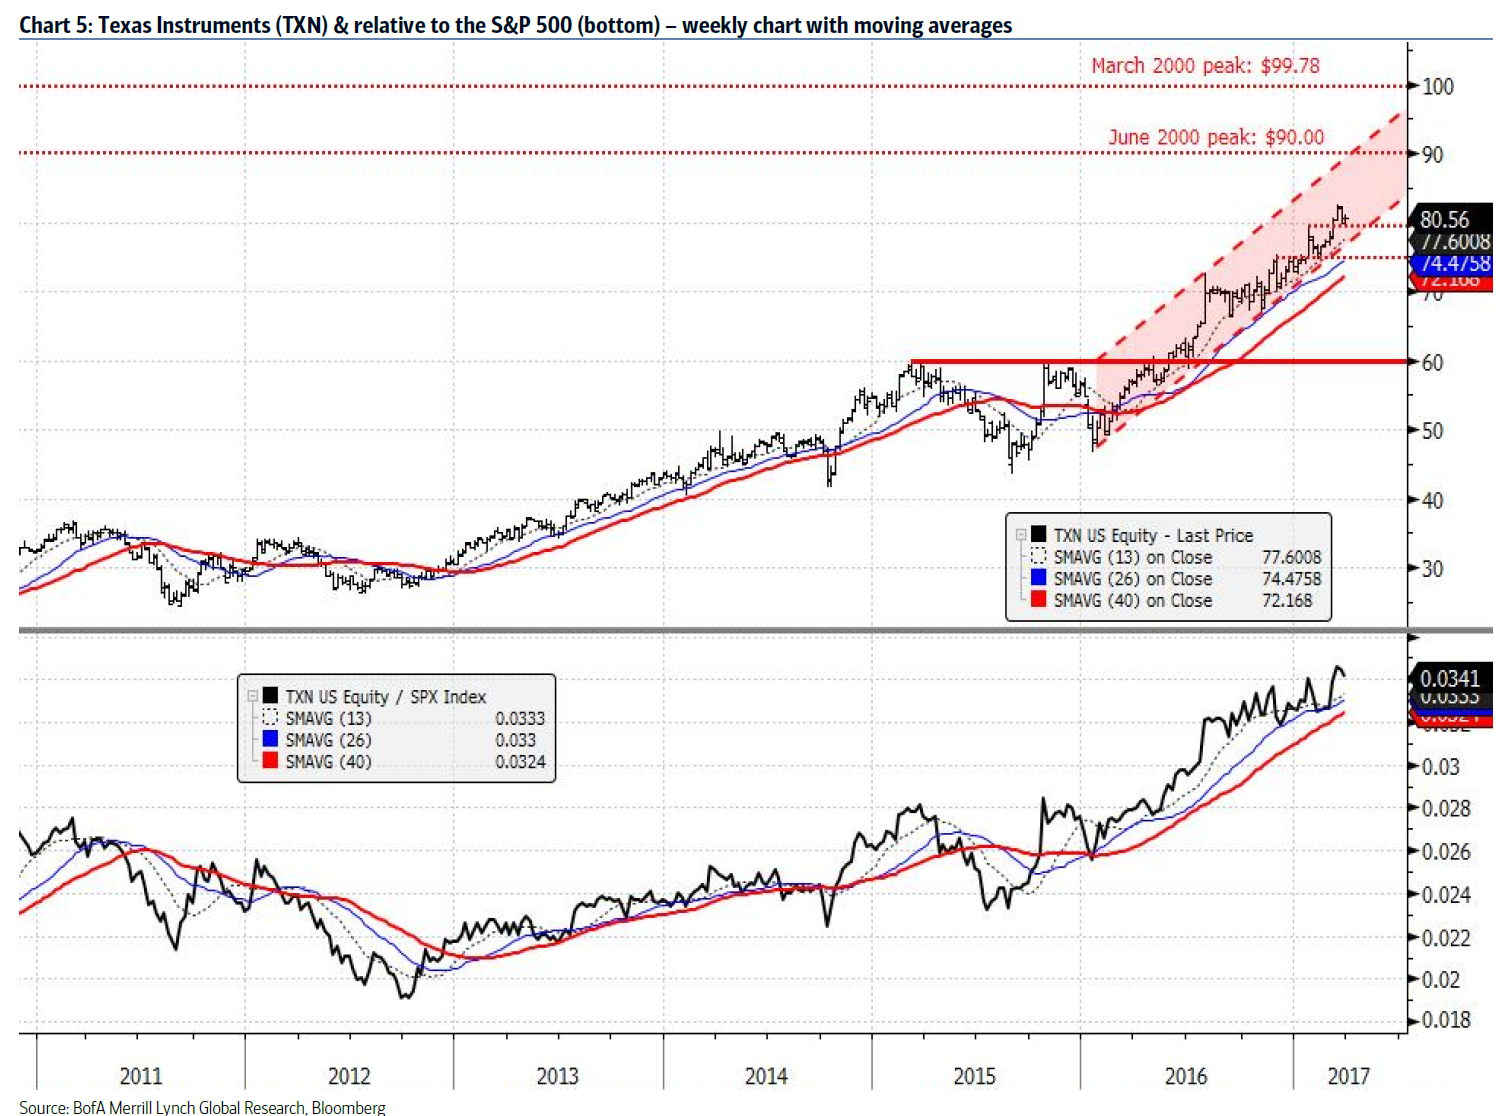
In the case of Texas Instruments, Merrill Lynch’s team pointed out that the June 2000 peak of $90.00 and the March 2000 peak of $99.78 are now being targeted. The firm’s immediate trend remains bullish while Texas Instruments shares trade above $79.47 to $77.00. Shares were still above $80.00 on last look.
[nativounit]
As far as why Texas Instruments’ chart is favoring a price up in the $90s, the technical report said:
Texan Instruments trends higher within a rising channel from early 2016 that supports the case for upside into the $90s. We are not ruling out tests of the June 2000 and March 2000 peaks of $90.00 and $99.78, respectively. Holding $79.47 to $77.00 keeps the immediate pattern bullish. Additional chart and 26-week moving average support comes in at $75.25 to $74.50 with the rising 40-week moving average near $73 to $72. Texan Instruments has a bullish chart relative to the S&P 500 and is in a leadership trend.
It is important to recall that technical analysis and chart watchers often differ greatly from the formal Buy, Sell or Neutral ratings and the underlying fundamental price targets of a firm. In this case, that is not the case as Merrill Lynch’s fundamental team has a Buy rating and a $92 price target.
Texas Instruments shares were last seen trading at $80.53, in a 52-week range of $56.19 to $82.44. Its consensus analyst price target is $81.74, and its market cap is just over $80 billion.
[recirclink id=385171]
Included below is a chart showing the long-term upswing that led the Merrill Lynch team to make its call for the stock to rise into the $90s.
[wallst_email_signup]
Contact [email protected] for any questions or corrections.