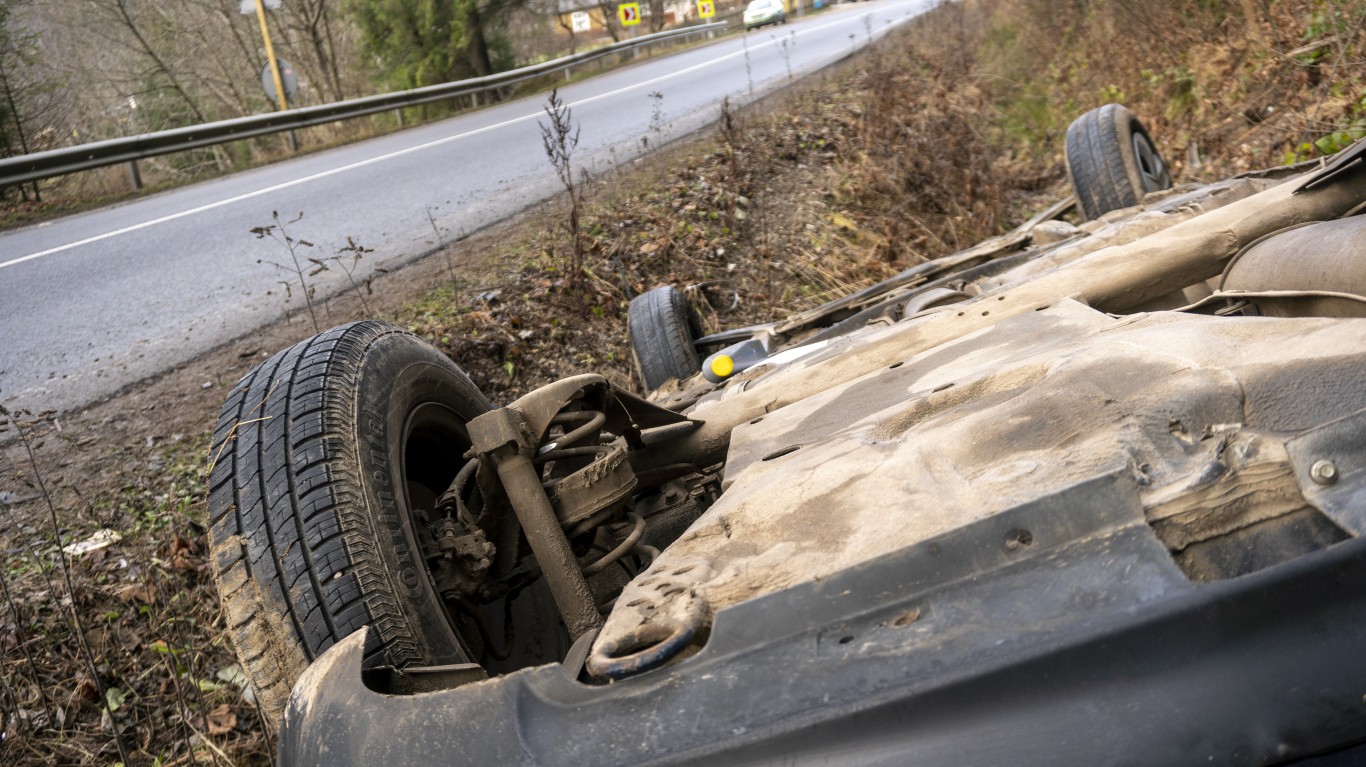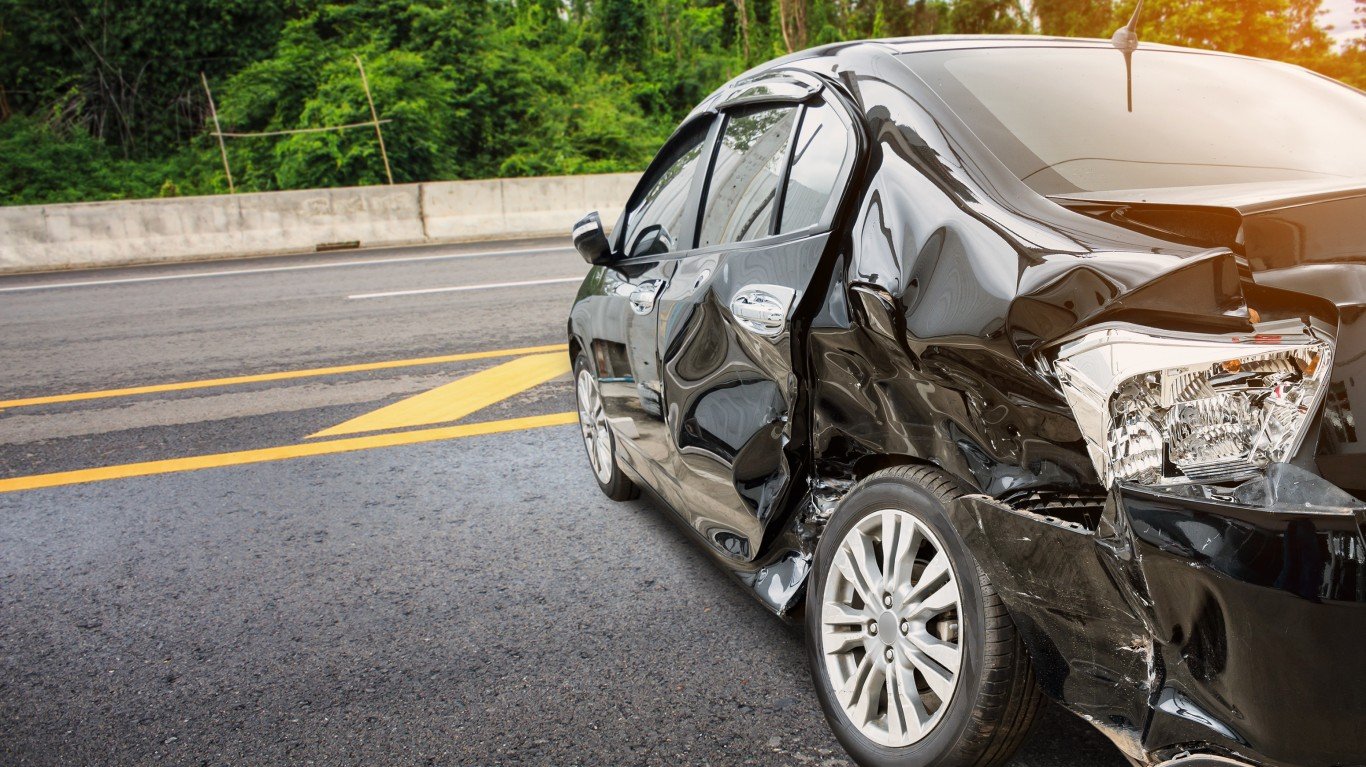
There are almost 6 million car crashes a year in the United States. The Insurance Institute for Highway Safety reports that there are over 40,000 deaths from these accidents. The rate of accidents varies substantially from state to state. Massachusetts takes the top spot based on crashes per total drivers.
The reasons for the crash rate in Massachusetts are unclear. The state government may be aware of the problem and has taken several measures. It adopted a law for the use of hands-free mobile phones in 2020. Another piece of legislation created a law for how drivers operate their vehicles around what is termed “vulnerable road users.” The law also added rules about the engagement of roadside workers, bikes, and people on foot. However, there is no direct proof about whether these plans improved crash rates.
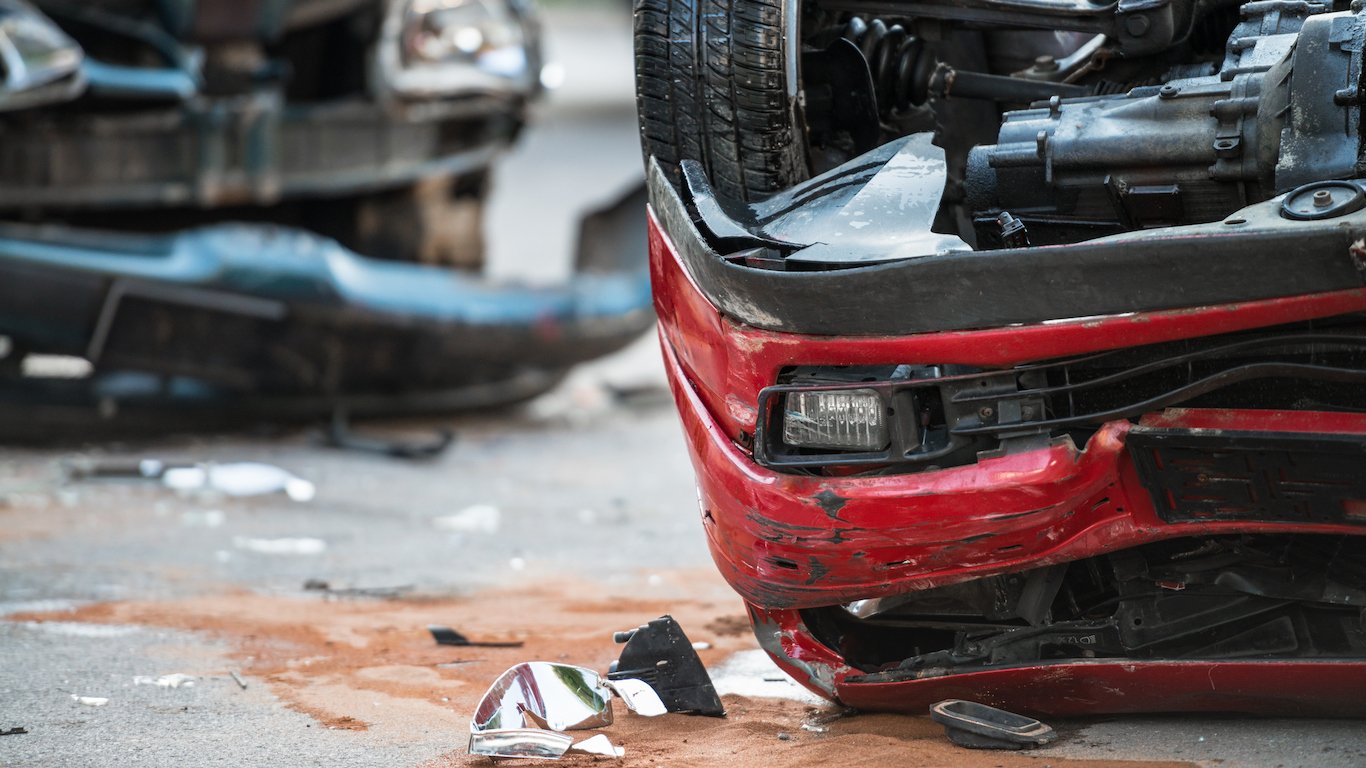
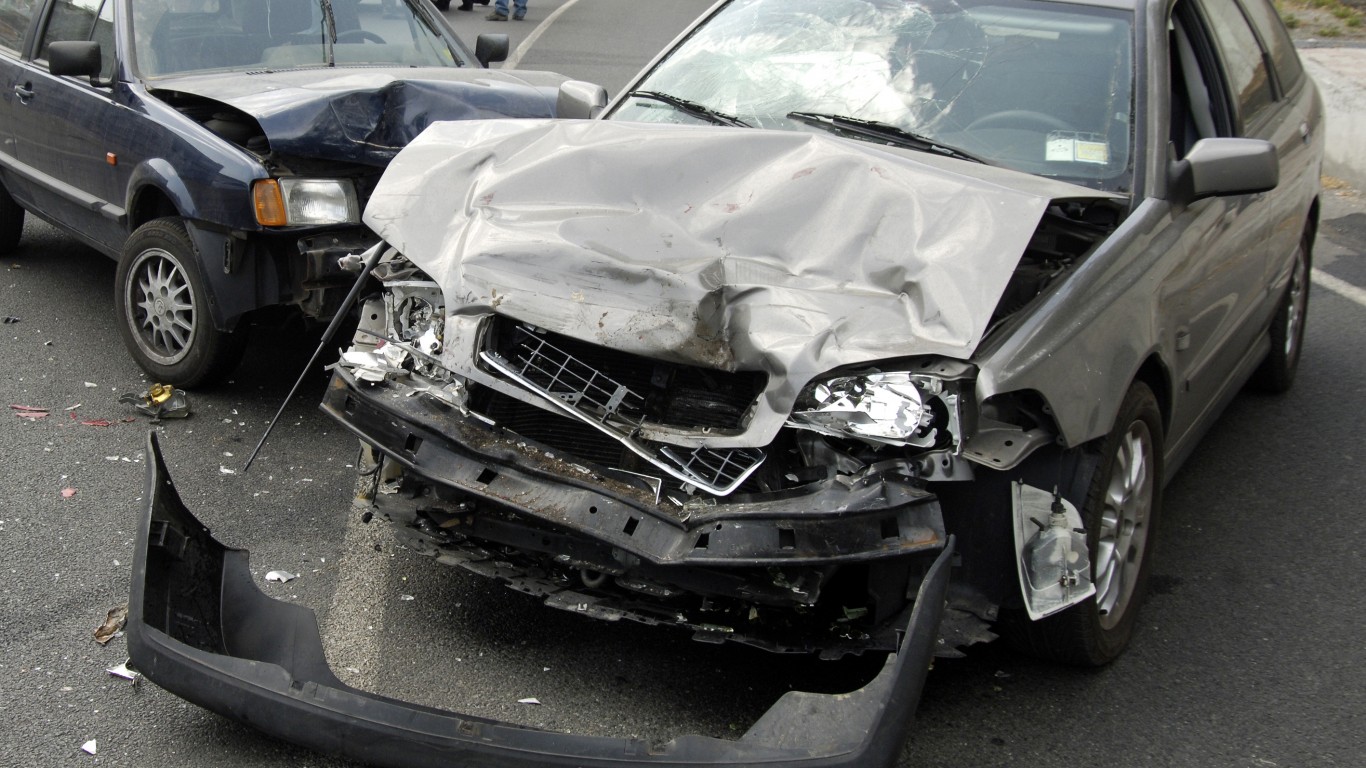
Insurify reports that the Massachusetts accident rate is 6.07%. New Hampshire (5.81%), Rhode Island (5.63%), and Maine (5.38%) follow. No reason was given for why the states with the worst records are in New England.
There is no geographic concentration among the states with the best accident records. They are led by Michigan (1.68%), Mississippi (2.86%), Illinois (3.02%), New Mexico (3.03%), and Hawaii (3.31%).
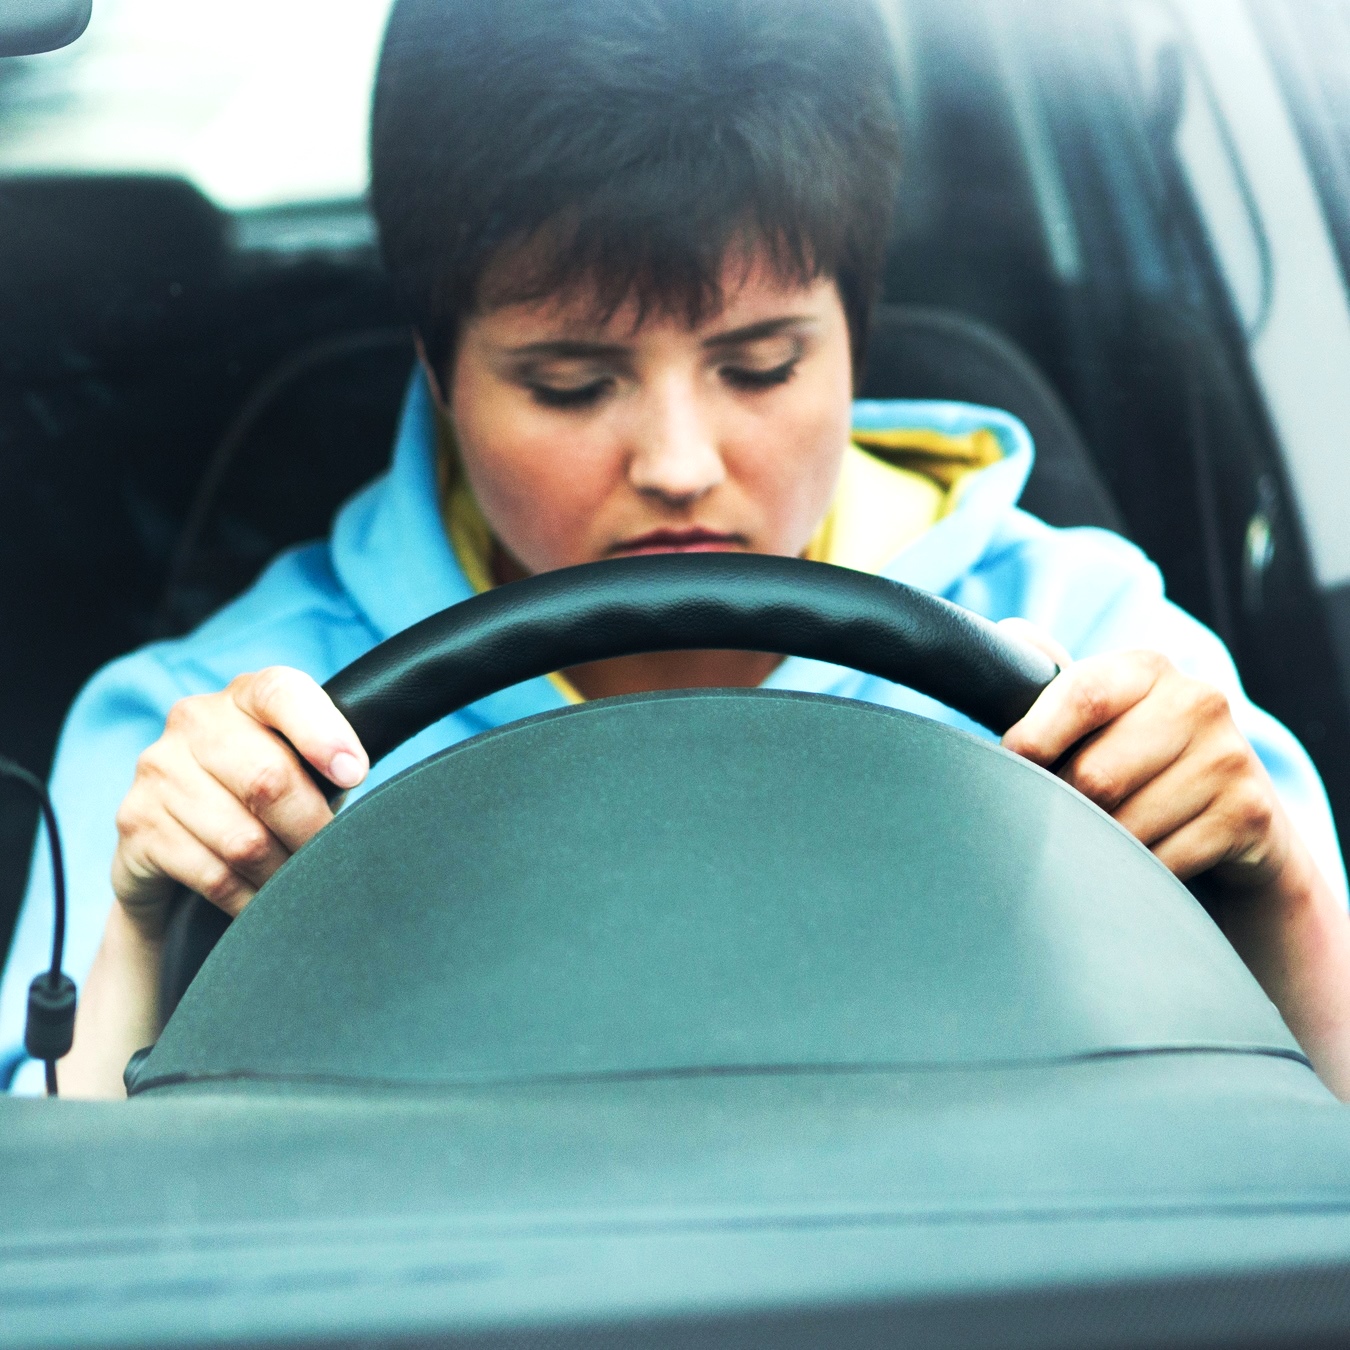
Another set of data has to do with age. The rate of car crashes among baby boomers was 3.12% in 2024. Among Gen X, the figure was 3.51%. Among millennials, it was 4.24%, and among Gen Z it was 6.84%.
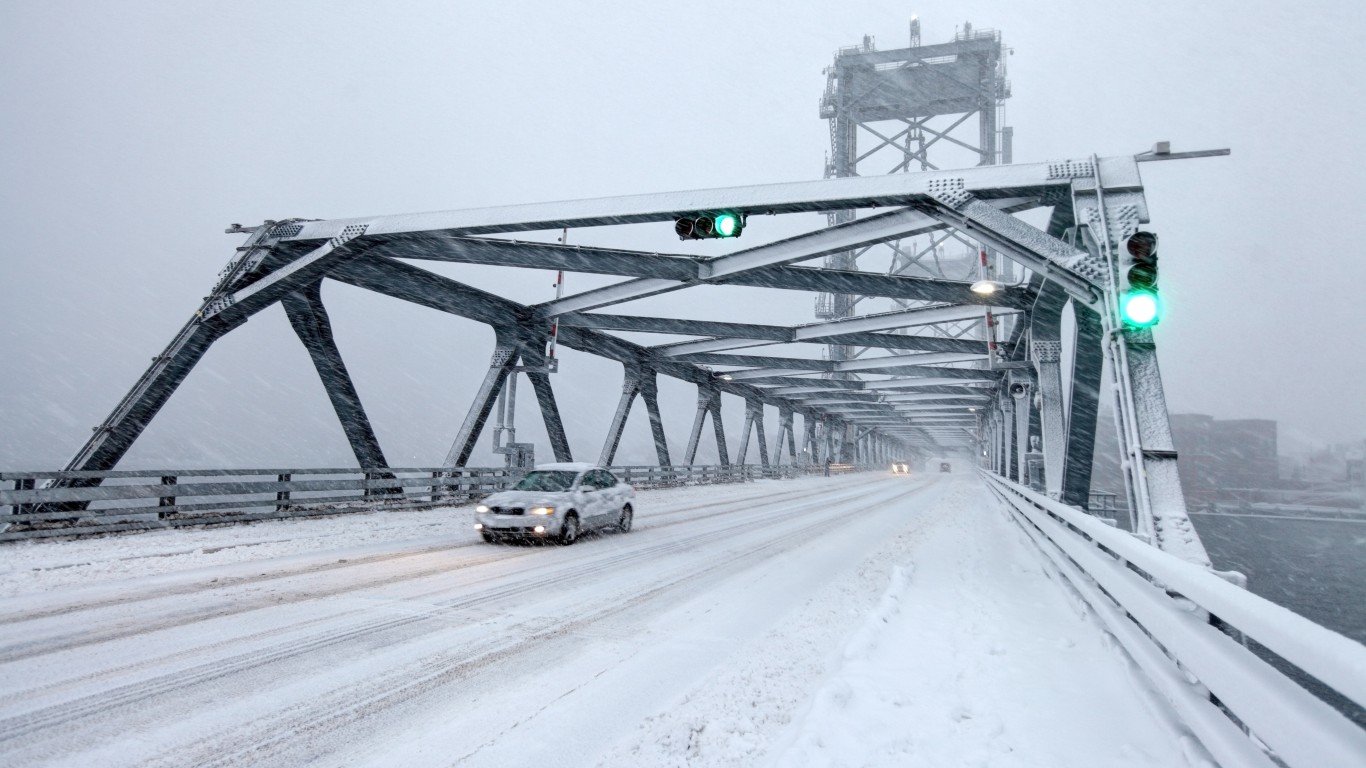
These Are the Best Cars for Winter Driving
Contact [email protected] for any questions or corrections.