Compared to the rest of the world, the United States has a relatively high standard of living. Still, in a country home to over 328 million people spanning nearly 3.8 million square miles, standards of living vary considerably from place to place — and some parts of the country stand out as examples of the high level of prosperity that is achievable in the United States.
While there are countless factors — many of them subjective — that can contribute to or detract from quality of life, there are a few key objective measures that can reveal a great deal about a given area. The United Nations Development Programme identified some of these measures and with them created the Human Development Index, a tool to better gauge and compare quality of life at a national level.
Inspired by the HDI, 24/7 Wall St. created an index consisting of three measures — poverty, life expectancy at birth, and bachelor’s degree attainment — to identify the best U.S. counties to live in. Our list also includes independent cities that do not fall within the boundaries of a county or county equivalent.
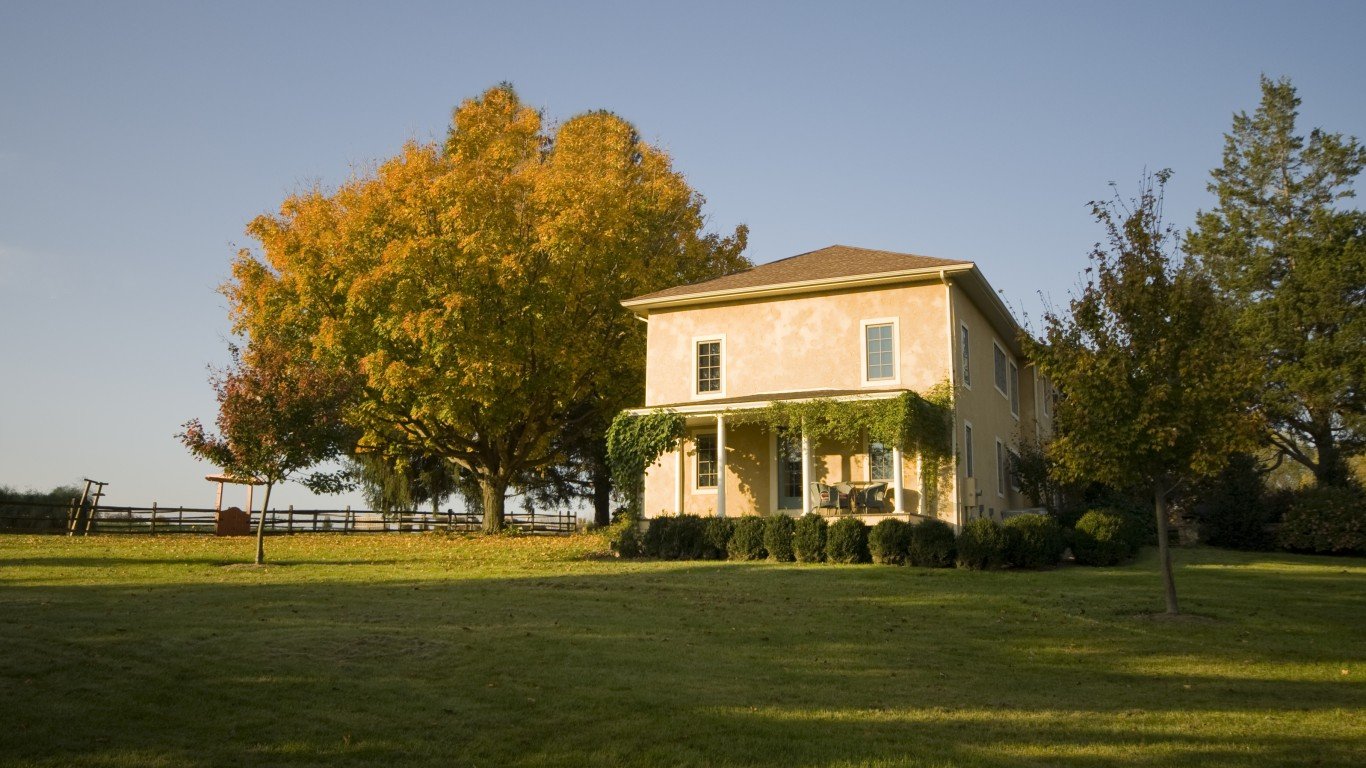
Chester County, located in southeastern Pennsylvania along the state borders of Delaware and Maryland, is one of the best places to live in the United States. Over half the local adult population have a bachelor’s degree or higher, and at 81.4 years, life expectancy at birth in the county is over two years higher than the national average. Chester County residents are also less than half as likely to live below the poverty line than the typical American.
Many of the best counties to live in are in close proximity to a major urban area — and most of Chester County is well within commuting distance of Philadelphia.
Data on the share of individuals living below the poverty line, as well as the share of adults 25 and older with at least a bachelor’s degree came from the 2019 U.S. Census Bureau’s American Community Survey and are five-year estimates.
Supplemental data on population, income, and median home value are five-year estimates from the ACS. Data on unemployment in January 2021 came from the Bureau of Labor Statistics and are not seasonally adjusted. These are the best counties to live in.
| Rank | Place | Life expectancy at birth (years) | Poverty rate | Adults with a bachelor’s degree |
|---|---|---|---|---|
| 1 | San Miguel County, CO | 100+ | 11.3% | 59.4% |
| 2 | Falls Church city, VA | 81.6 | 3.2% | 77.6% |
| 3 | Pitkin County, CO | 93.4 | 6.7% | 60.8% |
| 4 | Arlington County, VA | 85.2 | 6.8% | 75.3% |
| 5 | Summit County, CO | 96.8 | 8.0% | 52.4% |
| 6 | Los Alamos County, NM | 83.4 | 4.4% | 67.4% |
| 7 | Teton County, WY | 89.5 | 6.1% | 57.0% |
| 8 | Loudoun County, VA | 84.2 | 3.4% | 61.3% |
| 9 | Fairfax County, VA | 85.3 | 6.1% | 61.6% |
| 10 | Howard County, MD | 83.4 | 5.0% | 62.6% |
| 11 | Douglas County, CO | 84.0 | 3.1% | 58.0% |
| 12 | Marin County, CA | 85.4 | 7.2% | 59.5% |
| 13 | Williamson County, TN | 82.0 | 4.4% | 59.8% |
| 14 | Montgomery County, MD | 84.4 | 6.8% | 58.9% |
| 15 | Hamilton County, IN | 81.9 | 4.6% | 59.3% |
| 16 | Alexandria city, VA | 84.4 | 10.3% | 63.1% |
| 17 | Summit County, UT | 84.0 | 5.6% | 55.0% |
| 18 | Eagle County, CO | 90.1 | 8.0% | 47.2% |
| 19 | Broomfield County, CO | 82.9 | 5.6% | 55.7% |
| 20 | Hunterdon County, NJ | 83.4 | 4.5% | 52.7% |
| 21 | Johnson County, KS | 82.0 | 5.4% | 56.0% |
| 22 | Morris County, NJ | 82.6 | 4.8% | 54.1% |
| 23 | Somerset County, NJ | 82.5 | 5.1% | 54.7% |
| 24 | Delaware County, OH | 82.4 | 4.8% | 54.3% |
| 25 | Boulder County, CO | 83.0 | 11.7% | 62.1% |
| 26 | San Francisco County, CA | 83.8 | 10.3% | 58.1% |
| 27 | Santa Clara County, CA | 84.6 | 7.5% | 52.4% |
| 28 | San Mateo County, CA | 84.7 | 6.7% | 51.0% |
| 29 | Middlesex County, MA | 82.2 | 7.4% | 56.3% |
| 30 | Carver County, MN | 83.3 | 4.1% | 48.9% |
| 31 | Forsyth County, GA | 82.1 | 5.7% | 53.1% |
| 32 | Collin County, TX | 82.6 | 6.3% | 52.3% |
| 33 | Norfolk County, MA | 81.7 | 6.3% | 53.6% |
| 34 | Albemarle County, VA | 83.0 | 9.1% | 55.1% |
| 35 | New York County, NY | 84.9 | 15.8% | 61.3% |
| 36 | Ouray County, CO | 85.2 | 7.2% | 47.8% |
| 37 | Dallas County, IA | 82.1 | 5.2% | 50.4% |
| 38 | Chester County, PA | 81.4 | 6.4% | 53.0% |
| 39 | Oconee County, GA | 81.4 | 6.2% | 52.3% |
| 40 | Bergen County, NJ | 83.2 | 6.7% | 49.3% |
| 41 | Ozaukee County, WI | 82.3 | 5.3% | 49.0% |
| 42 | Fairfax city, VA | 78.9 | 9.3% | 60.8% |
| 43 | Nantucket County, MA | 82.8 | 8.7% | 52.8% |
| 44 | York County, VA | 82.7 | 4.9% | 47.1% |
| 45 | San Juan County, WA | 85.5 | 10.2% | 49.8% |
| 46 | DuPage County, IL | 82.4 | 6.4% | 49.4% |
| 47 | King County, WA | 82.4 | 8.9% | 52.5% |
| 48 | Clear Creek County, CO | 83.9 | 7.8% | 48.1% |
| 49 | Orange County, NC | 82.1 | 13.7% | 59.7% |
| 50 | Nassau County, NY | 82.9 | 5.6% | 46.0% |
| 51 | Gunnison County, CO | 83.3 | 13.4% | 56.2% |
| 52 | Wake County, NC | 81.6 | 9.1% | 52.8% |
| 53 | Westchester County, NY | 83.5 | 8.8% | 48.9% |
| 54 | Montgomery County, PA | 80.9 | 5.9% | 49.3% |
| 55 | Jeff Davis County, TX | 89.7 | 3.9% | 30.5% |
| 56 | Washington County, MN | 82.2 | 4.3% | 44.3% |
| 57 | Gilpin County, CO | 85.1 | 4.9% | 39.6% |
| 58 | James City County, VA | 81.0 | 7.3% | 50.4% |
| 59 | Teton County, ID | 83.8 | 4.5% | 41.0% |
| 60 | Bristol County, RI | 81.7 | 7.5% | 49.0% |
| 61 | Manassas Park city, VA | 92.5 | 6.4% | 27.9% |
| 62 | Leelanau County, MI | 82.8 | 6.1% | 44.7% |
| 63 | Mono County, CA | 96.5 | 12.1% | 28.8% |
| 64 | Fort Bend County, TX | 83.0 | 7.4% | 46.2% |
| 65 | Fayette County, GA | 81.3 | 5.5% | 46.2% |
| 66 | Williamsburg city, VA | 87.6 | 20.7% | 56.8% |
| 67 | Waukesha County, WI | 81.5 | 4.8% | 44.5% |
| 68 | Routt County, CO | 83.3 | 10.9% | 49.8% |
| 69 | Fairfield County, CT | 82.7 | 8.9% | 47.9% |
| 70 | Stanley County, SD | 88.0 | 4.7% | 32.1% |
| 71 | Lincoln County, SD | 84.0 | 4.1% | 37.6% |
| 72 | Dane County, WI | 81.7 | 10.9% | 51.4% |
| 73 | Alameda County, CA | 82.9 | 9.9% | 47.4% |
| 74 | Washtenaw County, MI | 81.4 | 14.0% | 55.9% |
| 75 | Gallatin County, MT | 82.4 | 11.3% | 50.1% |
| 76 | Boone County, IN | 78.6 | 6.0% | 49.3% |
| 77 | Newport County, RI | 81.4 | 8.7% | 48.1% |
| 78 | Dakota County, MN | 82.4 | 6.0% | 42.2% |
| 79 | Dukes County, MA | 82.0 | 7.6% | 44.9% |
| 80 | Denton County, TX | 81.8 | 7.6% | 45.1% |
| 81 | Hennepin County, MN | 81.3 | 10.4% | 50.1% |
| 82 | Olmsted County, MN | 82.5 | 8.4% | 44.9% |
| 83 | Goochland County, VA | 81.6 | 5.2% | 41.8% |
| 84 | Monmouth County, NJ | 80.5 | 6.9% | 46.0% |
| 85 | Putnam County, NY | 82.5 | 5.0% | 39.6% |
| 86 | Lake County, IL | 81.6 | 7.9% | 45.3% |
| 87 | Chittenden County, VT | 81.6 | 12.1% | 51.3% |
| 88 | Scott County, MN | 82.5 | 5.5% | 39.9% |
| 89 | Jefferson County, CO | 80.8 | 7.1% | 45.2% |
| 90 | Kendall County, TX | 81.2 | 5.6% | 42.1% |
| 91 | Washington County, OR | 82.6 | 8.9% | 44.4% |
| 92 | Morgan County, UT | 80.4 | 2.8% | 39.4% |
| 93 | Washington County, RI | 81.3 | 8.6% | 46.1% |
| 94 | Rockingham County, NH | 80.6 | 4.6% | 41.4% |
| 95 | Travis County, TX | 81.8 | 12.0% | 50.0% |
| 96 | Oakland County, MI | 80.2 | 8.2% | 47.2% |
| 97 | Williamson County, TX | 82.0 | 6.4% | 41.3% |
| 98 | St. Johns County, FL | 81.5 | 8.2% | 44.7% |
| 99 | Prince William County, VA | 82.2 | 6.6% | 41.1% |
| 100 | Rockwall County, TX | 80.9 | 4.7% | 40.7% |
| 101 | Cobb County, GA | 80.5 | 9.1% | 47.4% |
| 102 | Cumberland County, ME | 80.2 | 9.0% | 47.6% |
| 103 | Warren County, OH | 79.2 | 4.6% | 43.0% |
| 104 | Grand County, CO | 86.0 | 9.5% | 38.0% |
| 105 | La Plata County, CO | 82.2 | 9.1% | 44.2% |
| 106 | Saratoga County, NY | 81.0 | 5.8% | 41.4% |
| 107 | Platte County, MO | 80.2 | 6.2% | 43.1% |
| 108 | Middlesex County, CT | 81.1 | 6.9% | 42.2% |
| 109 | Stafford County, VA | 80.3 | 4.4% | 39.9% |
| 110 | Contra Costa County, CA | 82.4 | 8.7% | 42.4% |
| 111 | Tolland County, CT | 81.6 | 7.3% | 41.8% |
| 112 | Wasatch County, UT | 81.5 | 5.9% | 39.9% |
| 113 | Middlesex County, NJ | 81.5 | 8.5% | 43.6% |
| 114 | Sarpy County, NE | 81.3 | 5.9% | 39.8% |
| 115 | Barnstable County, MA | 79.6 | 6.4% | 43.4% |
| 116 | Oldham County, KY | 79.7 | 5.9% | 42.4% |
| 117 | Larimer County, CO | 81.6 | 11.6% | 47.3% |
| 118 | Kendall County, IL | 82.0 | 4.5% | 36.2% |
| 119 | Monroe County, IL | 82.3 | 4.1% | 35.0% |
| 120 | Arapahoe County, CO | 81.1 | 8.1% | 42.8% |
| 121 | Shelby County, AL | 80.5 | 7.5% | 42.9% |
| 122 | Placer County, CA | 82.2 | 7.7% | 39.7% |
| 123 | District of Columbia, DC | 78.6 | 16.2% | 58.5% |
| 124 | Bucks County, PA | 79.7 | 5.9% | 41.3% |
| 125 | Addison County, VT | 81.6 | 7.2% | 39.6% |
| 126 | Hampshire County, MA | 80.8 | 12.2% | 48.3% |
| 127 | Geauga County, OH | 81.3 | 5.8% | 38.0% |
| 128 | Anne Arundel County, MD | 79.2 | 5.8% | 41.7% |
| 129 | Hanover County, VA | 79.8 | 5.3% | 39.8% |
| 130 | St. Charles County, MO | 80.2 | 5.2% | 38.9% |
| 131 | Elbert County, CO | 81.6 | 4.8% | 35.8% |
| 132 | Frederick County, MD | 80.1 | 6.8% | 41.4% |
| 133 | Poquoson city, VA | 78.6 | 5.6% | 42.2% |
| 134 | Benton County, OR | 82.8 | 19.1% | 54.1% |
| 135 | Johnson County, IA | 82.7 | 18.1% | 52.8% |
| 136 | Beaufort County, SC | 82.6 | 10.2% | 41.2% |
| 137 | Collier County, FL | 86.1 | 11.2% | 36.4% |
| 138 | Fulton County, GA | 79.5 | 14.4% | 52.9% |
| 139 | Davis County, UT | 80.6 | 5.4% | 37.8% |
| 140 | Chatham County, NC | 81.7 | 10.2% | 42.4% |
| 141 | Rappahannock County, VA | 84.2 | 8.8% | 35.8% |
| 142 | Talbot County, MD | 81.4 | 8.7% | 40.6% |
| 143 | Orange County, CA | 83.1 | 10.9% | 40.6% |
| 144 | Denver County, CO | 79.8 | 12.9% | 49.4% |
| 145 | Golden Valley County, ND | 87.6 | 7.5% | 26.9% |
| 146 | Grand Isle County, VT | 80.4 | 7.5% | 39.8% |
| 147 | Chesterfield County, VA | 79.4 | 6.8% | 40.5% |
| 148 | St. Croix County, WI | 80.8 | 5.2% | 35.4% |
| 149 | Livingston County, MI | 80.7 | 5.2% | 35.4% |
| 150 | Mecklenburg County, NC | 80.4 | 11.6% | 45.4% |