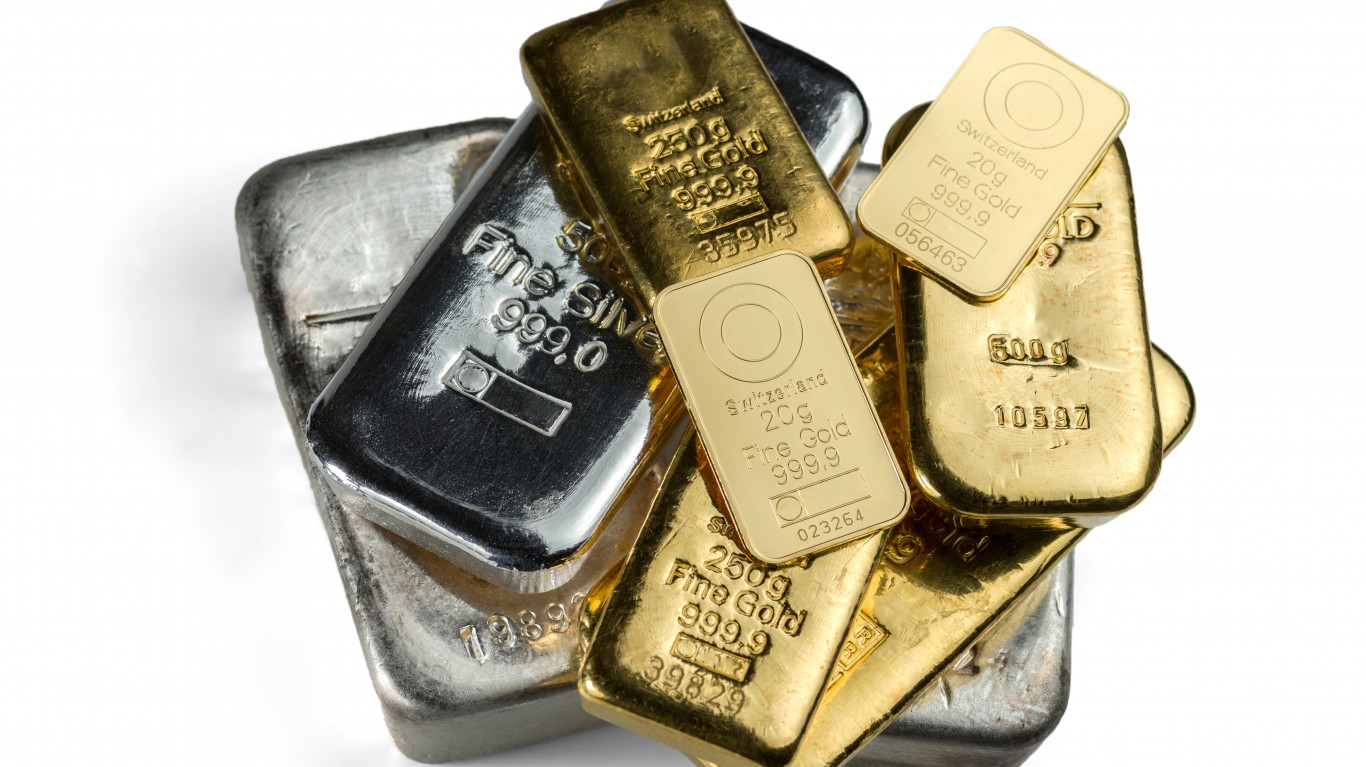

Gold and silver have been on a rampage in 2020. The uncertainties around the COVID-19 pandemic have created multiple benefits for gold. The zero interest rates in the United States are paired off with negative interest rates in Japan and Europe. Trillions of new stimulus dollars from the U.S. Federal Reserve have been followed by stimulus in Europe, China and elsewhere. It has been a perfect storm for gold, but silver’s move has only just started outpacing gold’s strong move.
Many investors and speculators are still looking for even more absolute performance ahead, despite gold having surged past the $2,000 per ounce mark and with silver having surged past the $26 per ounce level. There are many reasons to believe that these metals can go much higher, but there also are many reasons to believe that this is yet another bubble in the works.
A look into the trading history of past bubbles can offer some potential insight as to what can happen to the price of silver after the gold craze spreads into other precious metals. The size of the gold market is exponentially larger than the silver market, so any tactical rotation of assets into silver can create a much more leveraged move.
The Hunt brothers’ $1 billion-plus effort to corner the silver market in the 1970s showed that even $1 billion back then was not enough to corner the market, but today a move of $1 billion into silver will just create a much larger percentage move than $1 billion more into gold. During the silver bubble starting in 1979, silver rose from about $6 per ounce to nearly $50 — only to be back under $6 per ounce by 1982.
To show just how wide the disparity is between gold and silver in the amount of assets today, the two largest metals trusts are miles apart in assets as of the August 4 closing data. The iShares Silver Trust (NYSEARCA: SLV) is now up to $13.8 billion in assets, and the SPDR Gold Shares (NYSEARCA: GLD) had $79.9 billion in assets.
There also was a handy difference in the premiums or discounts to net asset value. The iShares Silver Trust’s premium was 6.94%, and the SPDR Gold Shares premium was 0.04%. While premiums and discounts can swing handily throughout the trading day, some of the disparity also can be due to closing time differences between metals and stocks.
The largest gold ETF versus the largest silver ETF only show a small portion of the disparity in size of silver. According to the ETFDB, the top two gold ETFs have a current $111 billion in assets, versus about $14.5 billion for the top two silver ETFs. The ETFDB also shows how much wider the disparity is between the two top silver ETFs and the size of the two top gold ETFs.
Gold hit an all-time high in U.S. dollar terms after uncertainty and as a historic hedge against inflation, but silver is nowhere close to its all-time highs. From the start of 2009 until the peak in 2011, silver’s run went from about $10 per ounce all the way up to nearly $50 in 2011. That silver bubble took less than a year to get back under $30 but it took until 2015 to get back under $15 per ounce. Since that time, silver had spent most of its time between $15 and $20 per ounce, before dipping under $13 in March of 2020 and then screaming higher to above $26 at the present time.
Thank you for reading! Have some feedback for us?
Contact the 24/7 Wall St. editorial team.
 24/7 Wall St.


