On October 12th, the silver market went into a rare condition defined as backwardation. Not unlike the inverse yield curve for bonds, which is when short term rates exceed long term ones, backwardation is when spot prices for commodities pull ahead of the futures market. Normally, the precious metals market charts similarly to that of interest rates, with near term prices cheaper than longer term ones, which carry elevated risks of unforeseen change, as well as increased carrying costs. This state of normalcy is referred to in commodities trading as contango.
In the last half century, apart from minor incidents, silver has entered deep backwardation on two prior occasions: during the 1980 Hunt Brothers’ cornering of the physical silver spot market, and during the Covid-19 pandemic. This time, silver reached an all-time high spread differential of $2.88 between spot and futures, vs. the previous $2.50 high set during the Hunt Brothers’ event. In fact, the backwardation of silver even spread to the gold market, which spooked traders around the globe.
Officials from the London Bullion Market Association (LBMA), which exclusively handles the paper trading markets, have done their best to calm the waters. However, as silver prices continue to climb, many analysts are anticipating that this was the first shot across the bow of what may be a major reordering and revaluation of the silver market.
Artificial Price Suppression
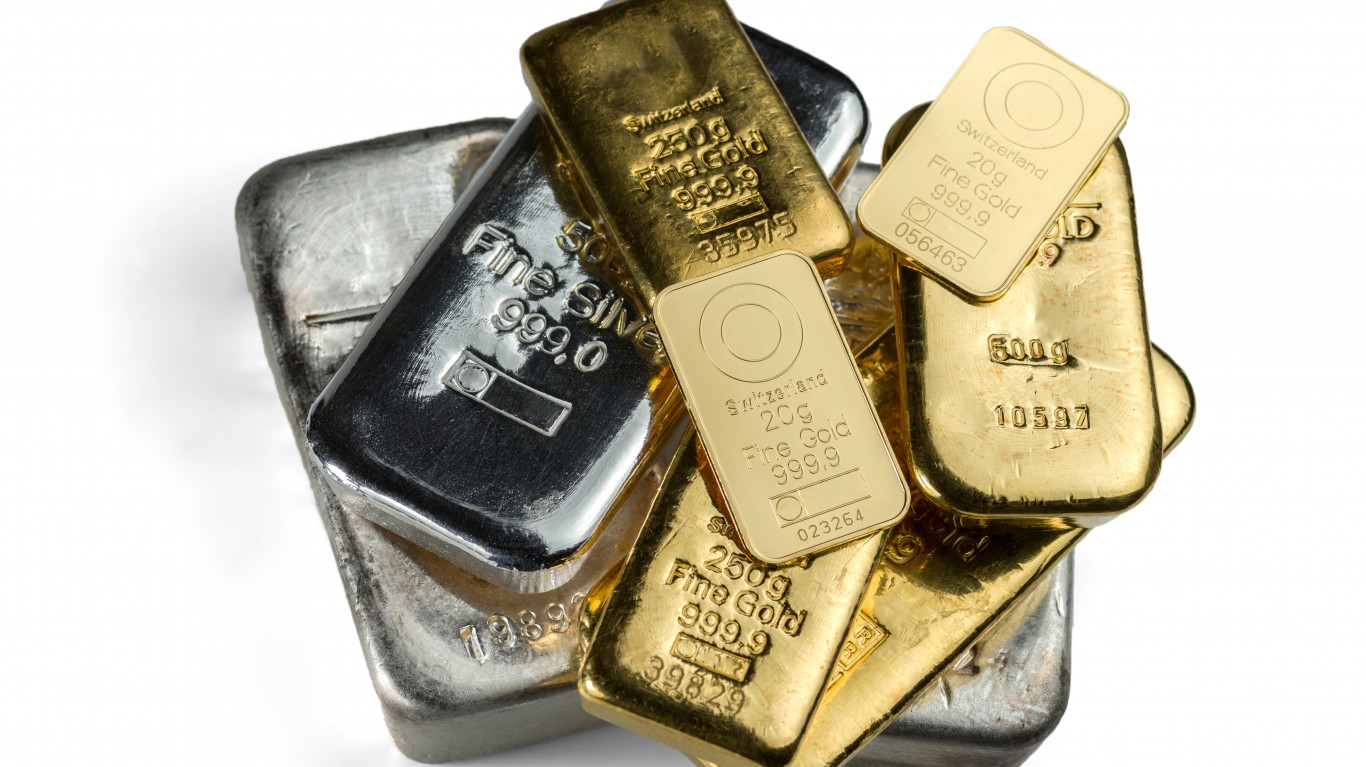
With the exception of China, most countries have historically valued gold as more precious than silver, but is that warranted in today’s industrial society?
With the exception of China, which in the past valued silver higher than gold for its currency during the Ming and Qing dynasties from the mid 1300s to early 1900s, most societies have given gold the higher nod.
- Ancient Rome had a 12:1 gold to silver ratio valuation.
- Most of world commerce operated on a roughly 15:1 +/- 2 ratio since the 1792 US Coinage Act, with some fluctuation.
- In 1939, FDR confiscated and then devalued the US dollar against gold, causing a silver surplus that sent the gold to silver ratio soaring to 98:1. This was done as a way to ease mounting debt pressures from the Great Depression on the eve of World War II.
- For the remainder of the 20th century, the ratio would hover in the 47:1 region, until the 1990s, where it reached 100:1, and then a high of 125:1 during the pandemic.
- Since then to the present, the ratio has fluctuated between 100:1 and 88:1.
However, one might be right to question whether this ratio reflects a genuine or artificial valuation of silver’s true worth. Due to silver’s much larger commercial and industrial applications, it is shorted by traders much more heavily than gold. The COMEX, CFTC, and LBMA fully support the price manipulation of silver via the paper futures markets, and the millions in fines they have levied to enforce that agenda has a long list, including those against J.P. Morgan Chase, UBS, HSBC and Deutsche Bank, among many others.
Silver’s use in manufacturing flat screen TVs, smart phone displays, solar panels, and batteries are just a few of its many industrial applications. LBMA silver futures papers trade roughly 25,000 MT per day, which is about the equivalent of a one year’s total global silver production.
A number of documented recent trends by large players have been taking advantage of the artificial price suppression afforded from the futures market. These include:
- Stockpiling by the US government was announced as an official policy.
- Accumulation by China for its solar panel and other product manufacturing.
- Saudi Arabia accumulating large silver positions via ETFs.
- Russia has allocated over $530 million for precious metals hoarding of silver, along with gold, palladium, and platinum.
- Concerns that President Trump’s reciprocal tariff policies would extend to precious metals trading caused an upswing in physical silver demand orders.
- Indian Diwali buying is the latest trend that may have been the straw to break the camel’s back.
India Rips Of the Mask

India’s mass buying of physical silver to celebrate Diwali has been referenced as a major contributor to the October backwardation of the silver market.
Indian mass physical silver buying for its Diwali holiday season is cited by a number of analysts as the primary trigger for the October backwardation. Due to the surge in gold prices reaching $4,000, the relatively cheap price for physical silver soon drew the bulk of purchases, rapidly causing a supply shortage. With Indian and Chinese markets both closed for national holidays, orders flooded London. However, the bulk of London’s $36 billion is held in ETFs, and the dwindling liquidity caused overnight borrowing rates to explode by 200%. Spot premiums, usually around 20 cents to as much as $2.00 per ounce, zoomed above $5.00 per ounce. The backwardation caused so much market turbulence that one trader reported that he was able to successfully arbitrage trade between buy/sell quotes from two different major banks.
The combination of ETF holdings and sudden physical silver demands on London’s supplies created a squeeze that exposed the vulnerabilities of LBMA’s paper-futures market and its maintenance of artificially low prices on silver.
A Delivery Call Away From Triple Digit Silver Prices?
Backwardation indicates that physical silver shortages have grown so large that should China or Saudi Arabia call for delivery on a silver contract instead of rolling it over could trigger a massive squeeze on the markets as the short attempt to cover heir open positions.
The steep backwardation, even with corrections, demonstrates that the perfect storm for global silver revaluation may be just on the horizon. Historically, backwardation has preceded major bull runs. The 1980 backwardation triggered a 71% rally in just one month. In 2011, a brief backwardation launched a 3-month run of nearly 100% price increases in silver.
The LBMA routinely has demonstrated it keeps insufficient supply of physical silver on hand against its trades. In 2021, it “mistakenly” reported holding 3,300 MT more silver than what actually was in its inventory. Since the LBMA is ill equipped to handle large scale physical trading, unlike the Shanghai Metals Exchange, some analysts could compare it to a Ponzi scheme that is just one delivery call away from a collapse. If Saudi Arabia or China decided to take delivery of silver on a futures contract like the Hunt Brothers did in 1980, the subsequent inability of any short sellers to cover open positions can result in a huge price squeeze that could conceivably collapse the LBMA.
Stocks and Funds Holding Physical Silver
SLVR invests 80% of its assets into actual silver mining entities with the remainder devoted to physical silver ownership through a sister ETF issued by Sprott.
Given the above scenario possibilities, investors looking to obtain physical silver exposure would probably be best served with the purchase of physical silver directly. Short of that, the following stocks and funds hold physical silver, so they should be experiencing commensurate upside as spot prices continue to rise:
iShares Silver Trust (NYSEARCA: SLV) – the fund’s $23.28 billion war chest holds its silver bars in several different bank vaults and tracks the spot price in the market.
Sprott Physical Silver Trust (NYSE: PSLV) – recently reaching a $10 billion NAV, this trust holds silver bullion in Royal Canadian Mint vaults. Under certain circumstances, it is one of the only funds in which a shareholder may be able to redeem some shares for physical silver.
Abrdn Physical Silver Shares ETF (NYSEARCA: SIVR) – this ETF keeps its $3 billion in silver bullion assets in London vaults.
Sprott Silver Miners and Physical Silver ETF (NASDAQ: SLVR) – a relatively new ETF only debuting in January 2025, SLVR allocates as much as 80% of its holdings into ownership of silver mines, with the balance in PSLV for direct physical silver ownership, albeit one step removed.
A final point that some have made is that the previous 1980 $48 per ounce silver ceiling price has never been adjusted for inflation. If adjusted to current CPI data parameters, that previous $48 ceiling should equate to about $200 per ounce in 2025 dollars. Now that silver has broken past $53 per ounce, it mathematically could soar to $200 per ounce or more under a more realistic revaluation that removes the 100:1 gold to silver ratio and factors in genuine supply and demand statistics to assess the physical silver deficit without artificial price restraints.
Contact [email protected] for any questions or corrections.