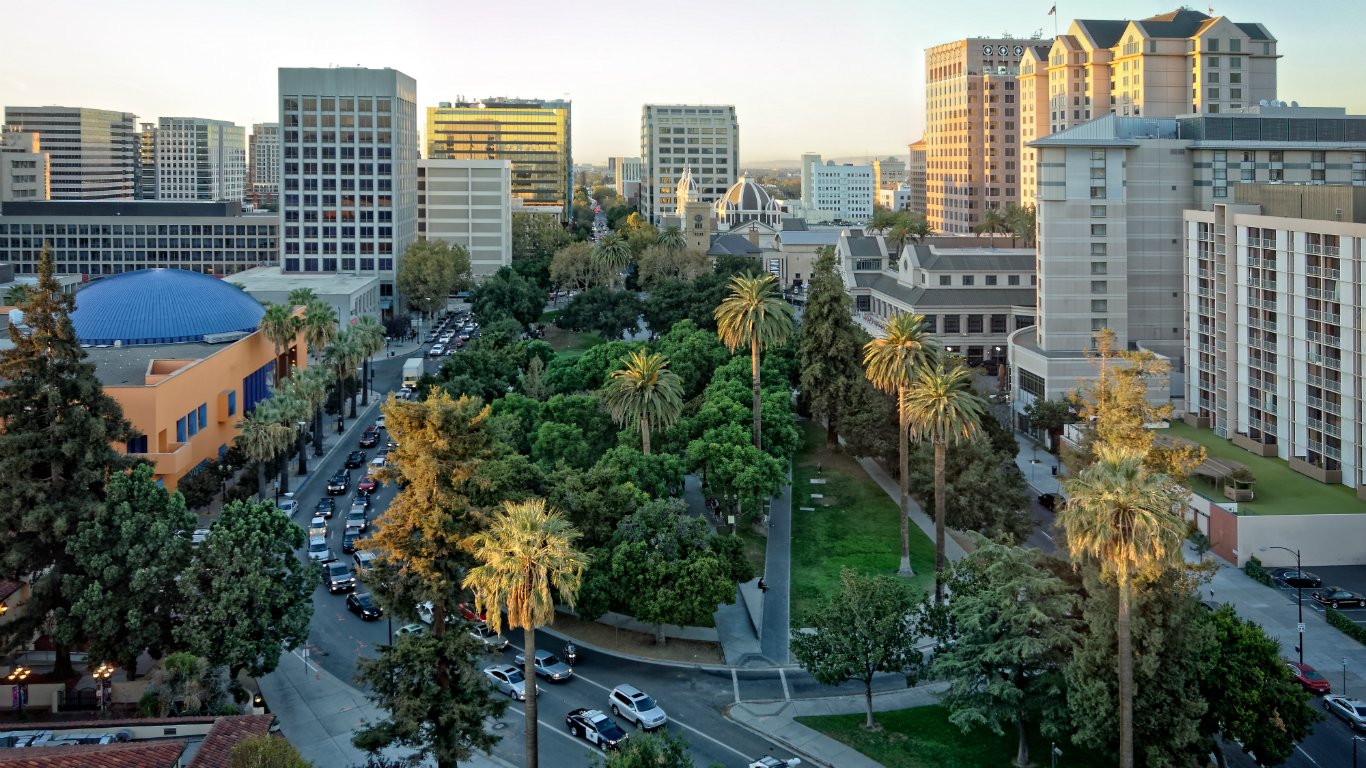
Since the Great Recession of 2008, California’s Silicon Valley has added more than 820,000 jobs. That’s nearly as many jobs as the 883,000 people who live in San Francisco. The benefits of that growth have been unequally distributed among the racial and ethnic groups that populate the valley.
[in-text-ad]
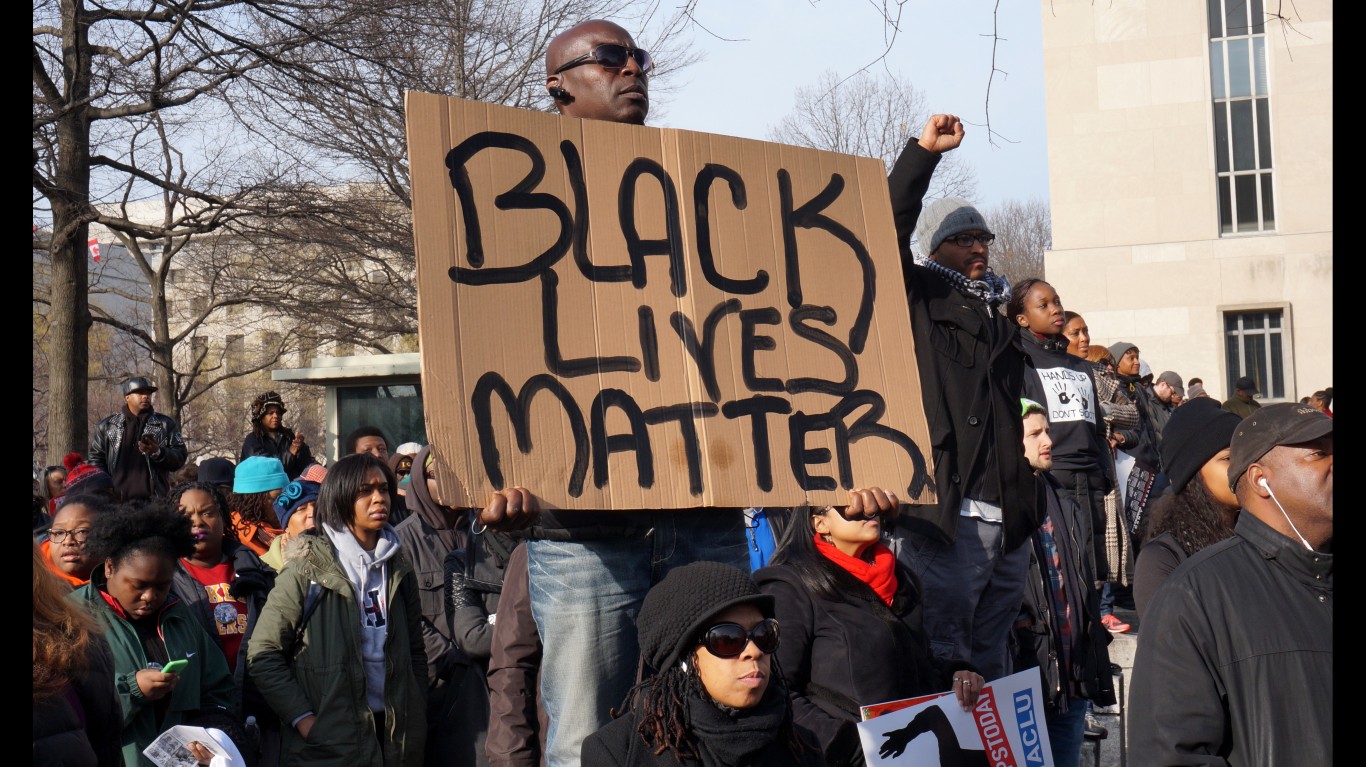
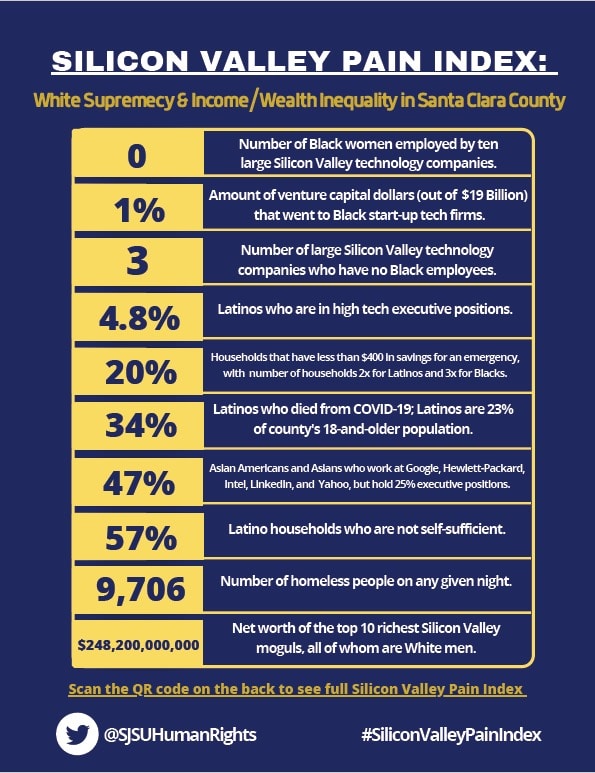
According to a study released Tuesday by the San Jose State University Human Rights Institute, just 3% of employees at the top 75 Silicon Valley technology firms are Black. No Black women are employed at 10 large companies there, and three large tech companies have no Black employees at all.
The study, titled “Silicon Valley Pain Index: White Supremacy and Income/Wealth Inequality in Santa Clara County,” starkly enumerates the area’s disparities.
[nativounit]
The following graphic from the Institute highlights just a few of the inequalities the researchers discovered.
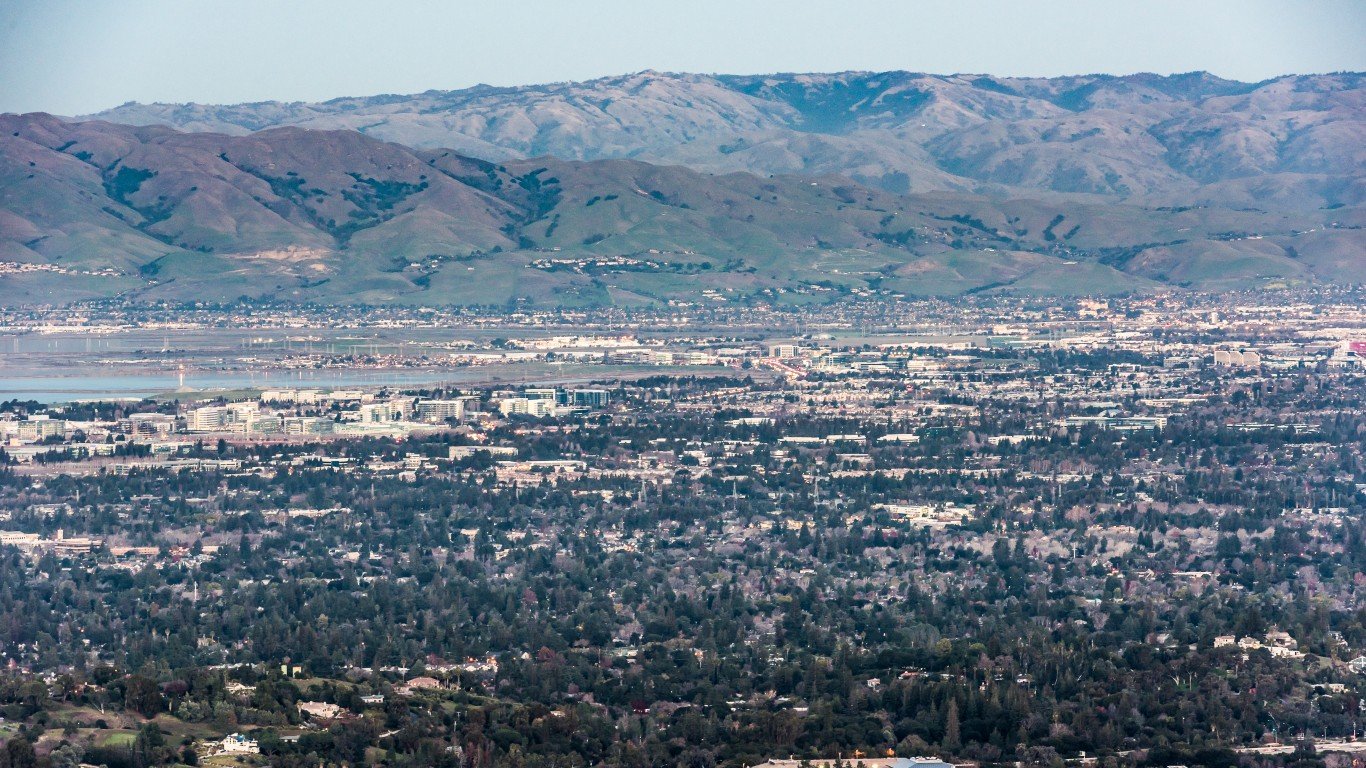
Among the valley’s most important issues are housing and how much that housing costs. In the 2020 Silicon Valley Index published by Joint Venture Silicon Valley’s Institute for Regional Studies, the researchers note that new housing permits were issued for just 173,000 new housing units, roughly enough to house about 20% of the expanded workforce. The result: “the nation’s highest housing prices, an unsettled workforce, and a transportation system sagging under the weight of 100,000 megacommuters.” The valley’s median home price is $1.2 million.
The San Jose State researchers note that Santa Clara County, the center of the Silicon Valley, has the highest average monthly housing cost ($2,341) and highest apartment rental rates ($2,911) among all 3,412 U.S. counties, and Santa Clara County ranks sixth in the nation for income inequality. The county’s median household income is the nation’s third-highest at $125,933.
Just over one in 20 white Americans (5.6%) live in poverty, while 11.8% of Latino and 12.7% of Black households are poverty-stricken. While nearly a fifth (18% ) of white households are not self-sufficient, nearly half (46%) of Black households and more than half (57%) of Latino households are not self-sufficient.
Three-quarters of the valley’s wealth (and there is plenty of it) is concentrated in 13% of households that have a net worth of more than $1 million. Households in the 95th percentile of income earn $428,729, including average per capita incomes of $82,810 for white households, $63,136 for Asian households, $40,886 for Black households and $28,960 for Latino households.
The top 1% of San Jose households post average annual income of $3.4 million and the net worth of the 10 richest Silicon Valley executives (all men) is $248.2 billion.
Four of the valley’s largest firms (Apple, Alphabet/Google, Cisco and Facebook) sit on cash reserves totaling $307.5 billion. Yet the budget for libraries in San Jose was cut by $1 million for the coming fiscal year.
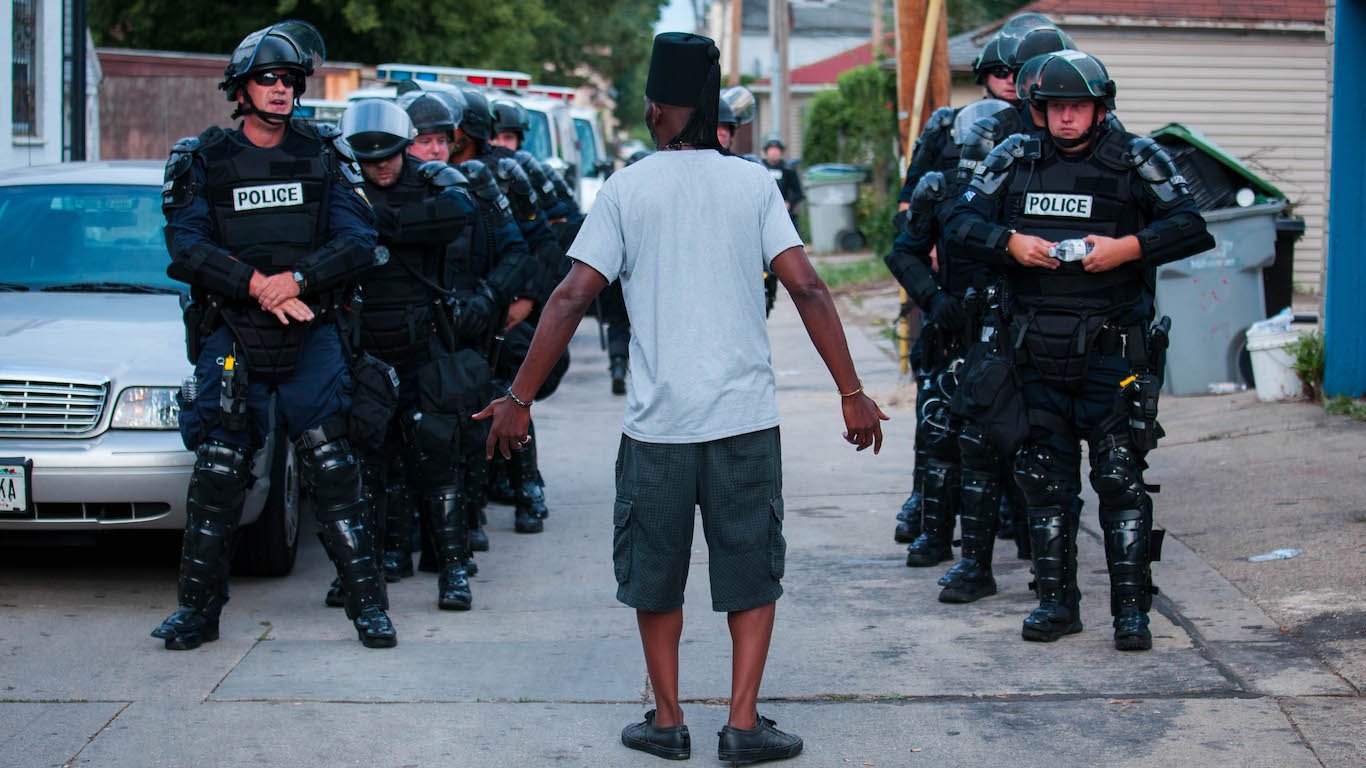
The Human Rights Institute’s study contains additional data on education, homelessness, health care and criminal justice.
Scott Myers-Lipton, a sociology professor at San Jose State, commented, “The Silicon Valley Pain Index shows that white supremacy is operating in most all of the institutions and systems in Santa Clara County, whether it be in the criminal justice system, the economy, education, healthcare, or housing.”
[recirclink id=715303][wallst_email_signup]
Contact [email protected] for any questions or corrections.