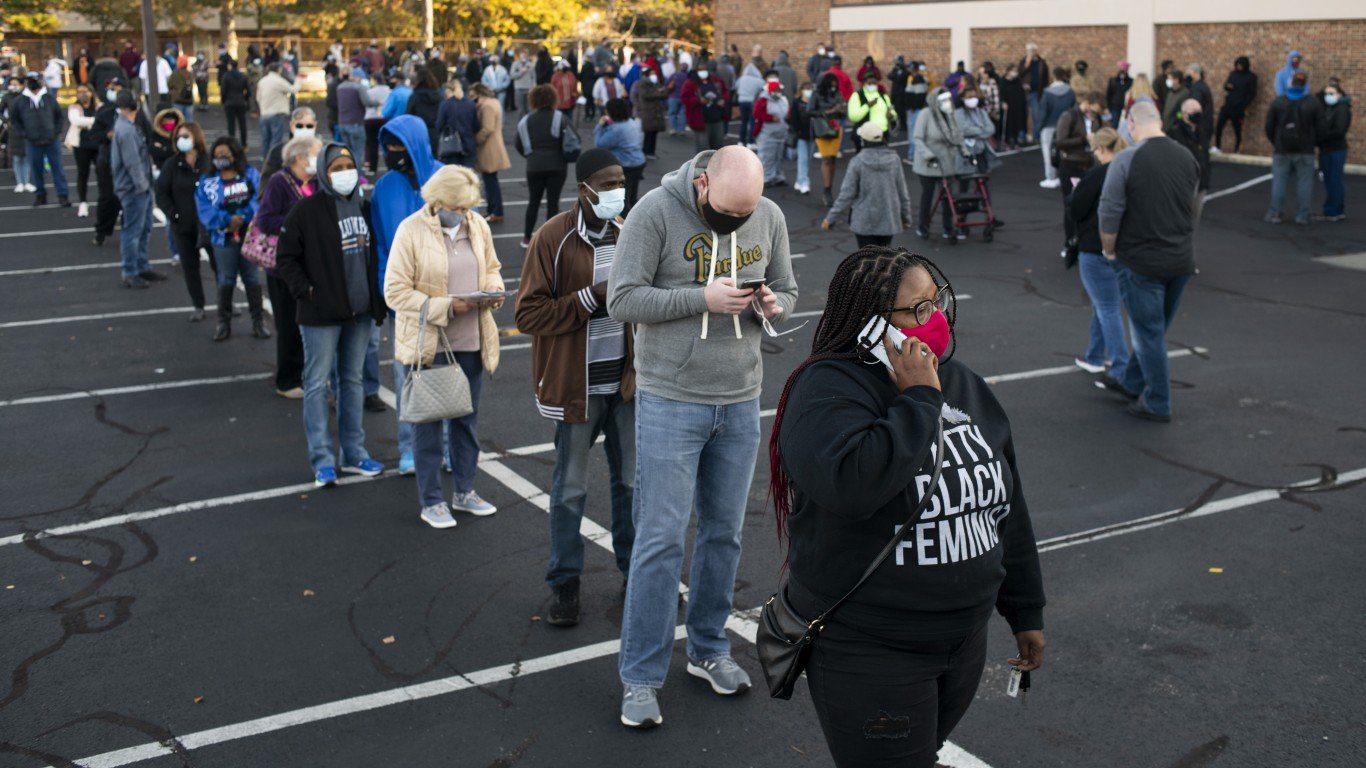
Household incomes vary from state to state, but they also vary significantly within a state, from district to district. In the United States, the median household income has risen to $61,372 in 2017, a 1.8% increase from the year before.
About half of all 435 districts represented in the House of Representatives have median household incomes below the national median.
In Texas, which has 36 congressional districts, the difference between the richest and poorest district is more than $57,000 – median income in the richest district is $95,235, 2.5 times the 37,977 income in the poorest district. Such discrepancies are notable in states with few districts as well, even if the gap is smaller. The median household income in Arizona’s nine districts vary by $30,000.
Click here to see the 3 richest districts.
Click here to see the 3 poorest districts.
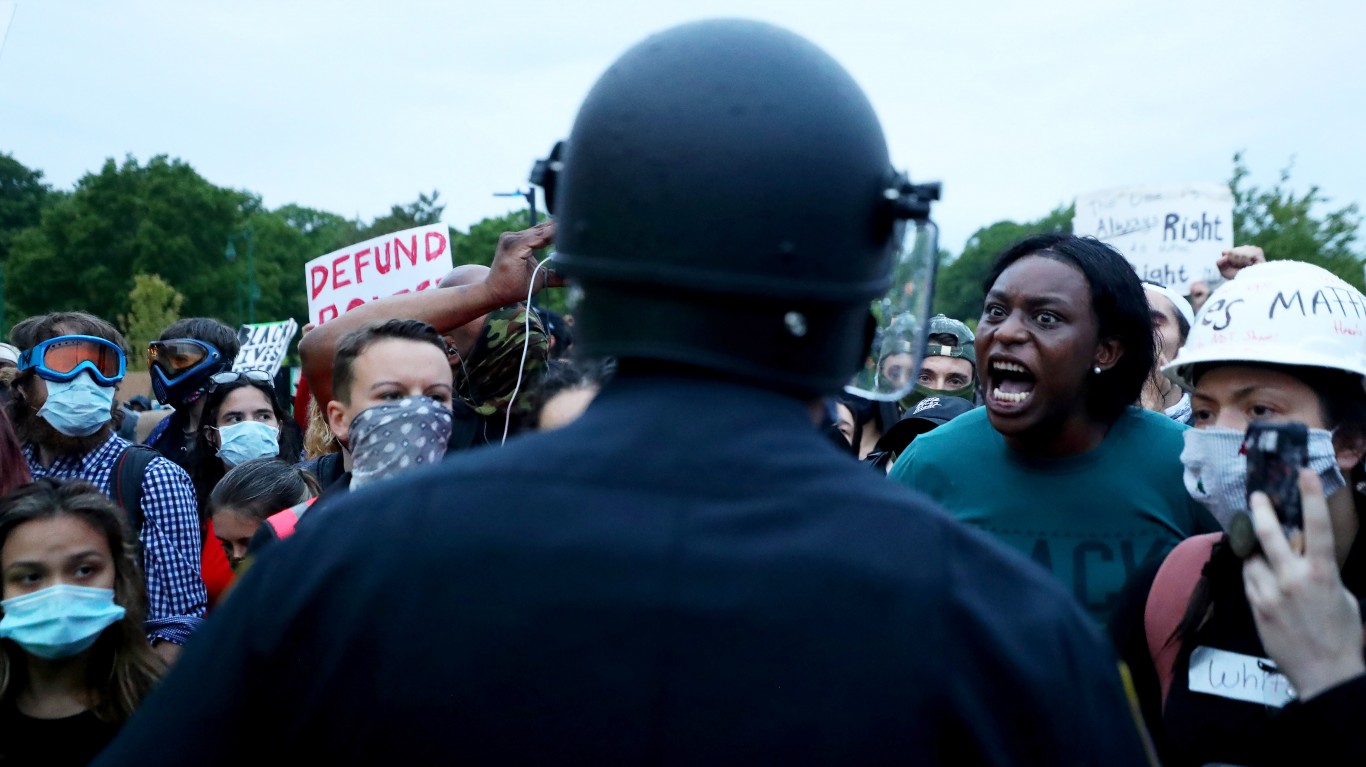
Politics is intertwined with money, but whether a direct correlation between income and political party exists is questionable. Seven of the 10 richest districts are represented by a Democrat, but the ratio is similar with poor districts, too, as six of the 10 poorest districts also are represented by Democrats (two seats are vacant).
To determine the poorest and richest districts, 24/7 Wall St. reviewed the median household income for all 434 districts based on the 2017 Census.
3 Richest Districts

3. State: Virginia
> District: 10
> House representative: Barbara Comstock (R)
> Median household income: $122,092
> 2017 population: 850,118
Considering that several high-tech, health, and defense companies are located in this Northern Virginia and Shenandoah Valley where the 10th district is located, it is not surprising that incomes are among the highest in the country. Part of the district also is very close to downtown Washington D.C., making it a convenient home for many federal employees. The area’s unemployment rate is 3.6%, slightly lower than the national average of 3.7%. Over 58.0% of the population is white, 7.1% black, 15.7% Asian, and 14.3% Hispanic.
[recirclink id=488456]
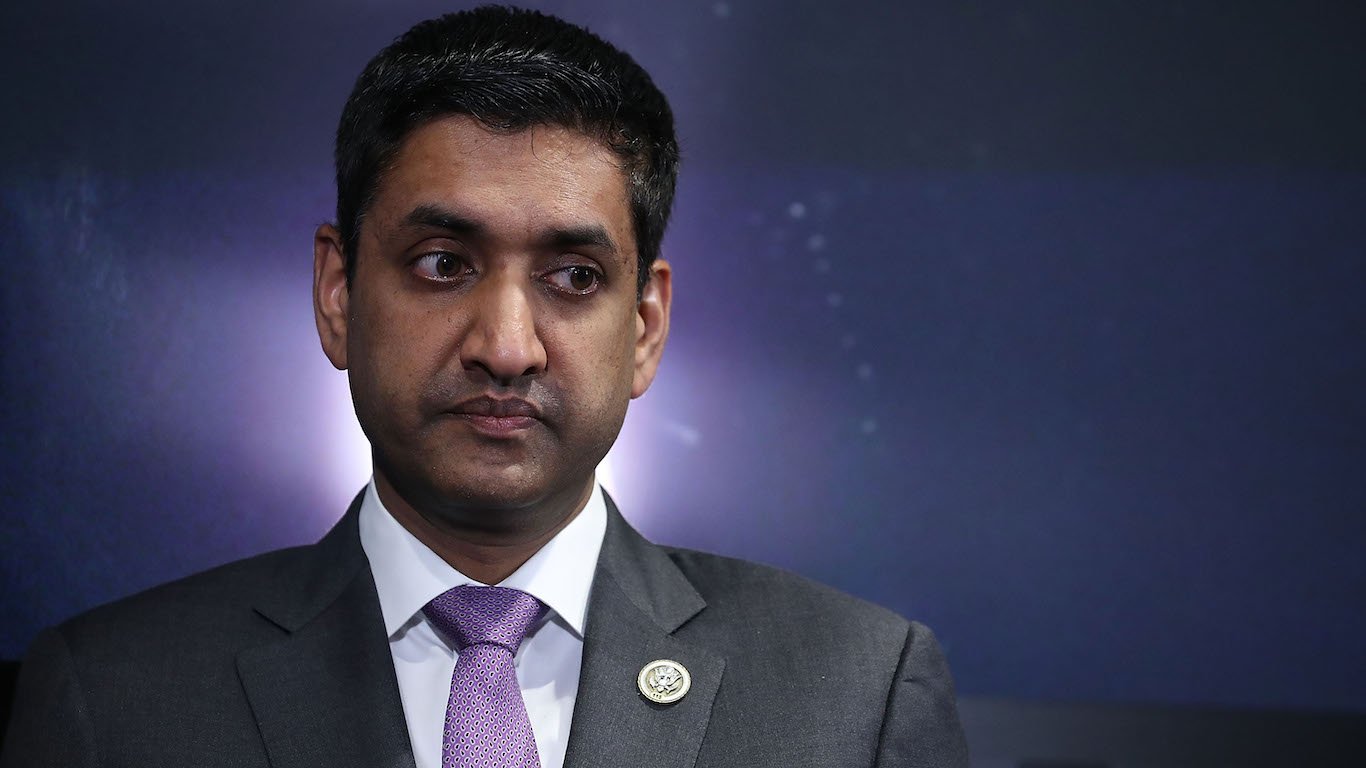
2. State: California
> District: 17
> House representative: Ro Khanna (D)
> Median household income: $124,131
> 2017 population: 771,078
California’s 17th Congressional District is home to the cities of Fremont, Milpitas, Newark, San Jose, Santa Clara, Sunnyvale, and Cupertino. Cupertino is known as the headquarter of Apple. The fact that Apple is worth about $1 trillion and is among the most valuable companies in the world helps explain why residents are among the richest in the United States. The area’s unemployment rate is 3.8%. A little more than a fifth of the population is white, 3% black, 55.2% Asian, and 15% Hispanic.
[in-text-ad]
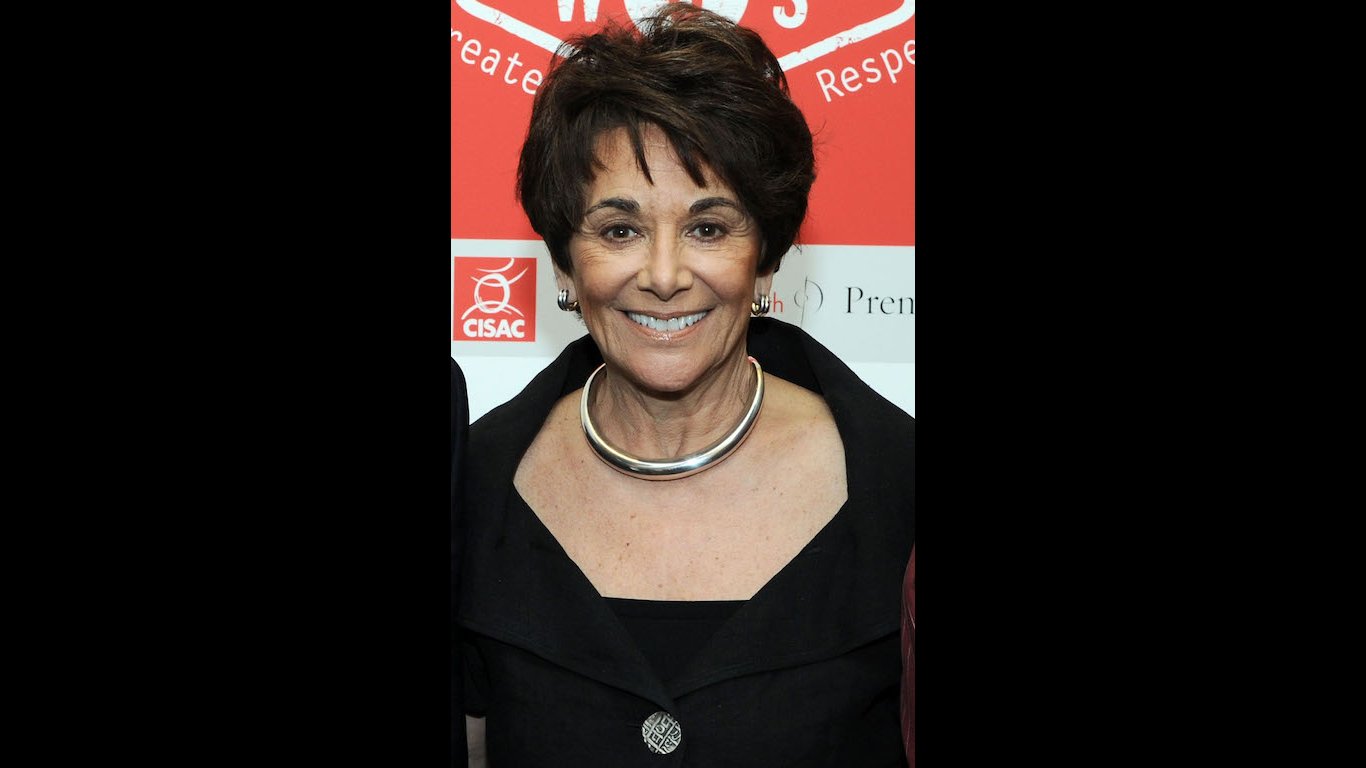
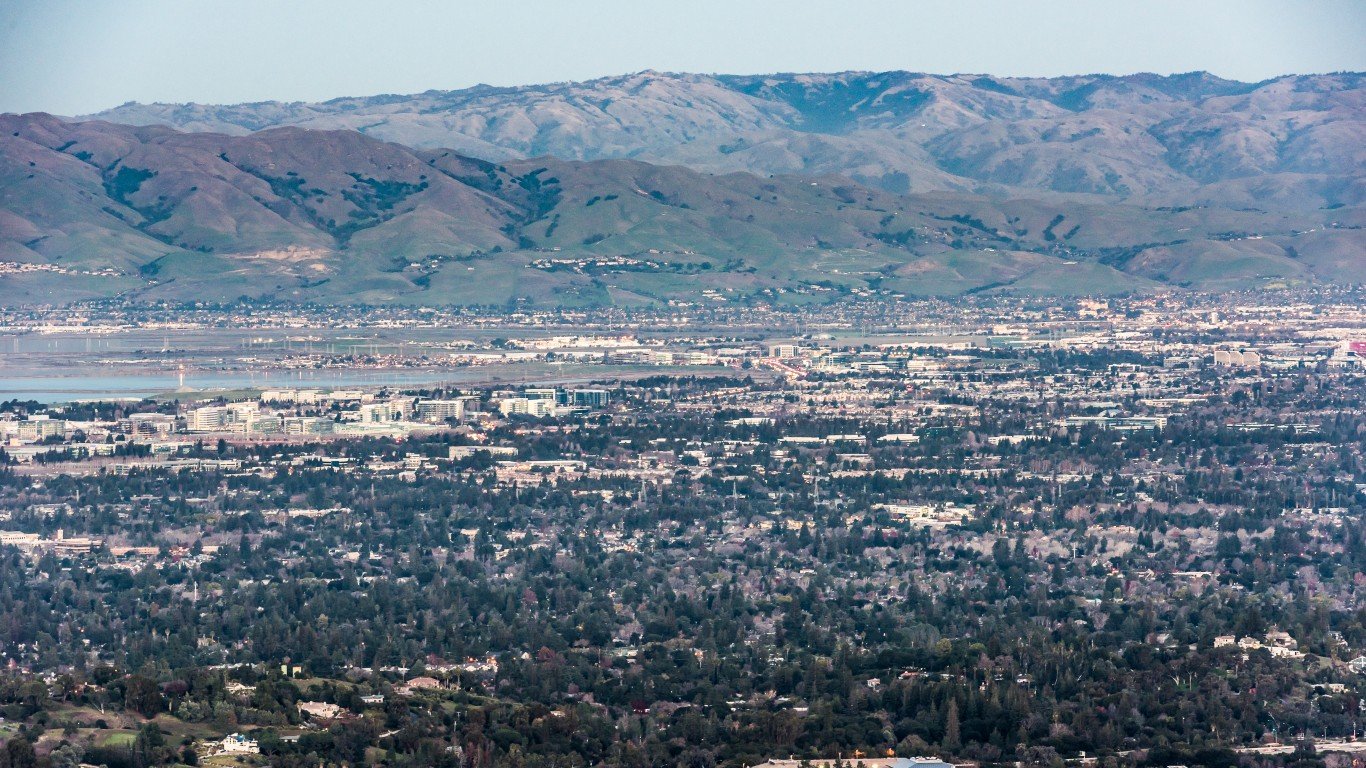
1. State: California
> District: 18
> House representative: Anna G. Eshoo (D)
> Median household income: $134,077
> 2017 population: 742,728
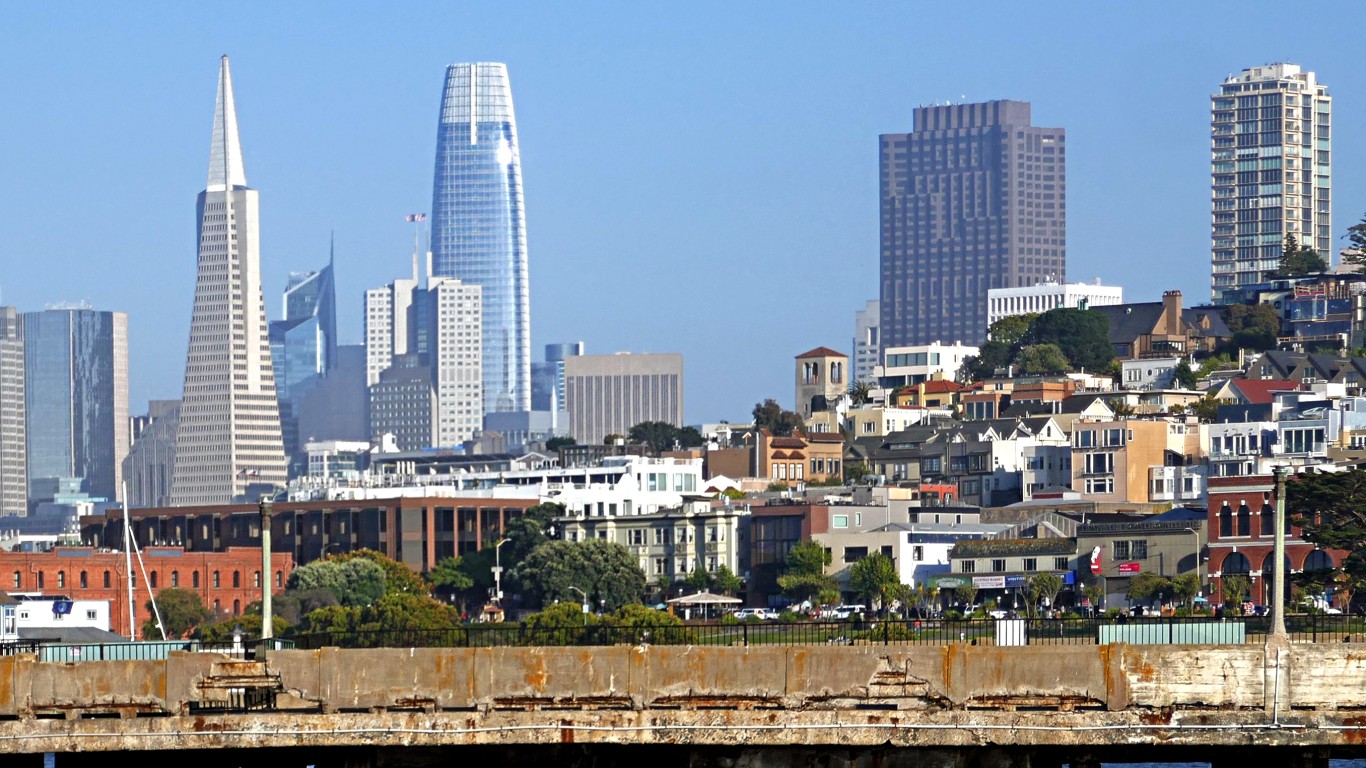
The richest district in the country is home to the famed Silicon Valley. The 18th district is located between San Francisco, Santa Cruz, and San Jose, and it includes portions of San Mateo, Santa Clara, and Santa Cruz counties. LinkedIn, Netflix, HP, and Google are not the only high-paying employers in the 18th. NASA Ames Research Center is just one of several prominent government agencies with locations in the district. The area’s unemployment rate is 3.7%. Slightly more than 52.6% of the population is white, 1.6% is black, 24.0% is Asian, and 16.6% Hispanic.
3 Poorest Districts
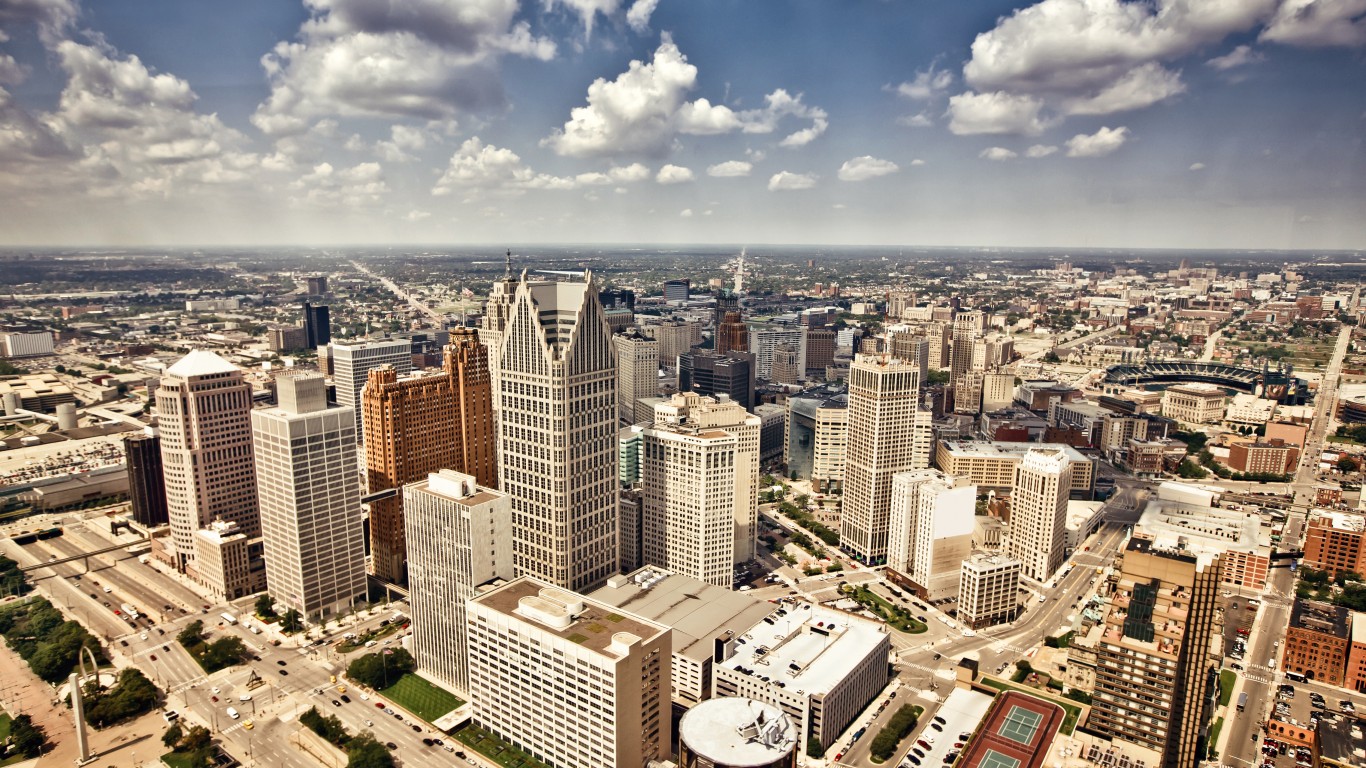
3. State: Michigan
> District: 13
> House representative: To be elected on Nov. 6, 2018
> Median household income: $35,365
> 2017 population: 674,157
The 13th district is located in the southeastern region of the lower peninsula of Michigan. Parts of Wayne County, including some areas of Detroit, comprise the district. The unemployment rate is 12.2%, the fourth highest among U.S. districts. Nearly 30% of residents live below the poverty line. A third of the population is white, 53.6% is black, 1.6% is Asian, and 8.4% is Hispanic.
[in-text-ad]
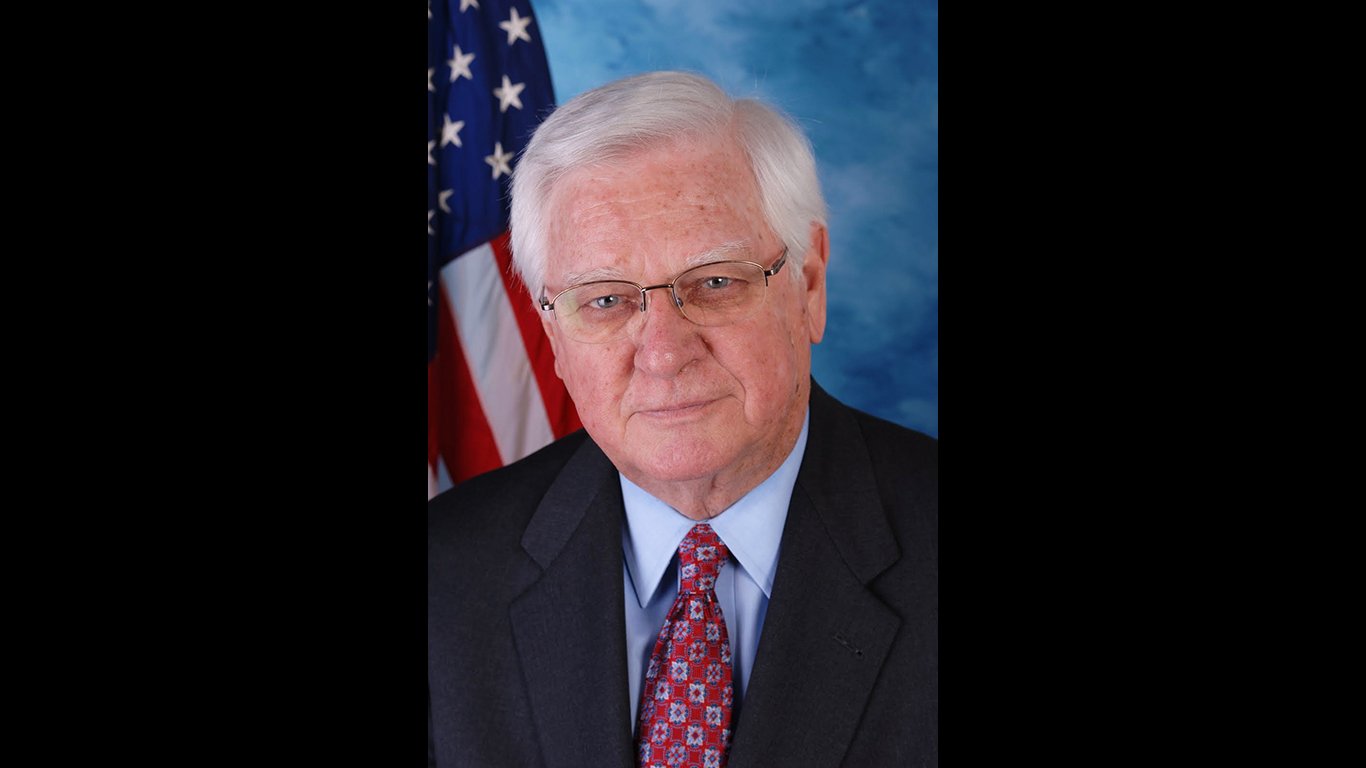
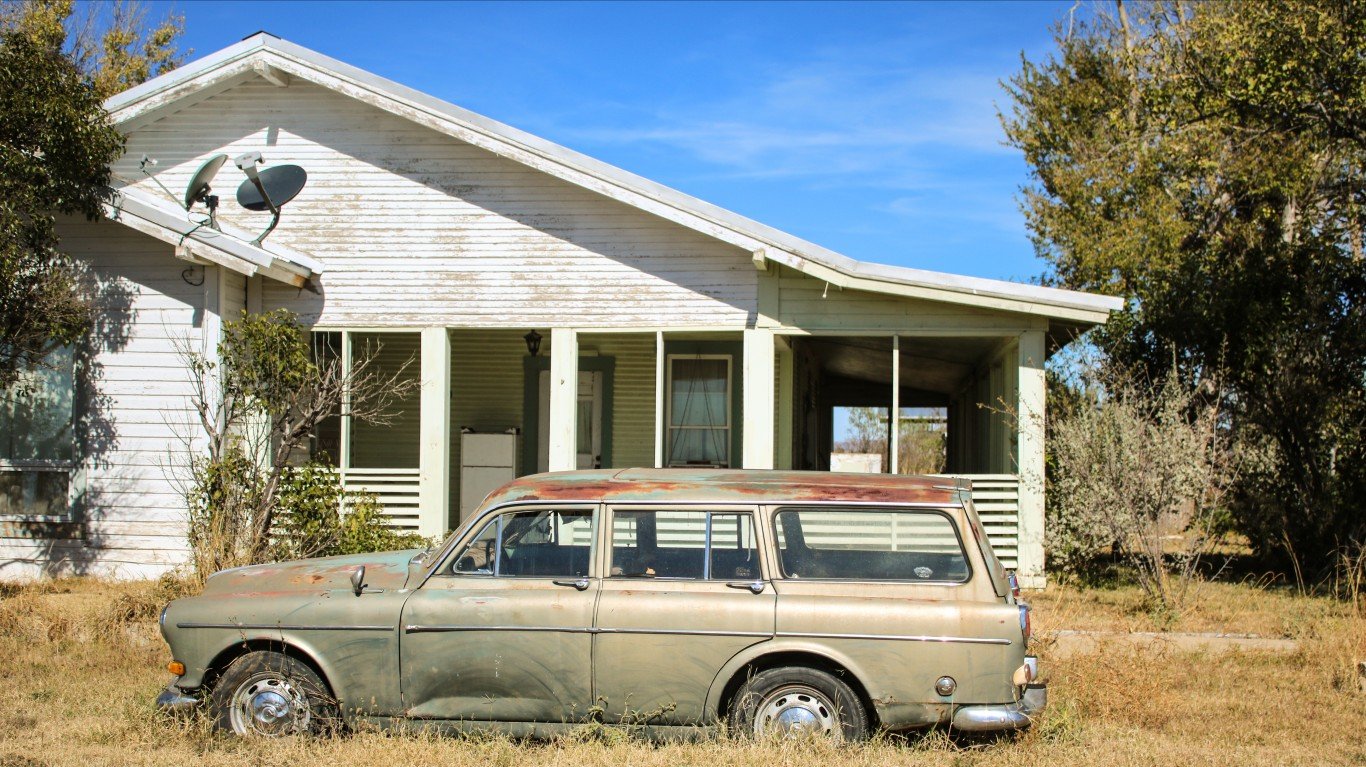
2. State: Kentucky
> District: 5
> House representative: Harold Rogers (R)
> Median household income: $31,731
> 2017 population: 696,337
Kentucky’s 5th Congressional District is located in the southeastern Kentucky. Harold Rogers has represented the district since 1981. The area’s unemployment rate of 8.4% is in the top 20 highest unemployment rates. The industries that employ the most people are retail, manufacturing, and construction. Close to 30% of residents live below the poverty line. The population is mostly white, at 96.1%, 1.3% is black, 0.4% Asian, and 0.8% Hispanic.
[in-text-ad-2]
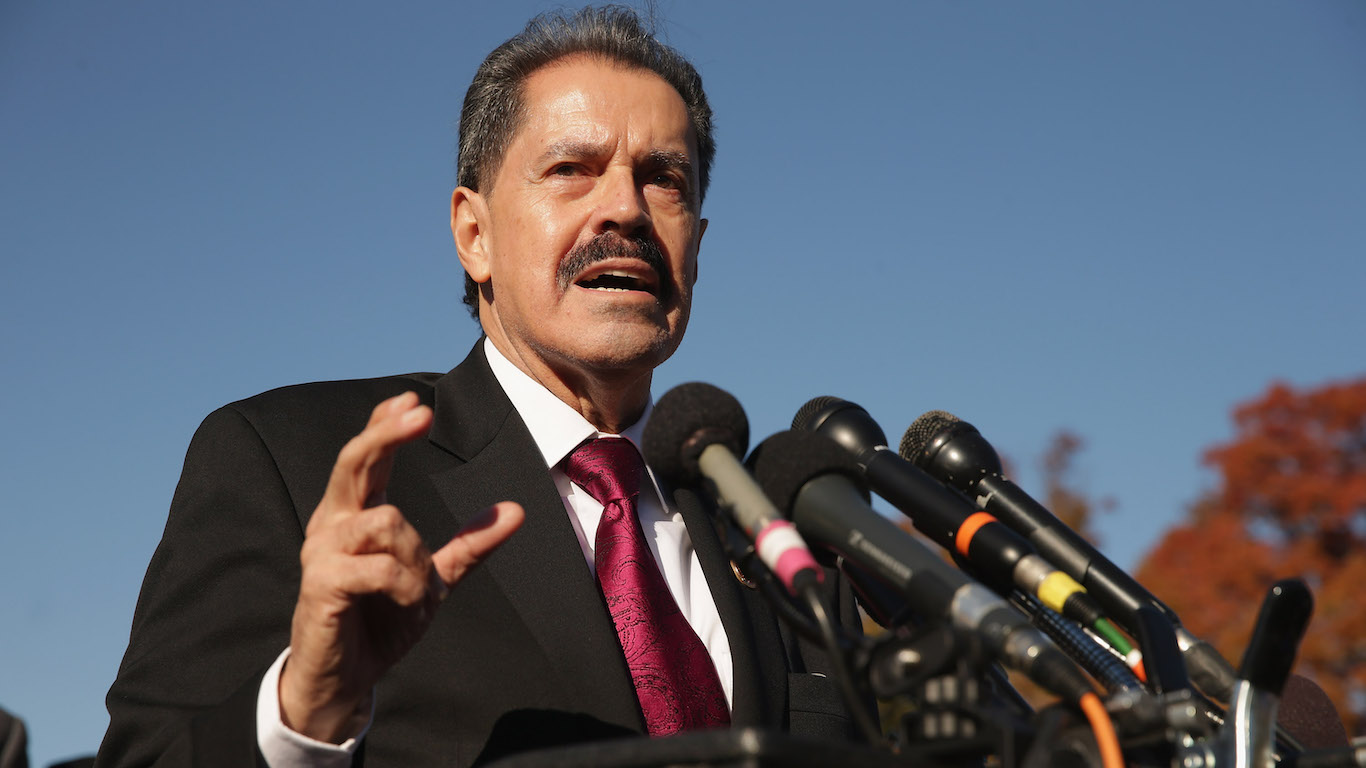
1. State: New York
> District: 15
> House representative: Jose E. Serrano (D)
> Median household income: $28,042
> 2017 population:781,143
The 15th Congressional District includes parts of Harlem, the Bronx, and East Rivers. The most famous sites in the district are Fordham University and Yankee Stadium, home to the New York Yankees and New York City Football Club. The area’s unemployment rate of 13.4% is the highest among all 435 districts. Over 36% of residents live in poverty. More than 66.0% of residents are Hispanic, 27.8% are black, 2.5% are white, and 1.7% are Asian.
Contact [email protected] for any questions or corrections.