Despite decades of legislation meant to improve the economic status, education and legal rights of Black Americans, almost nothing has come from these efforts. White household wealth is eight times greater than that of Black households according to Brookings. Unemployment rates are persistently higher, often by more than 50%. A study by Pew showed that four out of 10 Black Americans “are doubtful that the U.S. will ever achieve racial equality.” A Washington Post article titled “These numbers show that black and white people live in two different Americas” took readers through an extensive list of areas where the gulf between the two races is huge.
[in-text-ad]
While no area in America is free from discrimination or racial disparities, in a number of U.S. metro areas the differences are much more stark. In these areas, there are significant gaps in income, poverty, educational attainment, unemployment and other measures between Black and white residents.
To determine the worst city for Black Americans, 24/7 Wall St. created an index of eight variables measuring racial socioeconomic gaps in each of the nation’s 383 metropolitan areas. For each city, we evaluated the gap between white and Black residents in poverty, high school and college education, income, homeownership, unemployment, mortality and incarceration. Data came from the U.S. Census Bureau’s American Community Survey (ACS), the Centers for Disease Control and Prevention (CDC) and the Bureau of Justice Statistics.
[nativounit]
Of the 20 cities we considered, 13 are located in the Midwest, six are in the Northeast and just one metro area is in the West. In each of these cities, white median household incomes are tens of thousands of dollars higher than Black median household incomes, and poverty rates are also much higher. Black residents in these metro areas are much less likely to hold a high school diploma or college degree than white residents. Lower levels of high school attainment can drive down wages and make it more difficult to find a job. Unemployment rates are also far higher among the Black labor force.
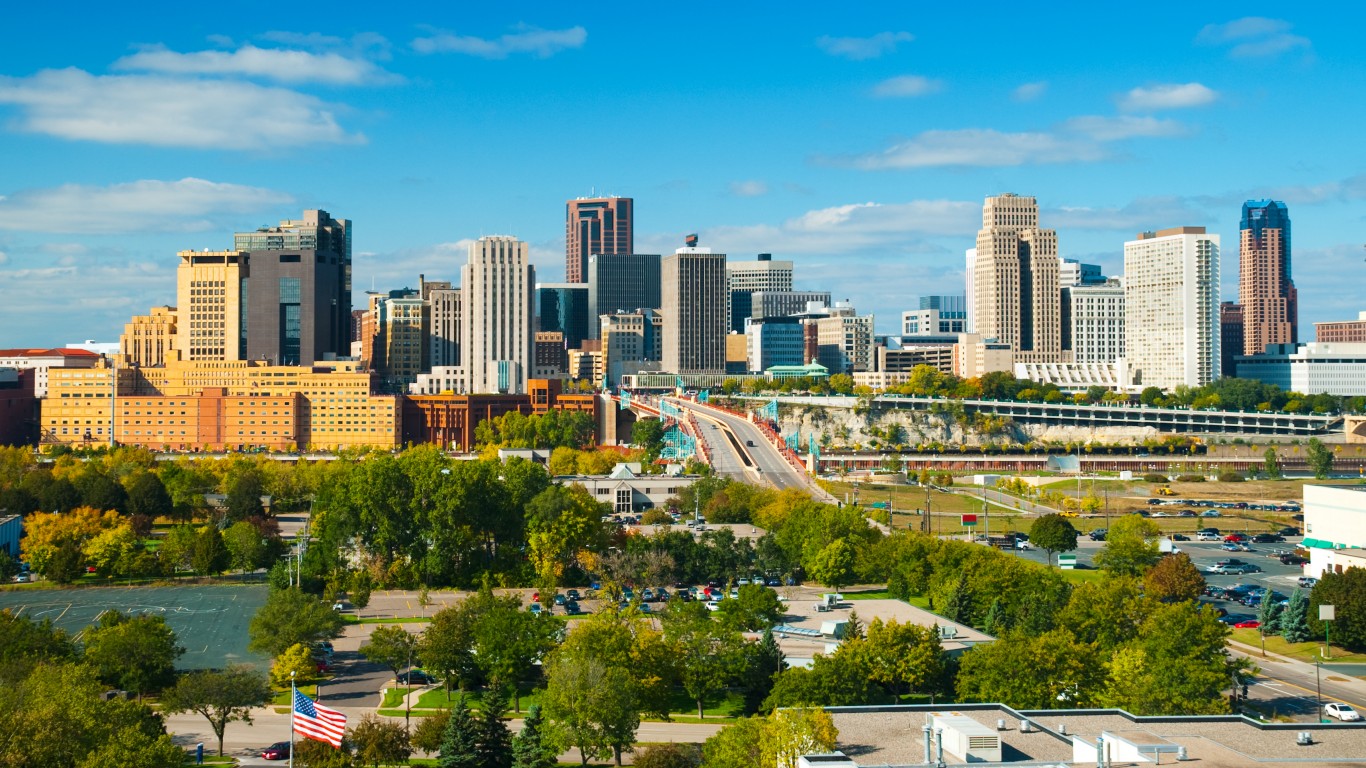
The worst city for Black Americans is St. Cloud, Minnesota. Here are the details:
- Black population: 11,768 (5.9% of total)
- Black median income: $26,585 (41.1% of white income)
- Unemployment: 17.2% (Black); 3.4% (white)
- Homeownership rate: 8.2% (Black); 72.3% (white)
A number of socioeconomic indicators are significantly better among white area residents than among Black residents in the St. Cloud metro area of central Minnesota. White households have a median annual income of $64,703, well more than double the Black median household income. Fewer than 10% of white St. Cloud residents live below the poverty line, yet nearly half of all Black residents do, at 47.7%
The St. Cloud area has the second-largest gap in Black and white high school attainment among all U.S. metro areas. That rate is 94.0% for white adults and just 60.7% for Black adults. This educational gap may contribute to the relatively high unemployment rate for Black members of the St. Cloud labor force. The area’s Black unemployment rate is one of the higher ones in the country, at 17.2%. The white unemployment rate is relatively low, at just 3.4%. For context, the comparable U.S. unemployment rate is 5.3%.
The way that 24/7 Wall St. created its index racial socioeconomic gaps means cities were ranked based on the relative differences between Black and white residents and not on absolute levels of socioeconomic development, which, if used for the ranking, would result in a list of cities with the worst social and economic measures for anyone regardless of their race.
For each measure, we constructed an index of the gaps between Black and white Americans. The index was standardized using interdecile normalization so outliers in the data did not skew results.
We excluded metro areas where Black residents comprise less than 5% of the population or where data limitations made comparisons between racial groups impossible.
Within the index, we considered data from the ACS on median household income, poverty, adult high school and bachelor’s degree attainment, homeownership and unemployment for each racial group. All ACS data are five-year estimates for 2019, the most recent year available.
Data on the number of prisoners in state or federal correctional facilities within a state by race are for 2019 and came from the Bureau of Justice Statistics. These figures were adjusted for the population using ACS data. Because states, rather than metro areas, are responsible for the prison population, incarceration rates are for the state where the metro area is located. If a metro area spans more than one state, we used the state in which the metro area’s principal city is located.
We also included age-adjusted mortality rates for the years 2017 to 2019 from the CDC. We aggregated mortality rates from the county to the metropolitan level using boundary definitions from the Census Bureau. Incarceration and mortality rates are per 100,000 residents.
Click here to see all the worst U.S. cities for Black Americans.
[wallst_email_signup]
Contact [email protected] for any questions or corrections.