
Certain states consistently top the list of the United States most wealthy and opulent. These states have several factors in common, including booming economies and residents with high incomes. Multiple east coast states make this list, including Massachusetts, Maryland, and New Jersey. Because these states are home to some of the country’s top schools, they consistently churn out highly educated residents positioned to be high earners.
New Jersey benefits from a strong pharmaceutical industry, while Massachusetts has grown synonymous with its expanding tech industry. In Maryland, suburban areas get a boost from their proximity to the nation’s capital.
Some states are obviously wealthier than others. However, each state, no matter its economic standing, has a wealthiest county.
For example, Virginia, a state that does not rank at the top of the income list, still has excessively wealthy areas. Additionally, the relatively poor state of Tennessee is home to the economically booming Williamson County, where the median income exceeds $120K.
Using five-year estimates from the Census Bureau’s American Community Survey, 24/7 Wall St. identified the richest county, or county equivalent, in every state. Within each state, counties are ranked by median household income. All supplemental data are also five-year estimates from the 2022 ACS. Due to recent changes in county distinctions, ACS data for Connecticut is current as of 2021. Counties with incomplete data were excluded from analysis.
Why We’re Telling You

Wealth in America isn’t evenly distributed, with some areas thriving due to factors like educational level, job market and/or proximity to cities where jobs are readily available, and housing costs. But wealth undoubtedly influences quality of life. Although there isn’t always a direct correlation between money and happiness, living in a wealthier and stable area does offer its benefits. If you’re looking to move, learn which counties have robust job markets, strong economies, and great communities.
Here is the wealthiest county in every state:
Alabama: Shelby County

- Median annual household income: $90,618 (Alabama: $59,609)
- Households earning $200,000+ annually: 13.3% (Alabama: 6.5%)
- Median home value: $276,500 (Alabama: $179,400)
- Adults with a bachelor’s degree or higher: 45.6% (Alabama: 27.2%)
- 5-yr. avg. unemployment rate: 3.1% (Alabama: 5.1%)
- County seat: Columbiana
- No. of counties considered in state: 67
Alaska: Aleutians West Census Area

- Median annual household income: $100,662 (Alaska: $86,370)
- Households earning $200,000+ annually: 12.8% (Alaska: 12.3%)
- Median home value: $377,100 (Alaska: $318,000)
- Adults with a bachelor’s degree or higher: 15.4% (Alaska: 30.7%)
- 5-yr. avg. unemployment rate: 3.0% (Alaska: 6.0%)
- County seat: None
- No. of county equivalents considered in state: 30
Arizona: Maricopa County

- Median annual household income: $80,675 (Arizona: $72,581)
- Households earning $200,000+ annually: 11.3% (Arizona: 9.2%)
- Median home value: $371,400 (Arizona: $321,400)
- Adults with a bachelor’s degree or higher: 35.0% (Arizona: 31.8%)
- 5-yr. avg. unemployment rate: 4.7% (Arizona: 5.3%)
- County seat: Phoenix
- No. of counties considered in state: 15
Arkansas: Benton County

- Median annual household income: $85,269 (Arkansas: $56,335)
- Households earning $200,000+ annually: 12.8% (Arkansas: 5.6%)
- Median home value: $254,000 (Arkansas: $162,400)
- Adults with a bachelor’s degree or higher: 35.5% (Arkansas: 24.7%)
- 5-yr. avg. unemployment rate: 2.8% (Arkansas: 5.1%)
- County seat: Bentonville
- No. of counties considered in state: 75
California: Santa Clara County

- Median annual household income: $153,792 (California: $91,905)
- Households earning $200,000+ annually: 38.0% (California: 17.9%)
- Median home value: $1,316,800 (California: $659,300)
- Adults with a bachelor’s degree or higher: 55.3% (California: 35.9%)
- 5-yr. avg. unemployment rate: 4.4% (California: 6.4%)
- County seat: San Jose
- No. of counties considered in state: 58
Colorado: Douglas County

- Median annual household income: $139,010 (Colorado: $87,598)
- Households earning $200,000+ annually: 28.1% (Colorado: 13.9%)
- Median home value: $635,100 (Colorado: $465,900)
- Adults with a bachelor’s degree or higher: 60.0% (Colorado: 43.7%)
- 5-yr. avg. unemployment rate: 3.4% (Colorado: 4.5%)
- County seat: Castle Rock
- No. of counties considered in state: 64
Connecticut: Fairfield County

- Median annual household income: $101,194 (Connecticut: $83,572)
- Households earning $200,000+ annually: 23.9% (Connecticut: 14.5%)
- Median home value: $443,100 (Connecticut: $286,700)
- Adults with a bachelor’s degree or higher: 49.2% (Connecticut: 40.6%)
- 5-yr. avg. unemployment rate: 6.3% (Connecticut: 6.0%)
- County seat: None
- No. of counties considered in state: 8
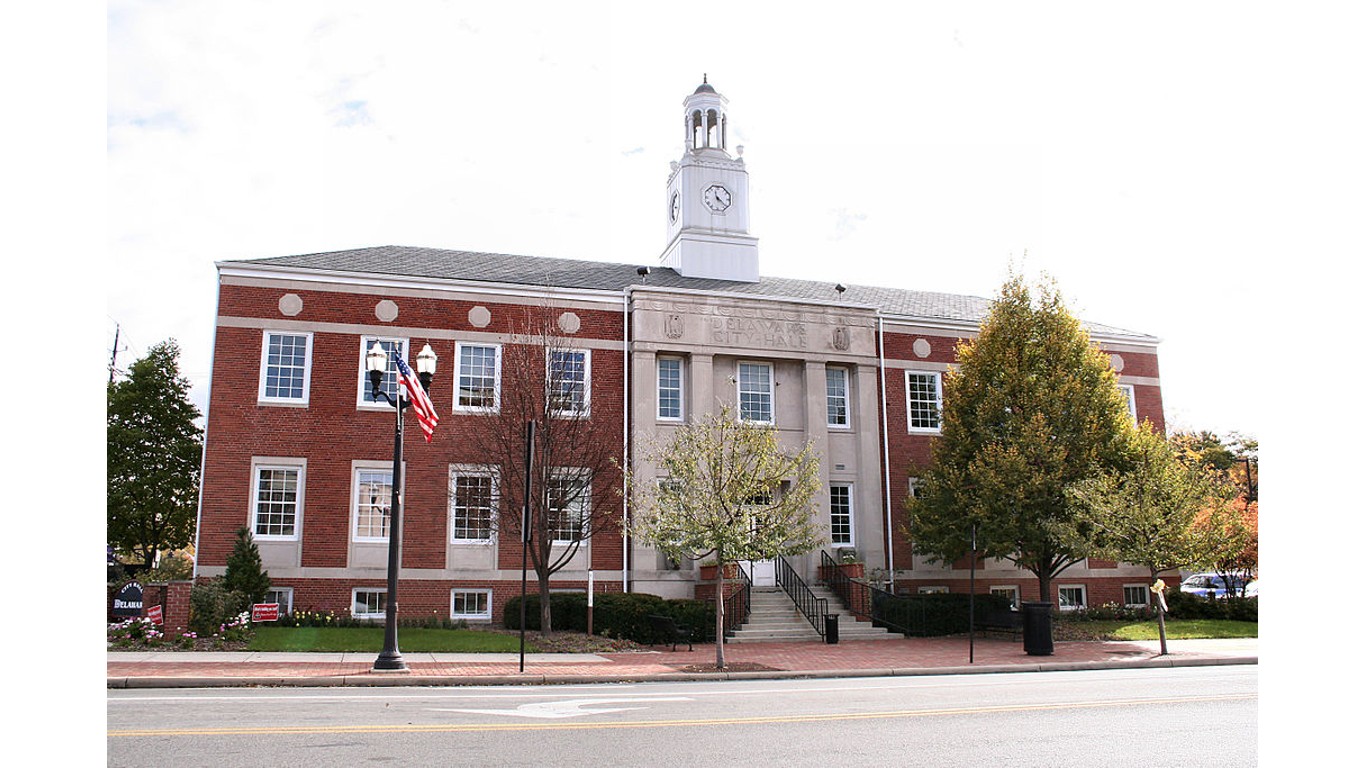
Delaware: New Castle County
- Median annual household income: $85,309 (Delaware: $79,325)
- Households earning $200,000+ annually: 12.7% (Delaware: 10.3%)
- Median home value: $312,000 (Delaware: $305,200)
- Adults with a bachelor’s degree or higher: 38.3% (Delaware: 34.5%)
- 5-yr. avg. unemployment rate: 5.4% (Delaware: 5.4%)
- County seat: Wilmington
- No. of counties considered in state: 3
Florida: St. Johns County

- Median annual household income: $100,020 (Florida: $67,917)
- Households earning $200,000+ annually: 18.7% (Florida: 9.0%)
- Median home value: $416,100 (Florida: $292,200)
- Adults with a bachelor’s degree or higher: 47.4% (Florida: 32.3%)
- 5-yr. avg. unemployment rate: 4.4% (Florida: 5.0%)
- County seat: St. Augustine
- No. of counties considered in state: 67
Georgia: Forsyth County

- Median annual household income: $131,660 (Georgia: $71,355)
- Households earning $200,000+ annually: 26.7% (Georgia: 10.0%)
- Median home value: $451,100 (Georgia: $245,900)
- Adults with a bachelor’s degree or higher: 56.2% (Georgia: 33.6%)
- 5-yr. avg. unemployment rate: 3.7% (Georgia: 5.2%)
- County seat: Cumming
- No. of counties considered in state: 159
Hawaii: Honolulu County

- Median annual household income: $99,816 (Hawaii: $94,814)
- Households earning $200,000+ annually: 17.3% (Hawaii: 15.9%)
- Median home value: $832,200 (Hawaii: $764,800)
- Adults with a bachelor’s degree or higher: 36.6% (Hawaii: 34.7%)
- 5-yr. avg. unemployment rate: 4.4% (Hawaii: 4.7%)
- County seat: Honolulu
- No. of counties considered in state: 5
Idaho: Teton County

- Median annual household income: $88,906 (Idaho: $70,214)
- Households earning $200,000+ annually: 12.7% (Idaho: 7.3%)
- Median home value: $479,800 (Idaho: $331,600)
- Adults with a bachelor’s degree or higher: 47.1% (Idaho: 30.2%)
- 5-yr. avg. unemployment rate: 1.6% (Idaho: 3.7%)
- County seat: Driggs
- No. of counties considered in state: 44
Illinois: DuPage County

- Median annual household income: $107,035 (Illinois: $78,433)
- Households earning $200,000+ annually: 20.4% (Illinois: 12.1%)
- Median home value: $361,700 (Illinois: $239,100)
- Adults with a bachelor’s degree or higher: 51.1% (Illinois: 36.7%)
- 5-yr. avg. unemployment rate: 4.7% (Illinois: 5.9%)
- County seat: Wheaton
- No. of counties considered in state: 102
Indiana: Hamilton County

- Median annual household income: $114,866 (Indiana: $67,173)
- Households earning $200,000+ annually: 22.8% (Indiana: 6.7%)
- Median home value: $350,900 (Indiana: $183,600)
- Adults with a bachelor’s degree or higher: 60.8% (Indiana: 28.2%)
- 5-yr. avg. unemployment rate: 2.7% (Indiana: 4.5%)
- County seat: Noblesville
- No. of counties considered in state: 92
Iowa: Dallas County

- Median annual household income: $99,533 (Iowa: $70,571)
- Households earning $200,000+ annually: 16.5% (Iowa: 7.1%)
- Median home value: $314,900 (Iowa: $181,600)
- Adults with a bachelor’s degree or higher: 51.5% (Iowa: 30.3%)
- 5-yr. avg. unemployment rate: 3.0% (Iowa: 3.8%)
- County seat: Adel
- No. of counties considered in state: 99
Kansas: Johnson County

- Median annual household income: $103,644 (Kansas: $69,747)
- Households earning $200,000+ annually: 18.1% (Kansas: 8.0%)
- Median home value: $343,300 (Kansas: $189,300)
- Adults with a bachelor’s degree or higher: 56.7% (Kansas: 34.7%)
- 5-yr. avg. unemployment rate: 3.2% (Kansas: 4.0%)
- County seat: Olathe
- No. of counties considered in state: 105
Kentucky: Oldham County

- Median annual household income: $117,334 (Kentucky: $60,183)
- Households earning $200,000+ annually: 21.6% (Kentucky: 6.0%)
- Median home value: $357,500 (Kentucky: $177,000)
- Adults with a bachelor’s degree or higher: 45.4% (Kentucky: 26.5%)
- 5-yr. avg. unemployment rate: 3.9% (Kentucky: 5.1%)
- County seat: La Grange
- No. of counties considered in state: 120
Louisiana: Ascension Parish

- Median annual household income: $93,800 (Louisiana: $57,852)
- Households earning $200,000+ annually: 13.8% (Louisiana: 6.8%)
- Median home value: $255,600 (Louisiana: $198,300)
- Adults with a bachelor’s degree or higher: 29.0% (Louisiana: 26.1%)
- 5-yr. avg. unemployment rate: 4.5% (Louisiana: 6.5%)
- Parish seat: Donaldsonville
- No. of parishes considered in state: 64
Maine: Cumberland County

- Median annual household income: $87,710 (Maine: $68,251)
- Households earning $200,000+ annually: 13.6% (Maine: 7.4%)
- Median home value: $372,900 (Maine: $244,800)
- Adults with a bachelor’s degree or higher: 50.6% (Maine: 34.1%)
- 5-yr. avg. unemployment rate: 3.2% (Maine: 4.0%)
- County seat: Portland
- No. of counties considered in state: 16
Maryland: Howard County

- Median annual household income: $140,971 (Maryland: $98,461)
- Households earning $200,000+ annually: 31.6% (Maryland: 17.9%)
- Median home value: $551,300 (Maryland: $380,500)
- Adults with a bachelor’s degree or higher: 64.0% (Maryland: 42.2%)
- 5-yr. avg. unemployment rate: 3.7% (Maryland: 5.1%)
- County seat: Ellicott City
- No. of counties considered in state: 24
Massachusetts: Nantucket County

- Median annual household income: $135,590 (Massachusetts: $96,505)
- Households earning $200,000+ annually: 31.9% (Massachusetts: 19.3%)
- Median home value: $1,265,600 (Massachusetts: $483,900)
- Adults with a bachelor’s degree or higher: 57.4% (Massachusetts: 45.9%)
- 5-yr. avg. unemployment rate: 5.5% (Massachusetts: 5.3%)
- County seat: Nantucket
- No. of counties considered in state: 14
Michigan: Livingston County
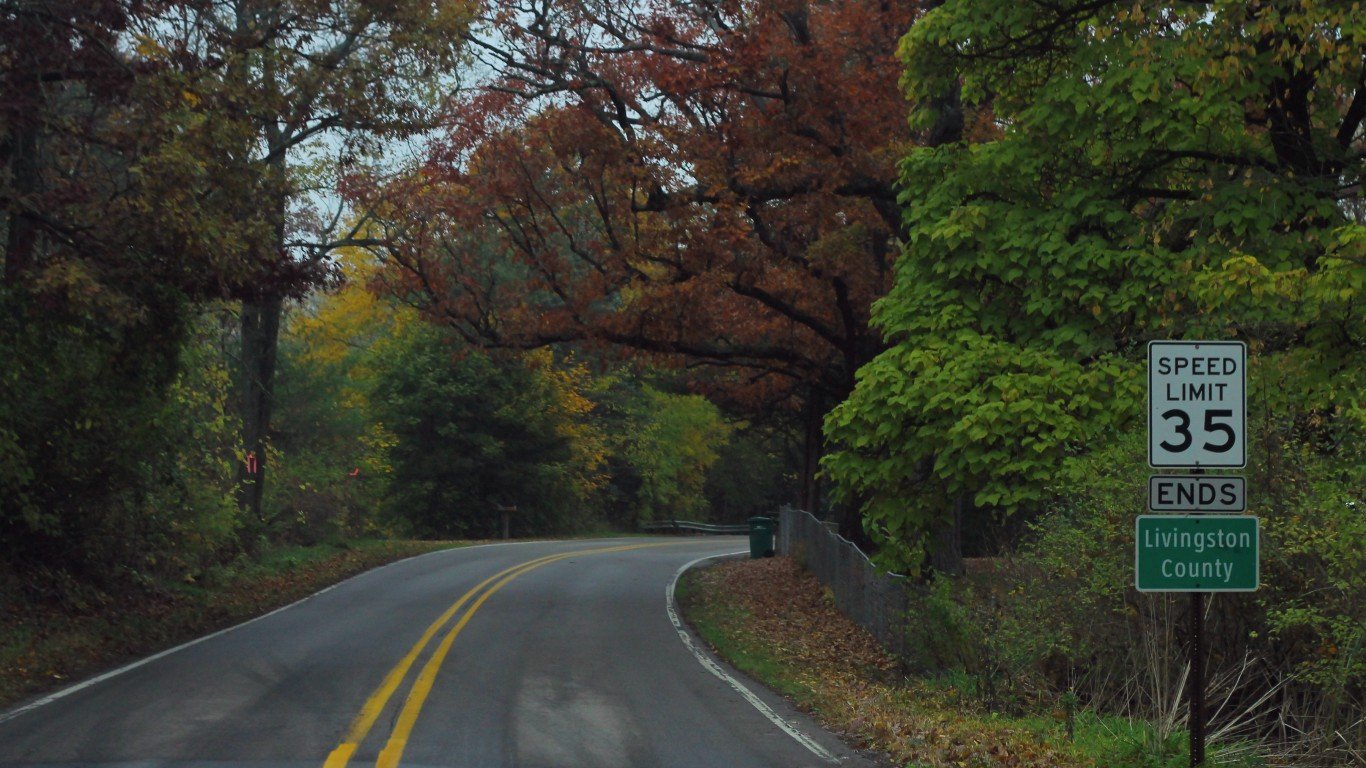
- Median annual household income: $96,135 (Michigan: $68,505)
- Households earning $200,000+ annually: 14.3% (Michigan: 8.2%)
- Median home value: $311,800 (Michigan: $201,100)
- Adults with a bachelor’s degree or higher: 38.1% (Michigan: 31.1%)
- 5-yr. avg. unemployment rate: 4.0% (Michigan: 6.0%)
- County seat: Howell
- No. of counties considered in state: 83
Minnesota: Scott County

- Median annual household income: $118,268 (Minnesota: $84,313)
- Households earning $200,000+ annually: 21.7% (Minnesota: 11.9%)
- Median home value: $376,000 (Minnesota: $286,800)
- Adults with a bachelor’s degree or higher: 42.9% (Minnesota: 38.2%)
- 5-yr. avg. unemployment rate: 3.2% (Minnesota: 4.0%)
- County seat: Shakopee
- No. of counties considered in state: 87
Mississippi: DeSoto County

- Median annual household income: $79,666 (Mississippi: $52,985)
- Households earning $200,000+ annually: 7.4% (Mississippi: 4.7%)
- Median home value: $227,600 (Mississippi: $151,000)
- Adults with a bachelor’s degree or higher: 27.4% (Mississippi: 23.9%)
- 5-yr. avg. unemployment rate: 4.4% (Mississippi: 6.4%)
- County seat: Hernando
- No. of counties considered in state: 82
Missouri: St. Charles County

- Median annual household income: $99,596 (Missouri: $65,920)
- Households earning $200,000+ annually: 13.2% (Missouri: 7.3%)
- Median home value: $278,300 (Missouri: $199,400)
- Adults with a bachelor’s degree or higher: 42.0% (Missouri: 31.2%)
- 5-yr. avg. unemployment rate: 3.1% (Missouri: 4.3%)
- County seat: St. Charles
- No. of counties considered in state: 115
Montana: Gallatin County

- Median annual household income: $83,434 (Montana: $66,341)
- Households earning $200,000+ annually: 12.3% (Montana: 7.2%)
- Median home value: $526,700 (Montana: $305,700)
- Adults with a bachelor’s degree or higher: 52.9% (Montana: 34.0%)
- 5-yr. avg. unemployment rate: 2.1% (Montana: 3.9%)
- County seat: Bozeman
- No. of counties considered in state: 56
Nebraska: Sarpy County

- Median annual household income: $95,911 (Nebraska: $71,722)
- Households earning $200,000+ annually: 12.7% (Nebraska: 7.8%)
- Median home value: $263,000 (Nebraska: $205,600)
- Adults with a bachelor’s degree or higher: 41.2% (Nebraska: 33.5%)
- 5-yr. avg. unemployment rate: 2.5% (Nebraska: 3.1%)
- County seat: Papillion
- No. of counties considered in state: 93
Nevada: Lander County

- Median annual household income: $92,388 (Nevada: $71,646)
- Households earning $200,000+ annually: 9.8% (Nevada: 8.7%)
- Median home value: $198,000 (Nevada: $373,800)
- Adults with a bachelor’s degree or higher: 14.0% (Nevada: 26.5%)
- 5-yr. avg. unemployment rate: 11.7% (Nevada: 7.0%)
- County seat: Battle Mountain
- No. of counties considered in state: 17
New Hampshire: Rockingham County

- Median annual household income: $110,225 (New Hampshire: $90,845)
- Households earning $200,000+ annually: 19.2% (New Hampshire: 14.0%)
- Median home value: $424,100 (New Hampshire: $337,100)
- Adults with a bachelor’s degree or higher: 43.6% (New Hampshire: 39.0%)
- 5-yr. avg. unemployment rate: 3.4% (New Hampshire: 3.6%)
- County seat: Brentwood
- No. of counties considered in state: 10
New Jersey: Hunterdon County

- Median annual household income: $133,534 (New Jersey: $97,126)
- Households earning $200,000+ annually: 29.4% (New Jersey: 19.2%)
- Median home value: $478,600 (New Jersey: $401,400)
- Adults with a bachelor’s degree or higher: 55.5% (New Jersey: 42.3%)
- 5-yr. avg. unemployment rate: 4.6% (New Jersey: 6.2%)
- County seat: Flemington
- No. of counties considered in state: 21
New Mexico: Los Alamos County

- Median annual household income: $135,801 (New Mexico: $58,722)
- Households earning $200,000+ annually: 26.3% (New Mexico: 6.1%)
- Median home value: $412,700 (New Mexico: $216,000)
- Adults with a bachelor’s degree or higher: 69.7% (New Mexico: 29.1%)
- 5-yr. avg. unemployment rate: 1.9% (New Mexico: 6.1%)
- County seat: Los Alamos
- No. of counties considered in state: 33
New York: Nassau County

- Median annual household income: $137,709 (New York: $81,386)
- Households earning $200,000+ annually: 31.4% (New York: 15.2%)
- Median home value: $633,800 (New York: $384,100)
- Adults with a bachelor’s degree or higher: 48.2% (New York: 38.8%)
- 5-yr. avg. unemployment rate: 4.6% (New York: 6.2%)
- County seat: Mineola
- No. of counties considered in state: 62
North Carolina: Wake County

- Median annual household income: $96,734 (North Carolina: $66,186)
- Households earning $200,000+ annually: 17.3% (North Carolina: 8.5%)
- Median home value: $385,700 (North Carolina: $234,900)
- Adults with a bachelor’s degree or higher: 55.7% (North Carolina: 33.9%)
- 5-yr. avg. unemployment rate: 4.2% (North Carolina: 5.0%)
- County seat: Raleigh
- No. of counties considered in state: 100
North Dakota: Divide County

- Median annual household income: $95,938 (North Dakota: $73,959)
- Households earning $200,000+ annually: 13.7% (North Dakota: 8.4%)
- Median home value: $162,900 (North Dakota: $232,500)
- Adults with a bachelor’s degree or higher: 21.3% (North Dakota: 31.4%)
- 5-yr. avg. unemployment rate: 3.2% (North Dakota: 2.9%)
- County seat: Crosby
- No. of counties considered in state: 53
Ohio: Delaware County
- Median annual household income: $123,995 (Ohio: $66,990)
- Households earning $200,000+ annually: 24.9% (Ohio: 7.6%)
- Median home value: $393,000 (Ohio: $183,300)
- Adults with a bachelor’s degree or higher: 57.4% (Ohio: 30.4%)
- 5-yr. avg. unemployment rate: 3.0% (Ohio: 5.0%)
- County seat: Delaware
- No. of counties considered in state: 88
Oklahoma: Canadian County
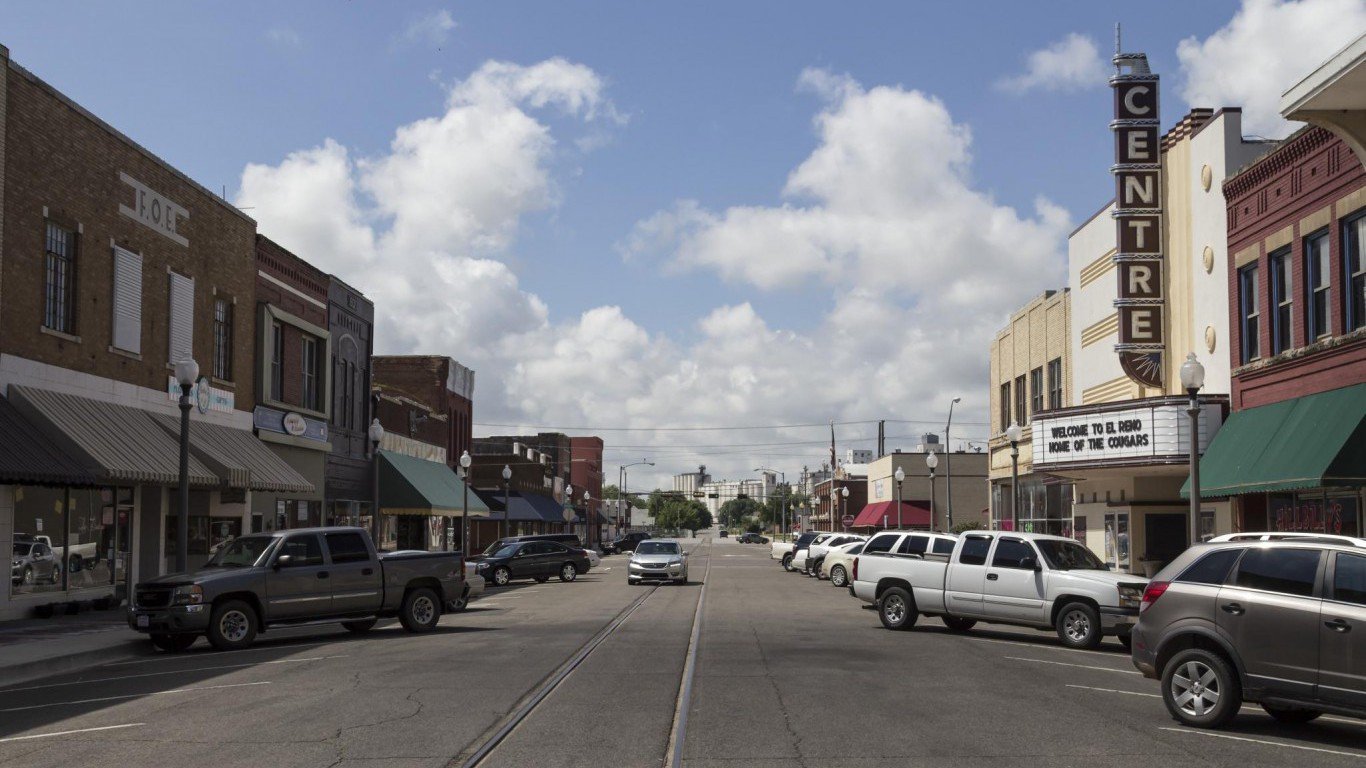
- Median annual household income: $82,364 (Oklahoma: $61,364)
- Households earning $200,000+ annually: 7.2% (Oklahoma: 6.3%)
- Median home value: $212,700 (Oklahoma: $170,500)
- Adults with a bachelor’s degree or higher: 32.0% (Oklahoma: 27.3%)
- 5-yr. avg. unemployment rate: 4.0% (Oklahoma: 4.8%)
- County seat: El Reno
- No. of counties considered in state: 77
Oregon: Washington County

- Median annual household income: $100,121 (Oregon: $76,632)
- Households earning $200,000+ annually: 16.7% (Oregon: 10.5%)
- Median home value: $504,300 (Oregon: $423,100)
- Adults with a bachelor’s degree or higher: 45.8% (Oregon: 35.5%)
- 5-yr. avg. unemployment rate: 4.6% (Oregon: 5.5%)
- County seat: Hillsboro
- No. of counties considered in state: 36
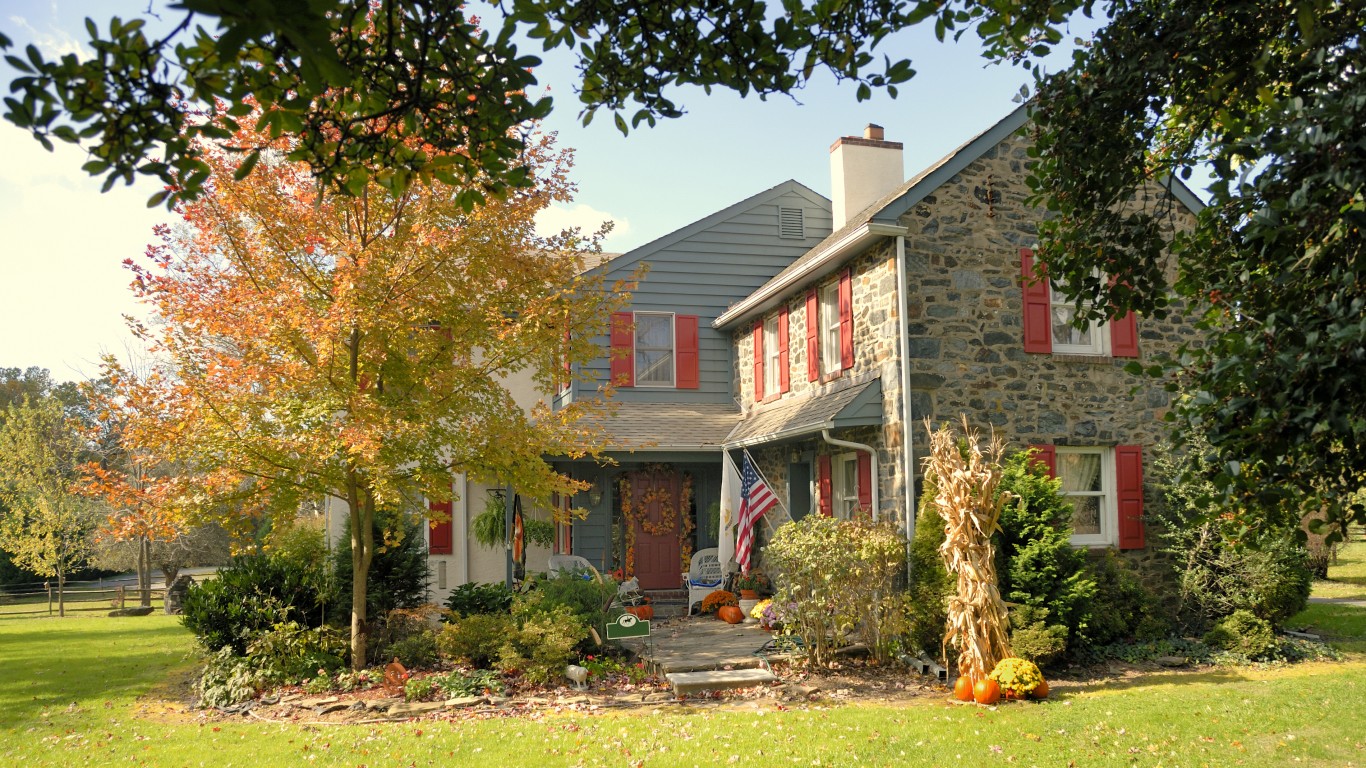
Pennsylvania: Chester County

- Median annual household income: $118,574 (Pennsylvania: $73,170)
- Households earning $200,000+ annually: 25.5% (Pennsylvania: 10.2%)
- Median home value: $435,000 (Pennsylvania: $226,200)
- Adults with a bachelor’s degree or higher: 56.1% (Pennsylvania: 33.8%)
- 5-yr. avg. unemployment rate: 4.0% (Pennsylvania: 5.4%)
- County seat: West Chester
- No. of counties considered in state: 67
Rhode Island: Bristol County

- Median annual household income: $105,875 (Rhode Island: $81,370)
- Households earning $200,000+ annually: 20.7% (Rhode Island: 11.3%)
- Median home value: $443,700 (Rhode Island: $343,100)
- Adults with a bachelor’s degree or higher: 51.4% (Rhode Island: 36.3%)
- 5-yr. avg. unemployment rate: 4.1% (Rhode Island: 5.8%)
- County seat: Bristol
- No. of counties considered in state: 5
South Carolina: Beaufort County

- Median annual household income: $81,260 (South Carolina: $63,623)
- Households earning $200,000+ annually: 13.3% (South Carolina: 7.4%)
- Median home value: $377,900 (South Carolina: $216,200)
- Adults with a bachelor’s degree or higher: 43.4% (South Carolina: 30.6%)
- 5-yr. avg. unemployment rate: 2.9% (South Carolina: 5.1%)
- County seat: Beaufort
- No. of counties considered in state: 46
South Dakota: Lincoln County

- Median annual household income: $92,317 (South Dakota: $69,457)
- Households earning $200,000+ annually: 10.3% (South Dakota: 6.5%)
- Median home value: $292,200 (South Dakota: $219,500)
- Adults with a bachelor’s degree or higher: 41.8% (South Dakota: 30.4%)
- 5-yr. avg. unemployment rate: 1.4% (South Dakota: 3.1%)
- County seat: Canton
- No. of counties considered in state: 66
Tennessee: Williamson County

- Median annual household income: $125,943 (Tennessee: $64,035)
- Households earning $200,000+ annually: 27.1% (Tennessee: 7.3%)
- Median home value: $611,100 (Tennessee: $232,100)
- Adults with a bachelor’s degree or higher: 62.0% (Tennessee: 29.7%)
- 5-yr. avg. unemployment rate: 2.1% (Tennessee: 5.0%)
- County seat: Franklin
- No. of counties considered in state: 95
Texas: Rockwall County

- Median annual household income: $121,303 (Texas: $73,035)
- Households earning $200,000+ annually: 22.1% (Texas: 10.6%)
- Median home value: $363,500 (Texas: $238,000)
- Adults with a bachelor’s degree or higher: 43.9% (Texas: 32.3%)
- 5-yr. avg. unemployment rate: 3.9% (Texas: 5.2%)
- County seat: Rockwall
- No. of counties considered in state: 253
Utah: Summit County

- Median annual household income: $126,392 (Utah: $86,833)
- Households earning $200,000+ annually: 29.6% (Utah: 11.0%)
- Median home value: $895,100 (Utah: $408,500)
- Adults with a bachelor’s degree or higher: 57.4% (Utah: 36.1%)
- 5-yr. avg. unemployment rate: 2.3% (Utah: 3.3%)
- County seat: Coalville
- No. of counties considered in state: 29
Vermont: Chittenden County

- Median annual household income: $89,494 (Vermont: $74,014)
- Households earning $200,000+ annually: 13.5% (Vermont: 8.9%)
- Median home value: $378,300 (Vermont: $272,400)
- Adults with a bachelor’s degree or higher: 55.7% (Vermont: 41.7%)
- 5-yr. avg. unemployment rate: 3.9% (Vermont: 3.8%)
- County seat: Burlington
- No. of counties considered in state: 14
Virginia: Loudoun County
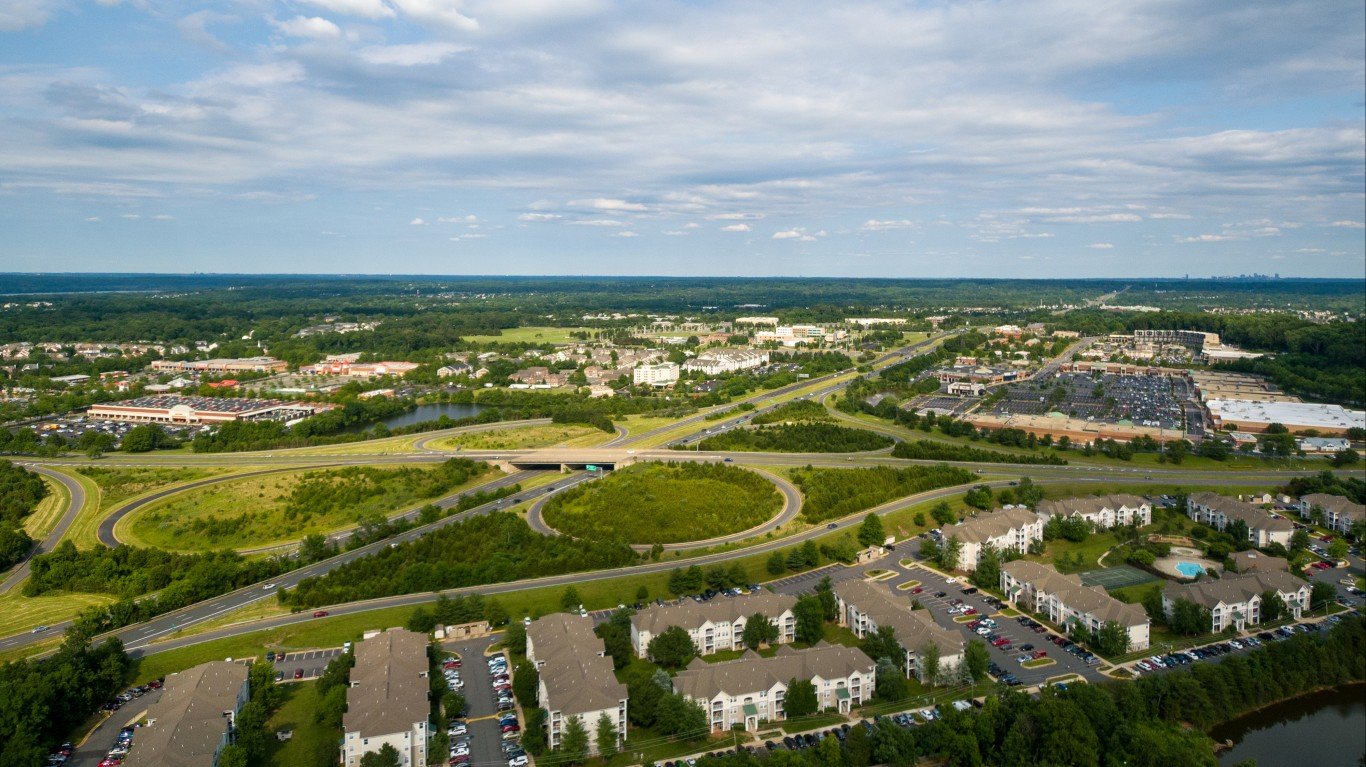
- Median annual household income: $170,463 (Virginia: $87,249)
- Households earning $200,000+ annually: 40.3% (Virginia: 15.6%)
- Median home value: $657,000 (Virginia: $339,800)
- Adults with a bachelor’s degree or higher: 63.5% (Virginia: 41.0%)
- 5-yr. avg. unemployment rate: 3.2% (Virginia: 4.3%)
- County seat: Leesburg
- No. of counties and county equivalents considered in state: 133
Washington: King County

- Median annual household income: $116,340 (Washington: $90,325)
- Households earning $200,000+ annually: 25.8% (Washington: 15.4%)
- Median home value: $761,500 (Washington: $473,400)
- Adults with a bachelor’s degree or higher: 54.8% (Washington: 38.0%)
- 5-yr. avg. unemployment rate: 4.5% (Washington: 4.9%)
- County seat: Seattle
- No. of counties considered in state: 39
West Virginia: Jefferson County
- Median annual household income: $93,744 (West Virginia: $55,217)
- Households earning $200,000+ annually: 13.9% (West Virginia: 4.8%)
- Median home value: $303,400 (West Virginia: $145,800)
- Adults with a bachelor’s degree or higher: 32.2% (West Virginia: 22.7%)
- 5-yr. avg. unemployment rate: 4.8% (West Virginia: 6.0%)
- County seat: Charles Town
- No. of counties considered in state: 55
Wisconsin: Waukesha County

- Median annual household income: $101,639 (Wisconsin: $72,458)
- Households earning $200,000+ annually: 16.5% (Wisconsin: 7.6%)
- Median home value: $352,600 (Wisconsin: $231,400)
- Adults with a bachelor’s degree or higher: 47.2% (Wisconsin: 32.0%)
- 5-yr. avg. unemployment rate: 2.6% (Wisconsin: 3.4%)
- County seat: Waukesha
- No. of counties considered in state: 72
Wyoming: Teton County

- Median annual household income: $108,279 (Wyoming: $72,495)
- Households earning $200,000+ annually: 22.4% (Wyoming: 7.4%)
- Median home value: $1,137,500 (Wyoming: $269,900)
- Adults with a bachelor’s degree or higher: 60.3% (Wyoming: 29.0%)
- 5-yr. avg. unemployment rate: 2.1% (Wyoming: 3.8%)
- County seat: Jackson
- No. of counties considered in state: 23
Contact [email protected] for any questions or corrections.