
With the bull market now over eight years old and with investors having bought every sell-off for years, investors have to wonder if Friday’s major sell-off in some of the top momentum market-favorites is the start of something more than just a one-day event. The Dow is up almost 8% so far in 2017, and the S&P 500 is up almost 9% while the Nasdaq 100 is up about 18%.
Calling a peak or a bottom during any major move is nearly an impossible endeavor because one never knows the absolutes or extremes that can occur. This is not calling an absolute peak in stocks in 2017, but investors may have just gotten their first serious reminder of this year that the market’s favorite stocks cannot rise in a sharp line higher indefinitely. In fact, sharp rises to the extent we have witnessed in 2017, again after an eight-year bull market, have to be followed by some painful corrections at some point.
Before anyone hits the broad general panic button, note that most strategists on Wall Street still have more of a bullish view for 2017 and 2018. Earnings growth is still coming back, but economic readings are showing less robust growth than they were indicating earlier in the year. The official strong payrolls gains have tempered, even if there are a record number of job openings above the 6 million mark. Housing prices seem stretched, and 2016 to 2017 feels like a peak-auto theme is underway while banks trim their subprime lending activities. With the S&P 500 valuation at about 18.0 to 18.5 times next year’s earnings estimates, what are investors to do?
When 24/7 Wall Street gave its 2017 Bull-Bear Outlook, we came up with a peak DJIA level of 21,422. The DJIA is now less than 200 points, or less than 1%, of reaching that target. Our 2016 peak target of 19,700 was very close to the 19,762 at the end of 2016, with the Dow racking up a gain of 13.4% last year. At the start of 2017, the Dow rocketed up to 20,000 and then hardly took any time at all to reach 21,000 — and on Friday, June 9, 2017 the Dow was at 21,271.
[nativounit]
Have stocks peaked? Again, calling absolute peaks or bottoms is almost impossible. What is not impossible is to see when markets or sectors become wildly overbought or too crowded. This is where the key Dow and key market favorites come into play. Analysts have raised some of their targets on Dow and market favorites to the point that they must feel like a dog chasing the mail truck.
Many of the pro-growth business initiatives have stalled or taken a back seat. After all, there are endless scandals in the media that are still playing out. The political cooperation in Washington, D.C., is effectively at zero.
Our 21,422 Dow target for 2017 was derived using the 12-month price target consensus from Thomson Reuters on each Dow component, with dividends added in, and then a modified average expected gain was used rather than a breakdown of the price-weighted Dow index. Our prevailing assumption has always been that there is almost no way that analysts will get each Dow target right, but if you give analysts 30 attempted chances then they will tend to get enough calls right that it averages out.
Stocks tied to financial, energy, infrastructure and consumer goods rallied so much at the end of 2017 that many have underperformed in 2017. Those were even considered to be the “Trump trade” stocks. An ongoing concern is that the infighting in Washington has become so contentious that the obvious goals are for each party are to block progress of their rival political party at almost any cost. And the favorites of Wall Street (Amazon, Facebook, Alphabet, NVIDIA and the like) reached astronomical performance during the first half of 2017.
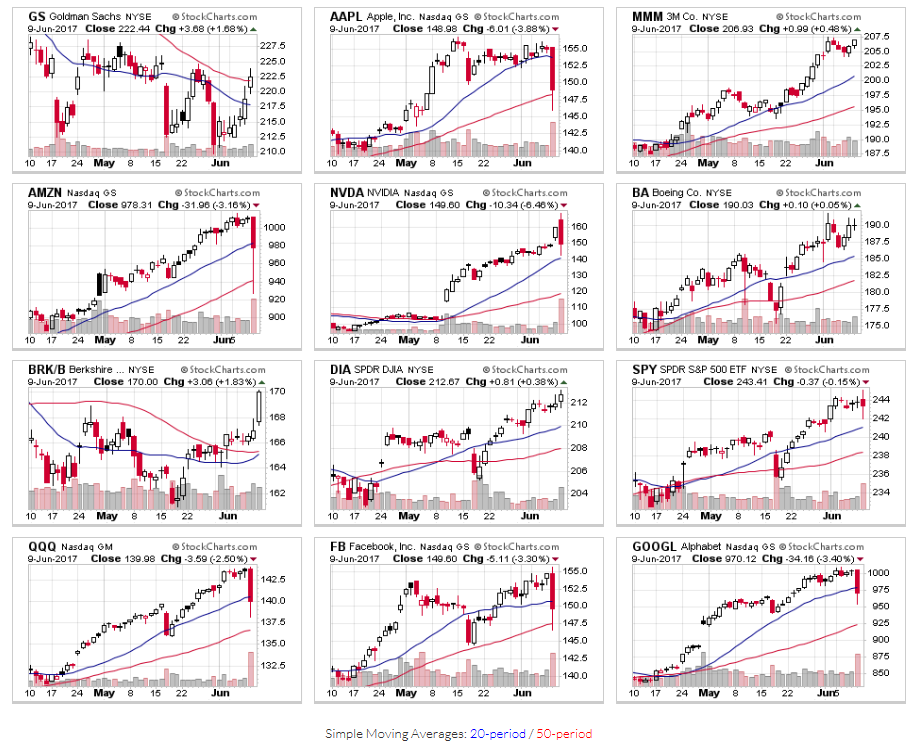
There are still some serious doubts that gross domestic product growth will rise much more than the 2% line in 2017. Currency risks and international trade issues also remain threats. 24/7 Wall Street has identified some of the top gainers of the S&P and Nasdaq, as well as some of the largest Dow stocks, and has included a chart watch from StockCharts.com to show just how severe the trading action from Friday looks. Needless to say, investors at some point have to use a chart to see how significant some moves are.
Goldman Sachs Group Inc. (NYSE: GS) is still the top Dow stock with its 7.1% weighting in the index, but at $222.44 a share it is still down by 7.1% so far in 2017, even after a 1.7% gain on Friday. If one company can figure out a way to win in the financial markets over time, Goldman Sachs should be the one. It didn’t get the name “Golden Slacks” for nothing. It also caters to America’s wealthiest investors and the entire institutional investor market. Goldman Sachs has a 52-week high of $255.15 and a consensus analyst target of $242.96.
[recirclink id=396497]
Apple Inc. (NASDAQ: AAPL) is currently in a close fight for being the fifth to eighth largest Dow stock by weighting (4.8% weight in the Dow today). It is the Dow’s best year-to-date performer at 28.6%, but it was down almost 4% on Friday and is now down for a one-week reading and for a one-month reading. That analyst downgrade from this week was against the grain, but everyone just has to wait for that iPhone 8 launch later in 2017. The market cap is almost $800 billion, and with the stock at $148.98 a share, Apple’s consensus price target of $157.36 is almost equally matched by its 52-week high of $156.65. It is the fifth largest Dow stock by share price. After generating a return of 12.5% in 2016 (to $115.82), Apple’s consensus analyst target price was $131.96 at the end of 2016. That was implied simple upside of 13.9% before its 2.0% yield. Apple’s consensus target price is above $157.
3M Co. (NYSE: MMM) has been an incredible conglomerate stock with a total return of already about 16%. Trading at $206.93, it is the second highest weight in the Dow at 6.7%. 3M still closed up by 0.5% on Friday, and its 52-week high of $207.39 is higher than the $199.21 consensus target price.
Amazon.com Inc. (NASDAQ: AMZN) is no Dow stock, but the company is transforming behavior and wrecking much of the retail world simultaneously. After shares finally hit $1,000 recently, investors were reminded that what goes up can come down, with a drop of more than 3% on Friday. At $978.31, Amazon has a 52-week high of $1,016.50 and a consensus target price of $1,102.05. Amazon has nearly reached a $500 billion stock market cap now.
NVIDIA Corp. (NASDAQ: NVDA) has been all of the chip-hype so far in 2017, after an exponential rise in 2016, and even a 6.5% drop to $149.60 still generates a 40% gain so far in 2017. Analysts have chased its target prices up and away, but NVIDIA still has a consensus target price of about $130 and a 52-week high of $168.50.
Boeing Co. (NYSE: BA) is the third highest weighting in the Dow at 6.1%, and its $190.03 share price has generated a total return of 22% so far in 2017, even as some airplane orders had slowed. Boeing has a 52-week high of $191.70, and that is above the consensus analyst target of $189.07.
[recirclink id=396610]
Berkshire Hathaway Inc. (NYSE:BRK-A) may have Warren Buffett at its helm, but its shares are underperforming the broader market in 2017. Berkshire Hathaway shares are up just 4.4%, and many of its largest stock holdings looked overvalued or with limited upside in a recent review. Berkshire Hathaway is no Dow stock, but its market cap is north of $400 billion and that makes it the top conglomerate. Its B-shares closed at $170.00 on Friday with a 1.8% gain, versus a 52-week range of $136.65 to $177.86.
Markets cannot go up in a straight line forever. As long as you aren’t the one losing money, it is common to hear about stock market corrections being a healthy thing. The sell-off on Friday in the key go-to market favorites should act as a reminder that crowded stocks and crowded sectors cannot run up endlessly without reminders of how painful they can be. Has the market peaked in 2017? All we can use as a reference at this point is that investors have found multiple and differing reasons to buy major pullbacks for more than five years now. Until that changes, maybe it’s best to think that pullbacks are healthy, particularly if the Dow, S&P 500 and Nasdaq all hit all-time highs this week.
24/7 Wall Street has included several charts from StockCharts.com to show how much they are up in 2017 and to show how much some were gutted at the end of the week. The Dow is represented by DIA, the S&P 500 is represented by SPY and the Nasdaq 100 is represented by QQQ.
[wallst_email_signup]
Contact [email protected] for any questions or corrections.