
Now that May’s trading days are over, it’s time to think about June, the summer, and the second half of 2020. The recession is already seeing what economists hope are the worst readings, and the stock market and other markets are already discounting that the economy will be vastly better in the coming months. As for looking ahead, sometimes the best way to get a message out is visually in charts and graphs.
24/7 Wall St. has created a weekly review of some of the best charts, tables, graphics and other images that should be given deep consideration ahead based on what has been happening and what might come to pass. Anyone who has their money in the stock market or bond market should give at least some of these deep consideration ahead.
For the week ending May 30, 2020, the real read is how it will pertain to June and future months. We have first covered the S&P 500 and the big levels that are very close in gold and oil. Then we covered the stocks of Canopy Growth Corp. (NYSE: CGC), Tesla, Inc. (NASDAQ: TSLA) and in Williams-Sonoma, Inc. (NYSE: WSM). After that we have our economic charts on deck.
A brief commentary has been provided on each chart and graphic, as has the source of each item featured. These may have been numbered, but the importance of each chart will depend upon the reader as these are not intended to be ranked.
Here are the 10 top charts we are seeing heading into June of 2020.
[nativounit]
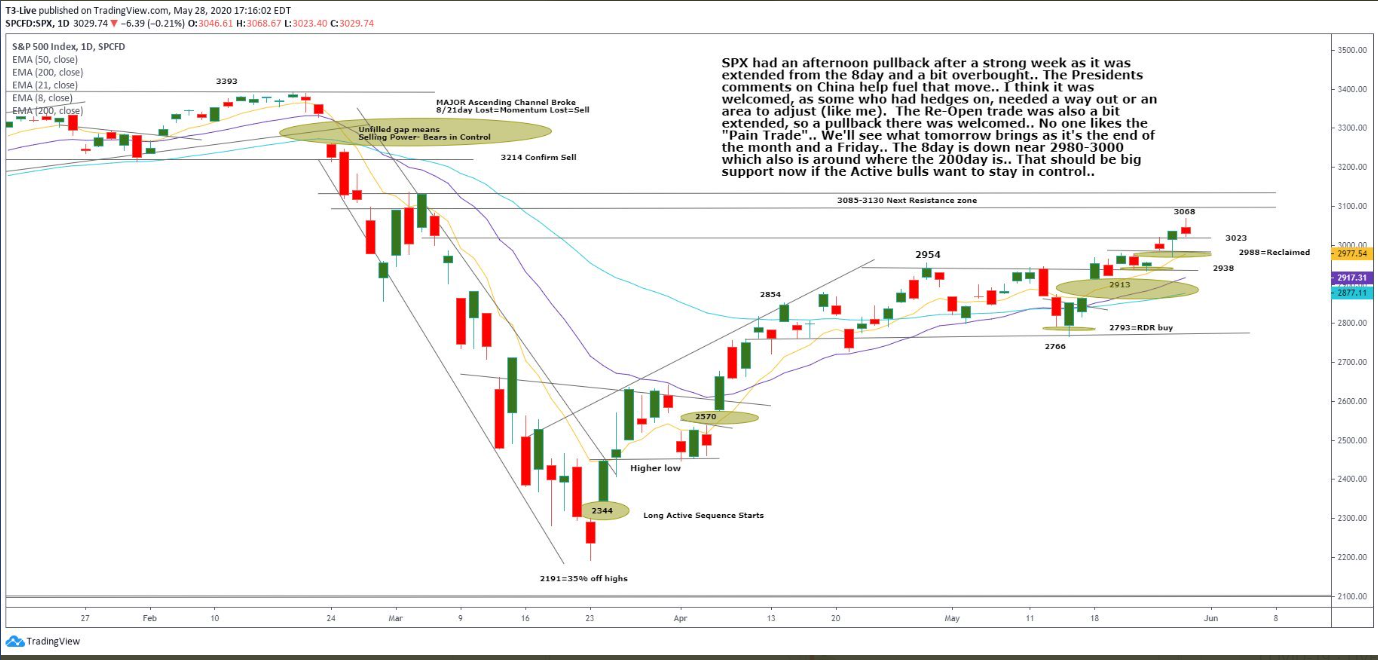
1) S&P 500: Now Overvalued or More Room to Run?
The S&P 500 spent part of February and most of March in outright panic mode as the novel coronavirus morphed into the COVID-19 pandemic. It took the stock market down with it, and it caused the deepest and fastest recession in history with 10 years of growth and the best jobs market with it. You know the rest, but this chart from Scott Redler of T3 Trading Group on Friday afternoon shows where we are now.
The S&P 500 is back above 3,000 and Friday’s 3,044.31 close is only about 10% under the absolute highs for the S&P. Where this goes from here remains to be seen, but Mr. Redler shows some key pivot areas for support and resistance ahead.
Source: @RedDogT3 on Twitter
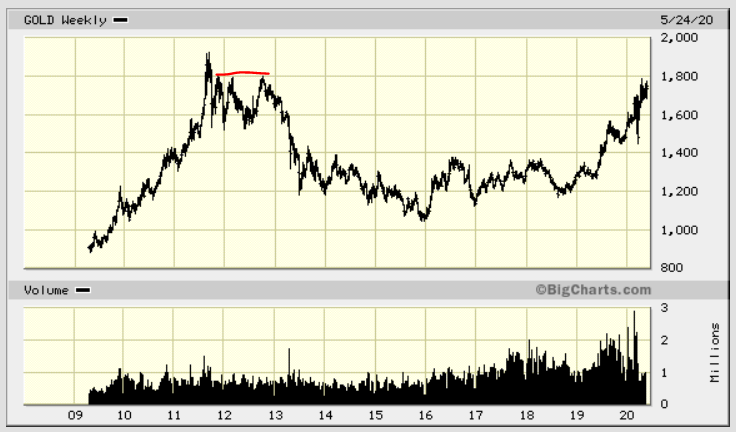
2) As Gold Approaches $1800…
Many technicians and fundamentalists alike are still calling for gold to rise plenty higher. We have seen some calls for $2,000 gold and some for even much higher under the right circumstances.
With so much global uncertainty, gold now even seems like a must-own commodity for any investor or anyone who wants to preserve the long-term values of their assets. And with the rising supply of currency and with the trillions of stimulus dollars that have been created to stimulate and stabilize the economy, gold also seems like a sure bet.
What does its chart say? As gold is close to $1,750 per ounce, the highs of above $1,800 from 2011 should come to mind. Or should it? The real test may be at $1,800. That level formed a nearly perfect triple top in 2011 and 2012 after gold had pulled back to under $1,600. Maybe this time is different, or maybe a breakout will be seen. And there you are.
Source: BigCharts.com
[wallst_email_signup]
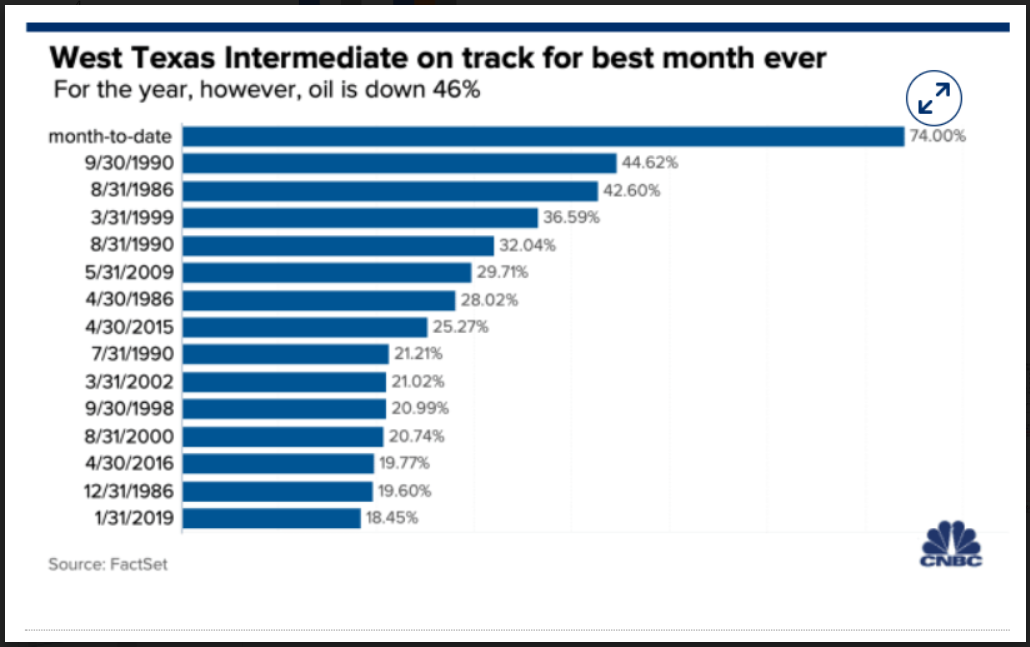
3) Oil Just Had Its Best Monthly Gain Ever!
Sometimes we have to take generalities in reverse. The farther they fall, the farther they rise. It is without debate that crude oil has suffered a vicious and violent 2020 after starting out the year closer to $60 per barrel.
Friday’s level of $35 is far less destructive to the oil and gas sector, although it’s also still far from being an oil boom. The so-called ‘Black Gold’ had fallen to plunge depth levels not allowing profitability for all but the nimblest of companies, but May was the month that the economy was starting its phased reopening and people are driving again ahead of the summer travel season.
A late day report from CNBC showed that crude oil was up almost 90% in May for its biggest monthly gain on record. That is great for oil workers, and it’s actually good for those who want alternative energy to be more competitive as well. Before the oil barons and their teams go flooding the steak houses back to max capacity, oil is still down almost 50% so far in 2020. Here is a chart that shows the best months ever, ranked in order of strength.
Source: CNBC/FactSet
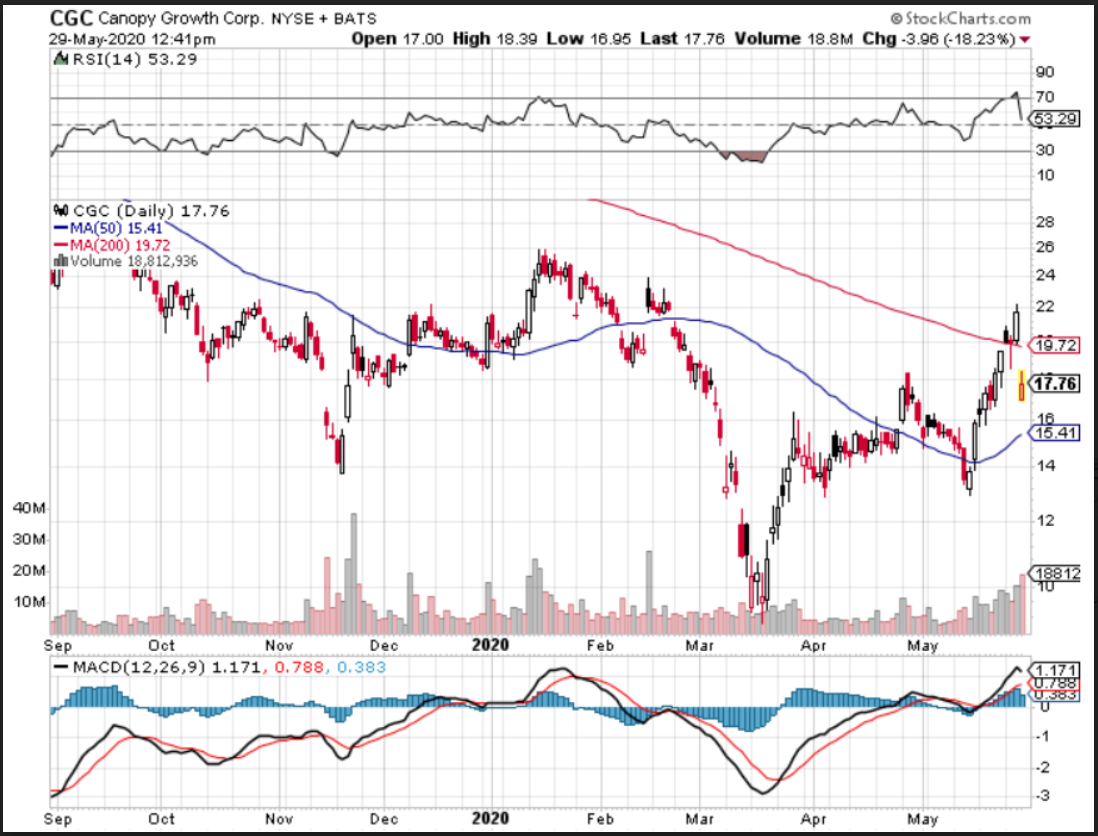
4) Canopy Growth Delivered Downers Rather Than More Highs
Canopy Growth Corporation (NYSE: CGC) was on the verge of greatness. This is a scenario where the charts did not match the fundamentals of the legalized marijuana leader, and not even close. The stock was back to positive for the year despite its speculative nature and had just managed to tick above its key 200-day moving average. but a wide loss of $1.3 billion (Canadian) was much wider than expected.
The company also withdrew guidance and said that 2020 will be another year of transition. At one point, Friday’s drop was shown by Dow Jones to be a record percentage drop. They were down 18% at $17.75 in afternoon trading on Friday (with about 20 million shares already hit by 1:00 PM) after peaking at $50 or so in 2019. This stock had more than doubled from its panic selling lows in March 2020.
Barring some unknown developments, this is chart destruction of the industry leader that spells trouble for the entire legalized marijuana and medical marijuana sector and its ETFs.
Source: ‘CGC’ StockCharts.com
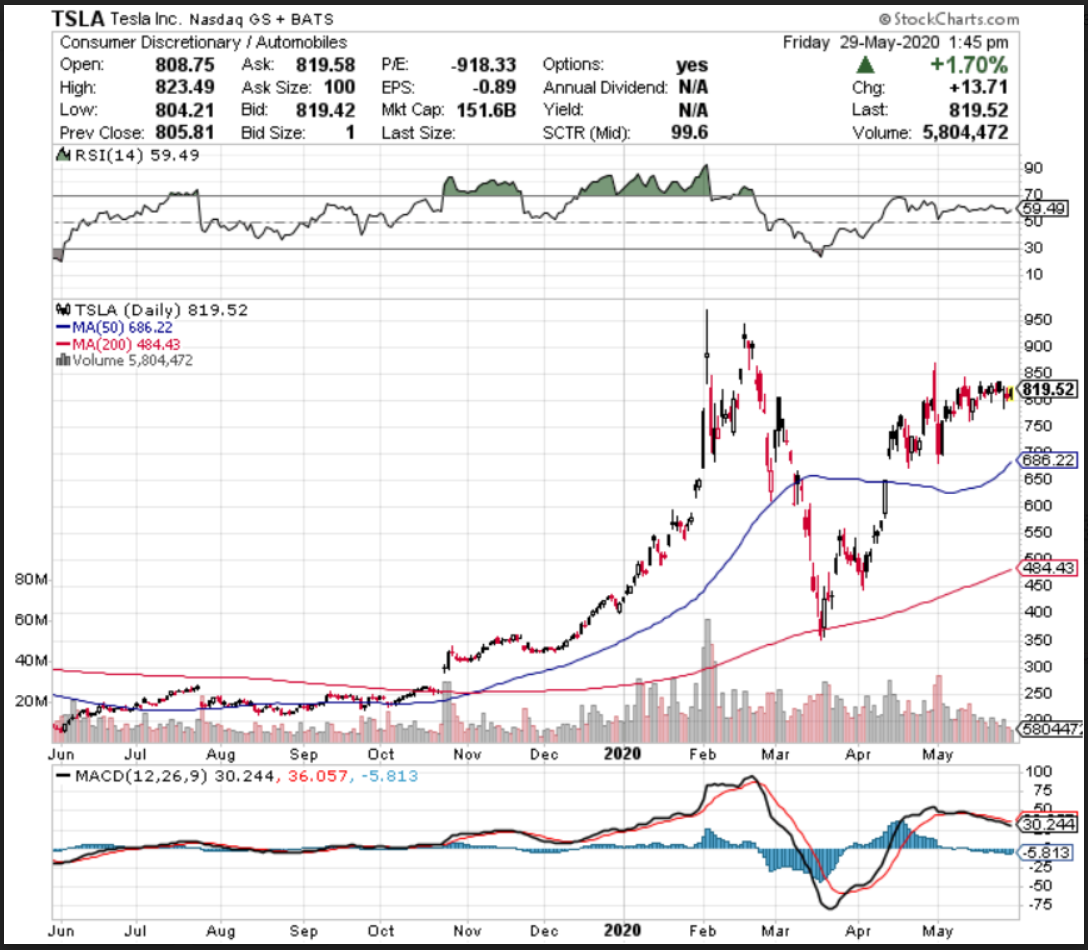
5) Tesla Chart Became Boring, But Elon Musk’s Payday Is Far From Boring!
Elon Much of Tesla, Inc. (NASDAQ: TSLA) hasn’t exactly been hurting for money, but now he is flush. He earned the first of 12 compensation tranches this week. Tesla’s market cap stayed above $100 billion on both a 30-day and 6-month average and Tesla hit a trailing 4-quarter revenue figure of $20 billion.
Musk now has an option to buy roughly 1.7 million shares with roughly a $350 per share strike price. That would represent a $775 million profit after shares went above $800.
Tesla’s stock chart at the same time has become quite boring as the stock seems to be consolidating for the next leg up or the next leg down. The stock did make it into Friday’s Top Analyst Calls.
Will reports of lower car prices ahead mean more sales and a broader penetration, or does it means that Tesla is going to face margin pressure as many of the people who want to owns a Tesla are now facing a vastly weaker economy and much lower gas prices in a Green vs. Dollars & Cents personal finance check.
Source: ‘TSLA’ StockCharts.com
ALSO READ: 8 STOCKS THAT COULD DOUBLE FROM 2020 to 2021
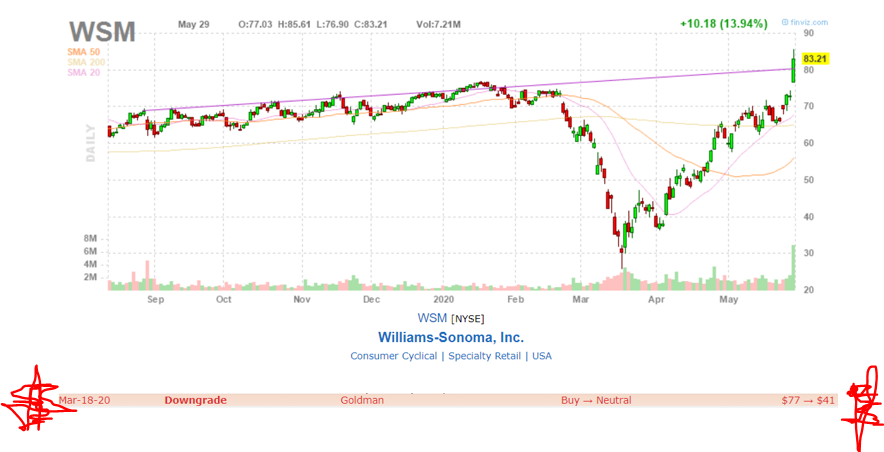
6) Williams-Sonoma Destroys Its Doubters
“Expensive Kitchen and Dining Products” and “Deep Recession” and “Most Retail Stores Are Closed” all in the same sentence, would you guess that it would be a good trend or a bad trend for Williams-Sonoma. Apparently the portion of the country that was laid off, furloughed and unable to work doesn’t shop here.
It turns out that e-commerce sales at Williams-Sonoma and Pottery Barn blew out revenue expectations and earnings were exponentially higher than expected. Despite slower online sales growth than in the prior two quarters doesn’t hurt the image when all of its 600+ stores closed had been closed for over half of its quarter.
Where this gets really interesting is the notion that this stock has now risen 200% since the March bottom, and if you look at the one major analyst downgrade from the same time period it was bottoming out it looks even more amazing. Pottery Barn for kids and teens managed to show higher online sales growth too. It may be very lofty to chase this now, but it goes to show that some companies can and do thrive even in deep recessions.
Hitting 52-week highs on about 4-times normal trading volume is very impressive for what was not considered a defensive retailer.
Source: Finviz.com ‘WSM’
[wallst_email_signup]
7) The Actual U.S. Dollars in Circulation is Going Parabolic
Many economists, investors and business owners have been surprised that inflation has not ever kicked into overdrive. Back in the pre-credit/debit card days, all eyes were on the actual supply of currency in circulation. Raw cash, that is! This chart from the St. Louis Fed’s Currency in Circulation shows a steady increase over time, but the rapid inflow of cash has blown through the prior rocket moves in raw dollars even though it may not be that way on a percentage basis.
There was a 15% injection in cash in roughly the last 90 days of 1999, but that then came down. In the Great Recession, there was a 8% gain in currency from the start of October 200 through the end of March 2009 and it kept rising over time.
In this recession we have seen an 8% growth of currency in circulation from March 4, 2020 to May 27, 2020 (versus a total of almost 12% in the last year) to a record $1.944 trillion.
Source: St. Louis Fed ‘Currency in Circulation’

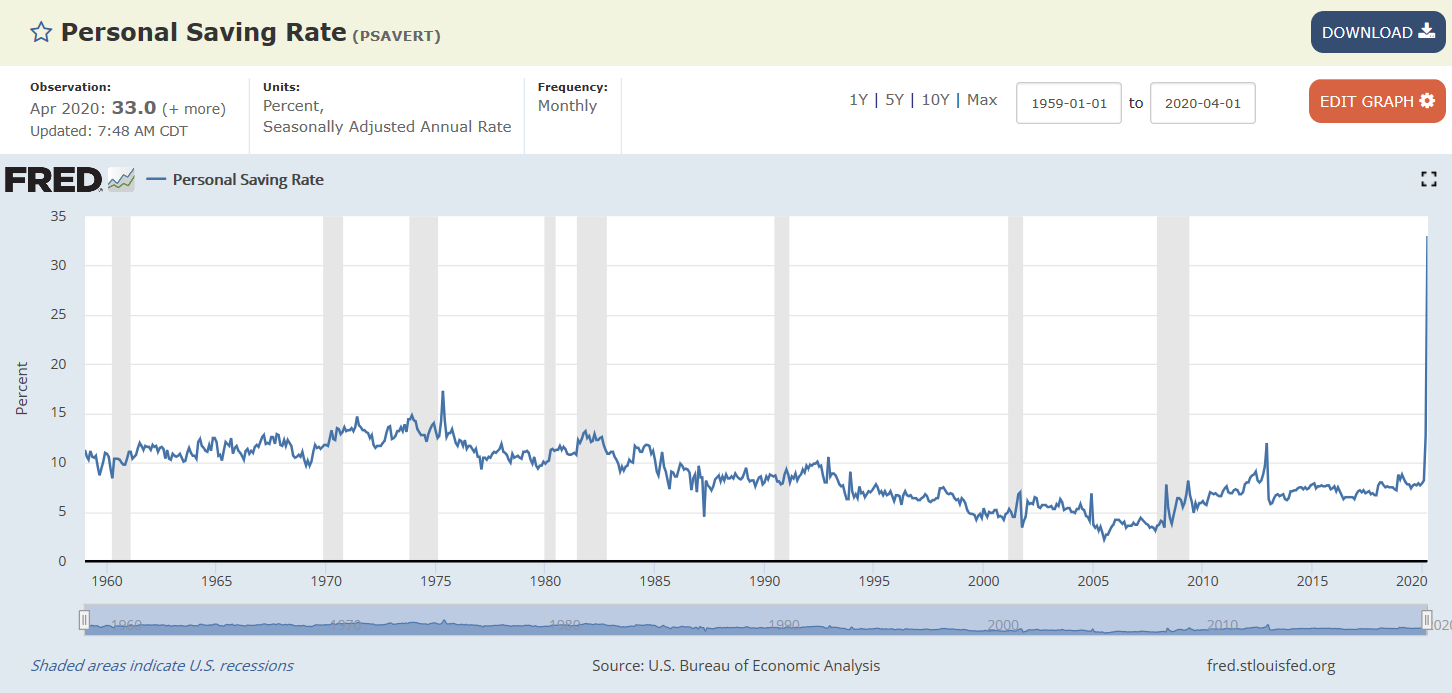
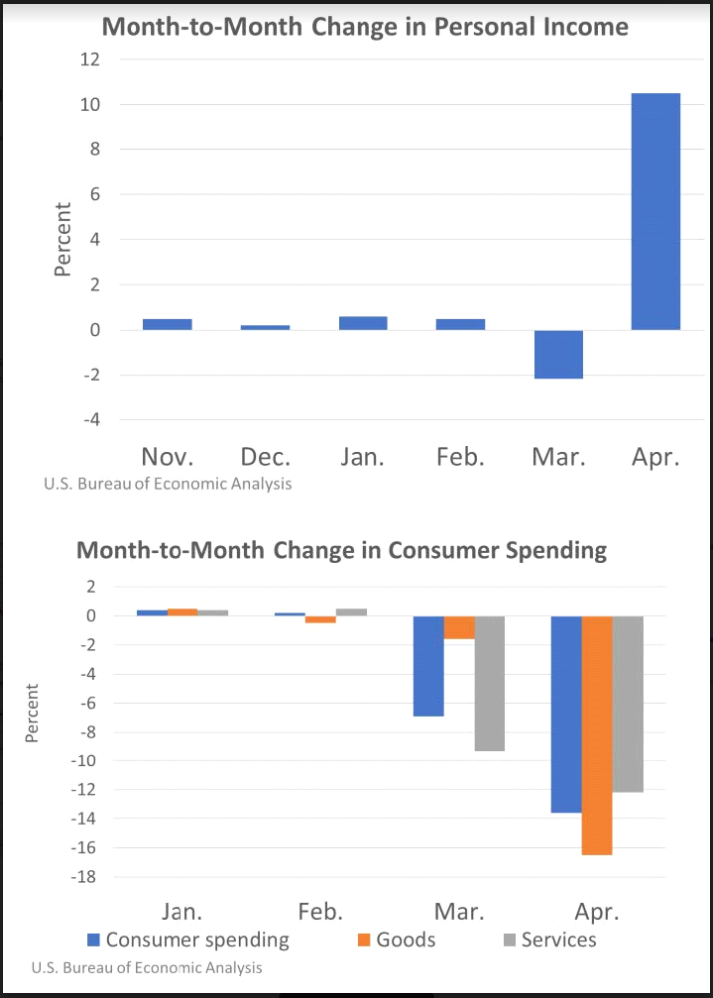
8) Consumers May Have Saved Enough Cash to Turbo Charge the Recovery Ahead
It’s no great shock that consumers curb (or slash) spending at the start of and through a recession. What is not expected to happen is a surge in personal income, and perhaps not a gain in savings either. April was the first month that almost everyone was on lock-down for an entire calendar month, and it was the first month that businesses were shut down all month and where furloughs were vaulted into layoffs.
The Commerce Department reported on Friday that consumer spending did plummet in April, but there was enough extra stimulus and the unemployment benefits were big enough that the grand total created a massive surge of more than 10% in personal income.
Wages and salaries showed a -8% move, and the Commerce Department confirmed it was unemployment checks and extra benefits ($1200 checks) that added the biggest gains. Joe Public was frugal and smart as the personal saving was $6.15 trillion (annualized) in April and the personal saving rate savings as a percentage of disposable personal income was an unprecedented 33%. That money will help buffer the coming drop in GDP.
Source: BEA/Commerce Department and St. Louis Federal Reserve
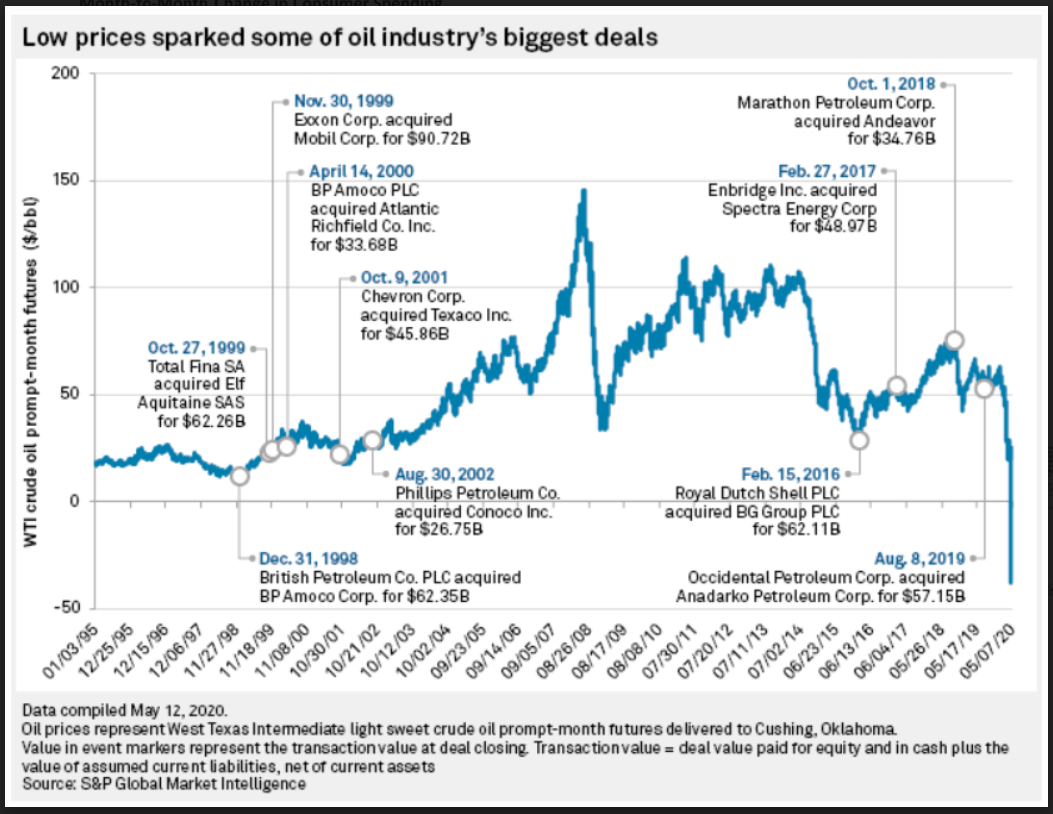
9) Are Oil Mergers on the Way?
Standard & Poor’s has projected, or warned, that consolidation is coming in the oil patch. They even touted a “Party Like It’s 1999” feature with a call for low oil prices to generate a wave of consolidation. The S&P report even cited Goldman Sachs saying an “oil seismic shock will likely serve as a catalyst for a new consolidation phase.”
And S&P’s own team noted that shut-in production and the collapse in U.S. drilling activity will bring enough pain that even financially strong shale players will consider strategic mergers and that everyone will be surprised and may not make sense. While it listed the shale names in order, S&P gave a list of the big mergers that have been seen at lower oil prices over the last 25 years.
Some analysts remain bullish on oil stocks, but the list is hard to compare to years past.
Source: S&P Global Market Intelligence
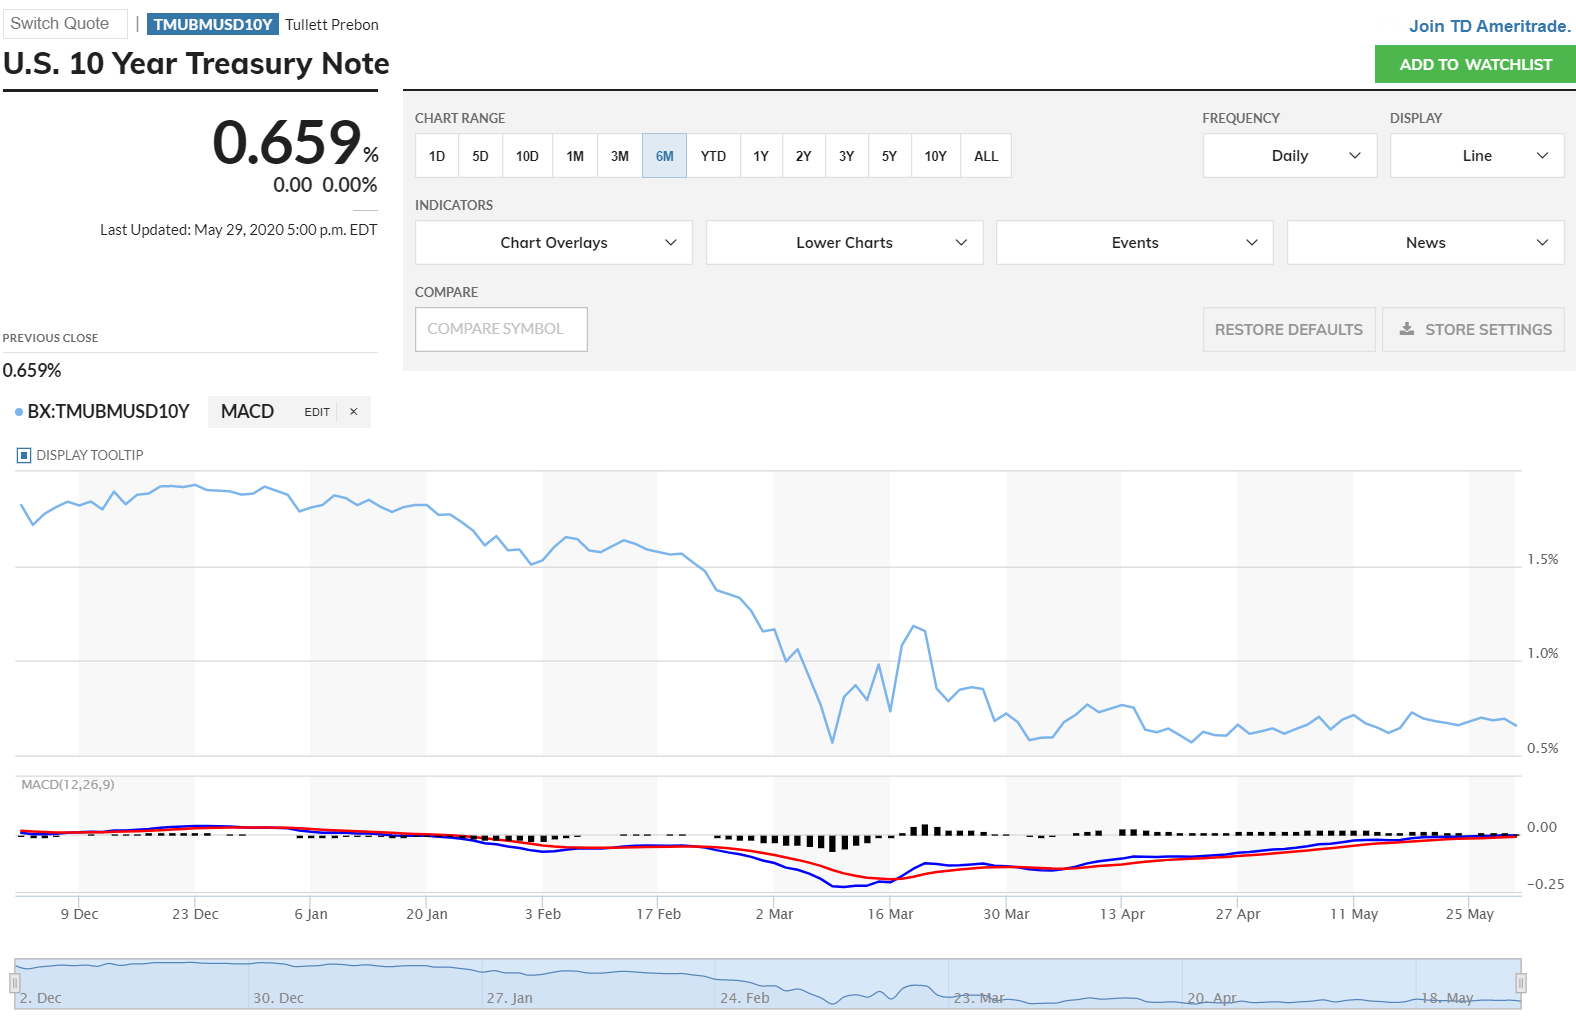
10) 10-Year Treasury Outlook
The yield on the 10-year Treasury is hovering low and under the 0.7% level. With an upcoming FOMC meeting, Jerome Powell has pledged to keep interest rates very low until the economy recovers.
What happens as that recovery, which a 35% recovery in stocks in 75 days should at least hint at, comes to play? If the economy is going to start its recovery, the 10-year Treasury yield could suddenly begin its move back up to 1.0% and then perhaps 1.2% without much fight.
This still feels somewhat too soon to worry about with the economic readings so weak and with the real economic recovery only expected to get back to somewhere normal rather than back to a booming economy.
Source: MarketWatch.com
[wallst_email_signup]
Contact [email protected] for any questions or corrections.