W.W. Grainger Inc. (NYSE: GWW | GWW Price Prediction) pays an annual dividend of $8.62 per share with a yield of 0.89%. The company has raised its dividend for 53 consecutive years, placing it among the elite Dividend Kings. The most recent increase came in 2025, continuing a streak that began in 1972. Can Grainger keep it going?
| Metric | Value |
|---|---|
| Annual Dividend | $8.62 per share |
| Dividend Yield | 0.89% |
| Consecutive Years of Increases | 53 years |
| Dividend King Status | Yes |
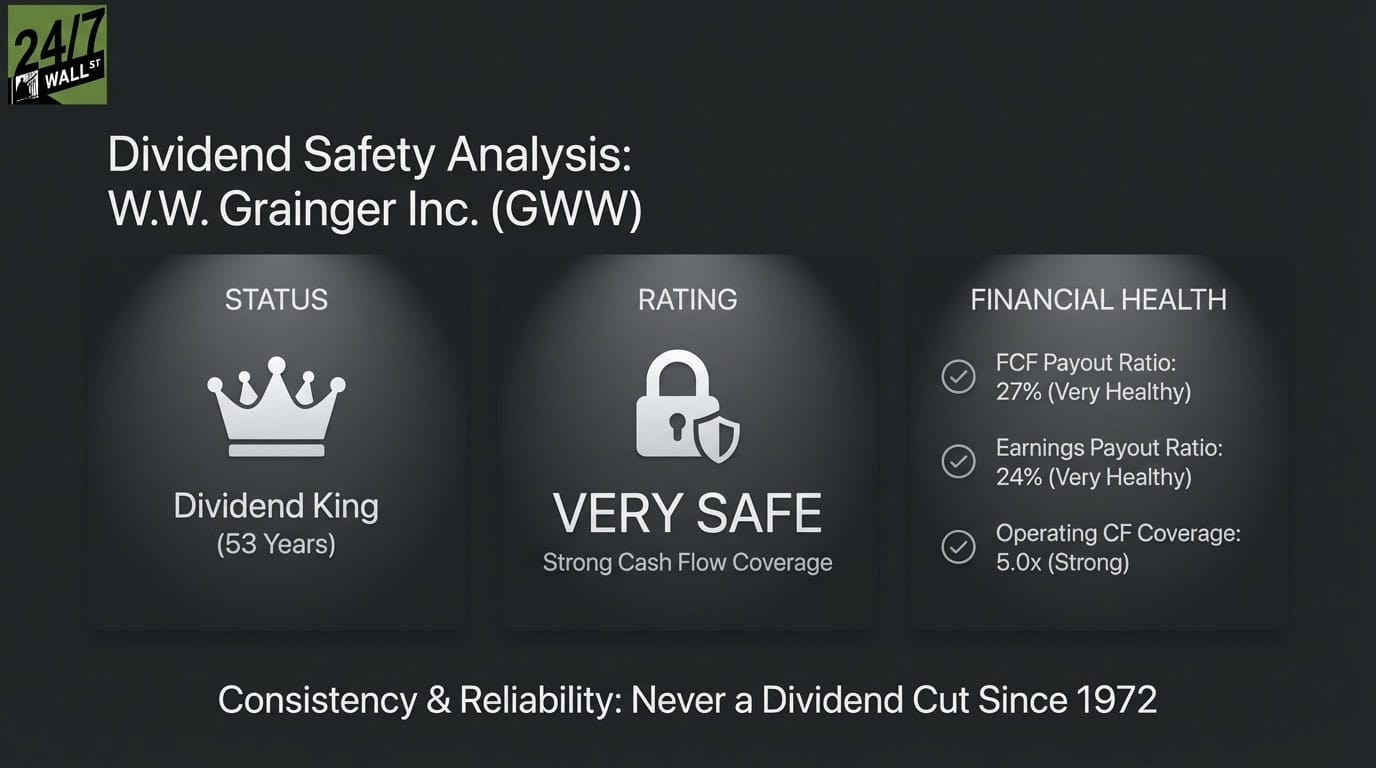
Cash Flow Covers the Dividend with Room to Spare
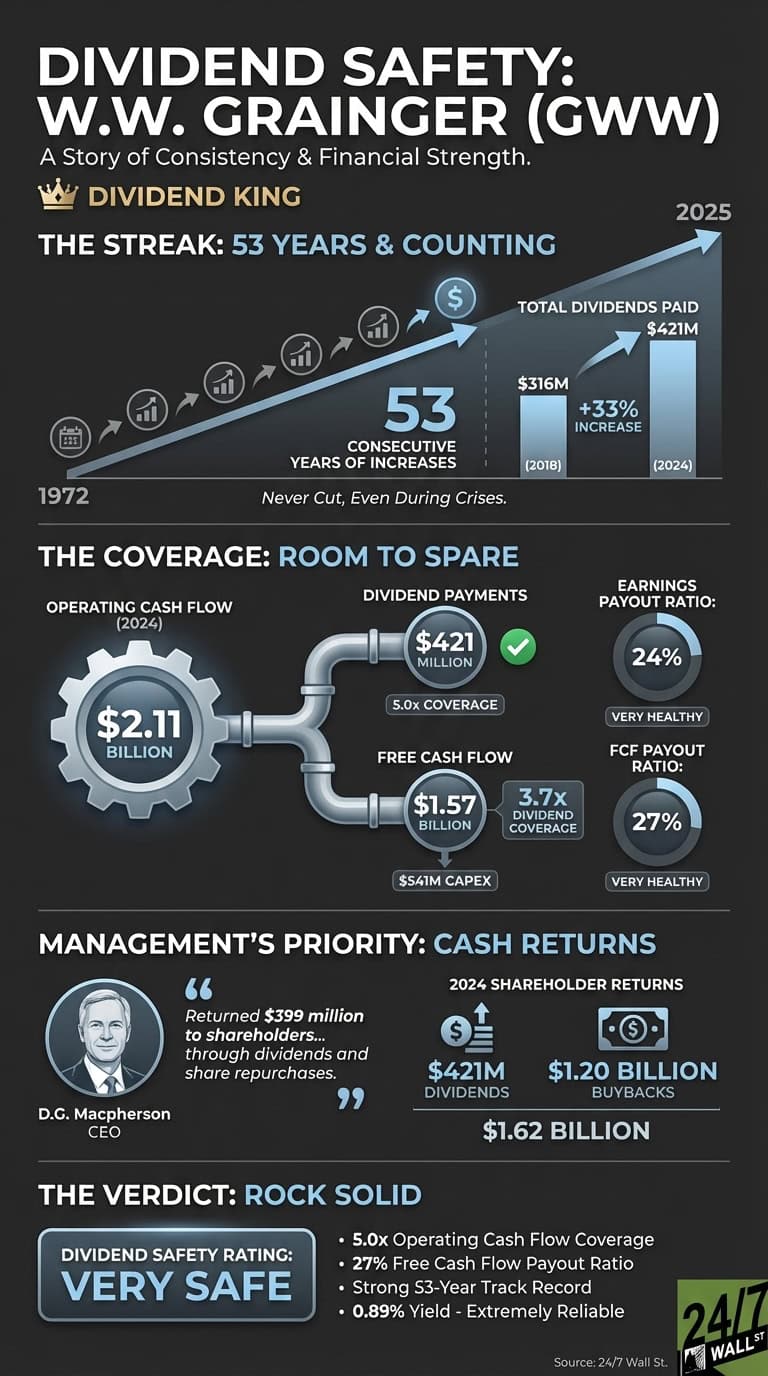
Grainger generated $2.11 billion in operating cash flow in 2024 against $421 million in dividend payments. That gives the company 5.0x coverage, meaning it produces five dollars of operating cash for every dollar paid to shareholders. After subtracting $541 million in capital expenditures, free cash flow came to $1.57 billion, covering the dividend 3.7 times over.
The free cash flow payout ratio sits at 27%, leaving substantial room for dividend growth or economic downturns. The earnings payout ratio is 24% ($8.62 dividend divided by $35.70 in trailing twelve month earnings per share). Over the past five years, payout ratios have consistently remained in the 20% to 25% range, well below the 60% threshold that typically signals concern.
| Metric | 2024 Value | Assessment |
|---|---|---|
| Earnings Payout Ratio | 24% | Very Healthy |
| FCF Payout Ratio | 27% | Very Healthy |
| Operating Cash Flow Coverage | 5.0x | Strong |
A 53-Year Streak Built on Consistency
Grainger has raised its dividend every year since 1972. The five-year compound annual growth rate stands at approximately 6%, with annual increases ranging from 5% to 8% in recent years. Total dividend payments have grown from $316 million in 2018 to $421 million in 2024, a 33% increase over six years.
| Year | Total Dividends Paid | YoY Change |
|---|---|---|
| 2024 | $421M | +7.4% |
| 2023 | $392M | +5.9% |
| 2022 | $370M | +3.6% |
| 2021 | $357M | +5.6% |
| 2020 | $338M | +3.0% |
The company has never cut its dividend, even during the 2008 financial crisis or the 2020 pandemic.
Management Prioritizes Cash Returns
On the Q3 2025 earnings call, CEO D.G. Macpherson stated: “Operating cash flow came in at $597 million which allowed us to return a total of $399 million to Grainger shareholders through dividends and share repurchases.” CFO Deidra Merriwether added: “We remain confident we can drive share gain in the U.S., while the EA business grows in the teens […] and we remain well-positioned to deliver great results for our shareholders for the years to come.”
In 2024, Grainger returned $1.62 billion to shareholders through $421 million in dividends and $1.20 billion in buybacks. The dividend represents just 22% of free cash flow, with the majority going to share repurchases.
This Dividend Is Rock Solid
Dividend Safety Rating: Very Safe
The dividend is extremely well covered with a 27% free cash flow payout ratio and 5.0x operating cash flow coverage. Grainger would need to experience a 70% decline in cash generation before the dividend becomes threatened. The 53-year track record, conservative payout ratios, and strong return on equity of 46.7% all support continued dividend growth.
Grainger offers dividend reliability with a below-market yield of 0.89%. The dividend is safe, but growth-focused income investors may prefer higher-yielding alternatives.
Contact [email protected] for any questions or corrections.