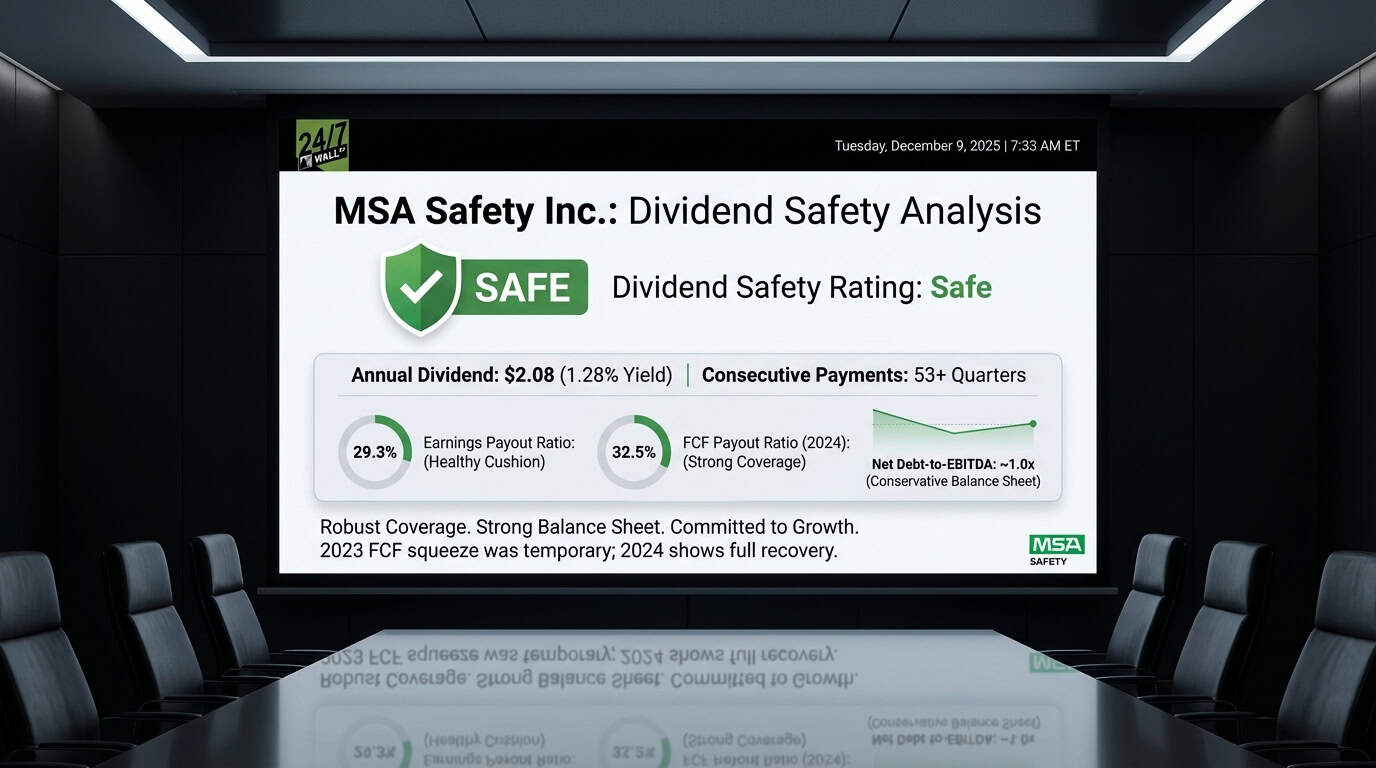
MSA Safety (NYSE: MSA | MSA Price Prediction) pays $2.08 per share annually, yielding 1.28%. The company delivered its 53rd consecutive quarterly payment on December 10, 2025, maintaining an unbroken streak dating back to at least 2012. For income investors, the question is straightforward: can MSA keep this going?
| Metric | Value |
|---|---|
| Annual Dividend | $2.08 per share |
| Dividend Yield | 1.28% |
| Consecutive Quarters Paid | 53+ |
| Most Recent Increase | 3.9% (Q2 2025) |
| 5-Year Growth Rate | 4.2% CAGR |
The Payout Ratios Look Extremely Comfortable
MSA’s dividend coverage is excellent. The company earned $7.09 per share over the trailing twelve months and paid out $2.08, producing an earnings payout ratio of 29.3%. That leaves roughly 71% of profits retained for reinvestment, debt reduction, or further dividend growth.
The free cash flow picture requires closer examination. In 2024, MSA generated $296.4 million in operating cash flow, spent $54.2 million on capital expenditures, and delivered $242.2 million in free cash flow. Against $78.8 million in dividend payments, that’s a FCF payout ratio of 32.5%. Very healthy.
But 2023 tells a different story. Operating cash flow collapsed to $92.9 million due to a $51.6 million inventory build. Free cash flow came in at $50.1 million while dividends totaled $73.5 million. The FCF payout ratio spiked to 147%, meaning MSA paid more in dividends than it generated in free cash flow.
| Metric | 2024 | 2023 | Assessment |
|---|---|---|---|
| Earnings Payout Ratio | 26.0% | 26.7% | Healthy |
| FCF Payout Ratio | 32.5% | 146.7% | 2023 Outlier |
| Operating CF Coverage | 3.8x | 1.3x | Strong Recovery |
The company maintained the dividend through that cash flow squeeze, signaling commitment. 2024’s recovery demonstrates that 2023 was a working capital anomaly, not a structural problem.

Balance Sheet Provides Solid Support
MSA carries $674 million in total debt against $1.30 billion in shareholders’ equity, producing a debt-to-equity ratio of 0.52x. With $170 million in cash, net debt sits around $504 million. Against trailing EBITDA of $491 million, that’s a net debt-to-EBITDA ratio of approximately 1.0x. Conservative.
Interest coverage is strong. In Q3 2025, MSA reported EBIT of $100.9 million against interest expense of $8.4 million, covering interest payments 12 times over. Debt service is not threatening the dividend.
Steady Growth, No Cuts
MSA has raised its dividend every year since at least 2015. The annual payout grew from $1.27 in 2015 to $2.10 in 2025, a 5.1% compound annual growth rate. Growth has been steady but unspectacular, with recent increases in the 4% to 5% range.
MSA has never cut its dividend in the available historical record. The company maintained payments through 2023’s cash flow weakness, demonstrating management prioritizes dividend stability.
This Dividend Is Safe
Dividend Safety Rating: Safe
MSA’s dividend is well protected. The earnings payout ratio under 30% provides enormous cushion. The 2023 free cash flow squeeze was inventory-driven and temporary, with 2024 delivering a full recovery. The balance sheet is clean, debt is manageable, and the company has demonstrated commitment by maintaining payments through operational challenges.
MSA works for income investors seeking a low-yielding but reliable dividend from an industrial company with strong margins and consistent execution. However, the 1.28% yield won’t move the needle for most income portfolios.
Contact [email protected] for any questions or corrections.