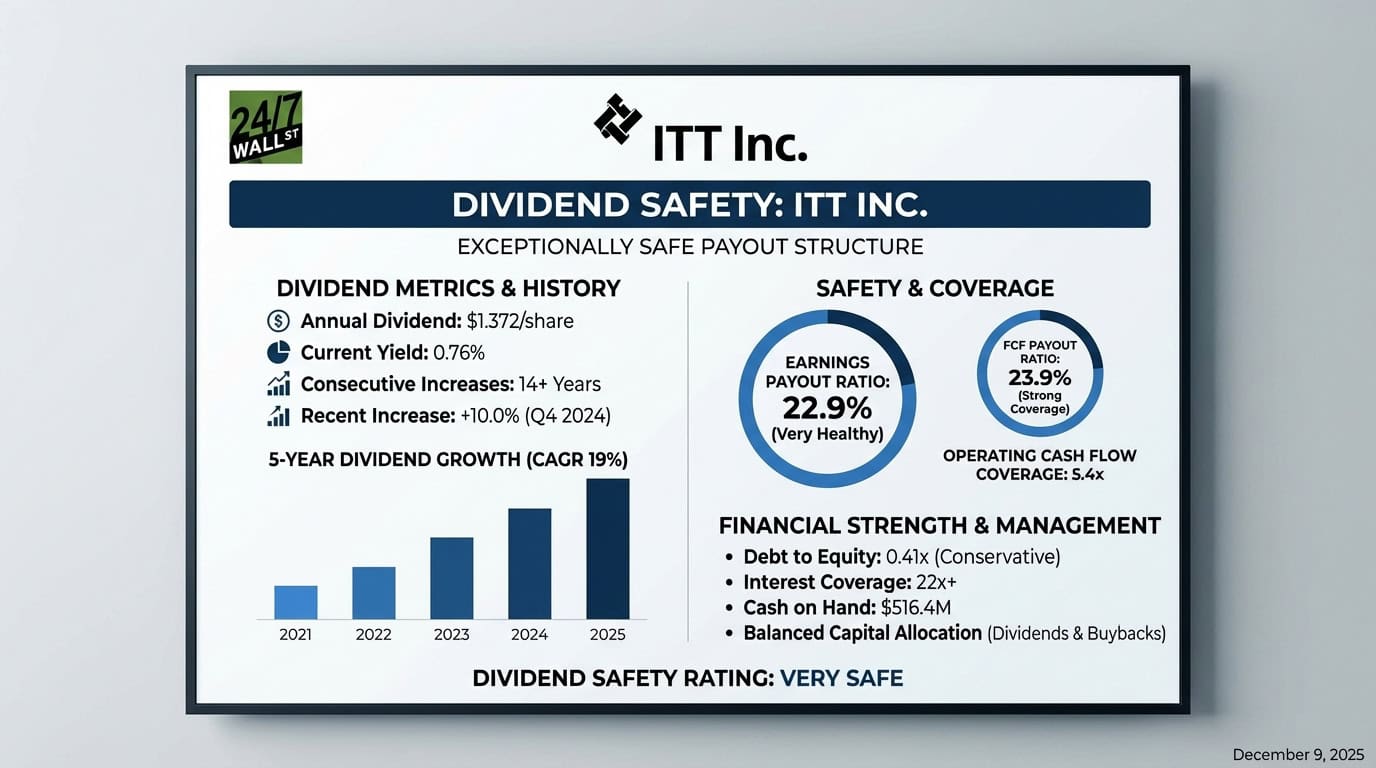
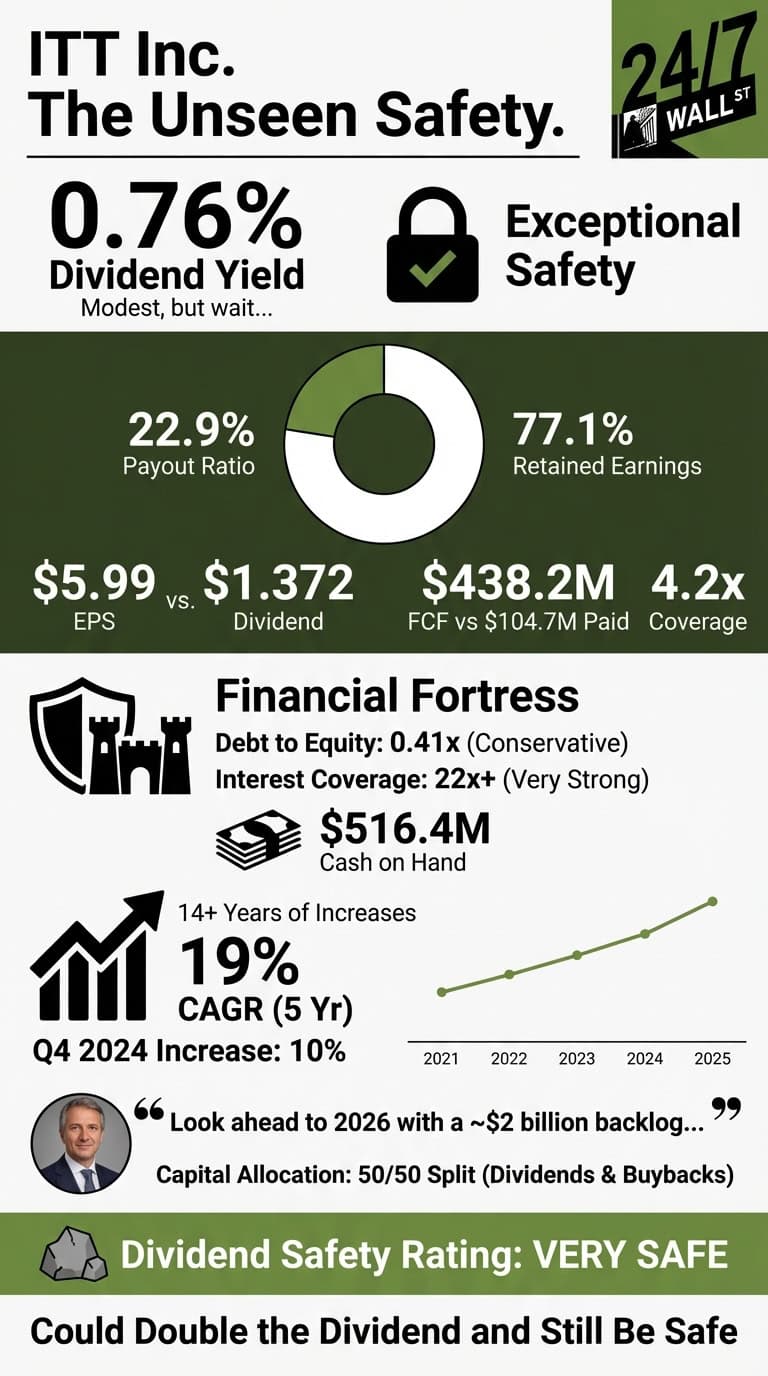
ITT Inc (NYSE: ITT | ITT Price Prediction) pays a modest dividend that won’t excite income investors chasing yield, but the numbers behind it tell a story of exceptional safety. With a 0.76% yield and $1.372 in annual dividends per share, this industrial manufacturer has built one of the most conservative payout structures in its sector.
| Metric | Value |
|---|---|
| Annual Dividend | $1.372 per share |
| Dividend Yield | 0.76% |
| Consecutive Years of Increases | 14+ years |
| Most Recent Increase | 10.0% (Q4 2024) |
| Dividend Aristocrat Status | No |
Payout Ratios Leave Enormous Room
ITT’s dividend safety starts with remarkably low payout ratios. The company earned $5.99 per share over the trailing twelve months while paying just $1.372 in dividends, translating to an earnings payout ratio of 22.9%. ITT retains more than three quarters of its profits.
In 2024, ITT generated $438.2 million in free cash flow (operating cash flow of $562.1 million minus capital expenditures of $123.9 million) and paid $104.7 million in dividends. That’s a free cash flow payout ratio of just 23.9%, giving the company 4.2 times coverage of its dividend obligations.
| Metric | TTM Value | Assessment |
|---|---|---|
| Earnings Payout Ratio | 22.9% | Very Healthy |
| FCF Payout Ratio | 23.9% | Very Healthy |
| Operating Cash Flow Coverage | 5.4x | Strong |
These ratios remained stable even as ITT grew the dividend at a 19% compound annual rate over the past five years. The company increased its quarterly payment from $0.319 to $0.351 in early 2025, a 10% raise that barely moved the payout ratio.
Minimal Debt Burden Adds Confidence
ITT carries $1.084 billion in total debt against $2.665 billion in shareholders’ equity, producing a debt to equity ratio of just 0.41x. With EBITDA of $815.3 million, the company generates more than enough cash flow to service its obligations comfortably.
Interest expense ran just $36.6 million in 2024, giving ITT an interest coverage ratio exceeding 22 times. Even if earnings fell by half, the company could easily cover its debt service and maintain the dividend.
| Metric | Value | Assessment |
|---|---|---|
| Debt to Equity | 0.41x | Conservative |
| Interest Coverage | 22x+ | Very Strong |
| Cash on Hand | $516.4M | Solid Buffer |
A Quiet But Consistent Track Record
ITT has raised its dividend every year for more than 14 years without a single cut or suspension. The company navigated the 2020 pandemic without touching the dividend, even as net income fell to $72.5 million. By 2024, net income had rebounded to $518.3 million, more than seven times the pandemic low.
| Year | Annual Dividend | YoY Change |
|---|---|---|
| 2025 | $1.404 | +10.0% |
| 2024 | $1.276 | +10.0% |
| 2023 | $1.160 | +9.8% |
| 2022 | $1.056 | +20.0% |
| 2021 | $0.880 | +30.2% |
Management Signals Confidence
CEO Luca Savi stated in the Q3 2025 earnings call: “We enter Q4 and look ahead to 2026 with a ~$2 billion backlog, further growth opportunities in ITT’s core and ramping value creation from our acquisitions.”
ITT’s capital allocation balances dividends with share repurchases. In 2024, the company spent $104.7 million on dividends and $104.5 million buying back shares, a roughly 50/50 split demonstrating dividend commitment without sacrificing other shareholder returns.
This Dividend Is Rock Solid
Dividend Safety Rating: Very Safe
The combination of a 23% payout ratio, 4.2 times free cash flow coverage, minimal debt, and 14 years of uninterrupted increases makes ITT’s dividend exceptionally safe. The company retains so much cash that it could double the dividend tomorrow and still maintain a conservative payout structure.
ITT works well for investors who value dividend growth over current yield and want exposure to industrial growth markets. But if you need a high current yield for income today, 0.76% won’t move the needle for most income portfolios.
Contact [email protected] for any questions or corrections.