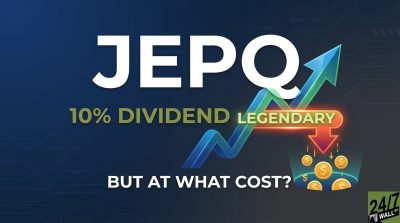
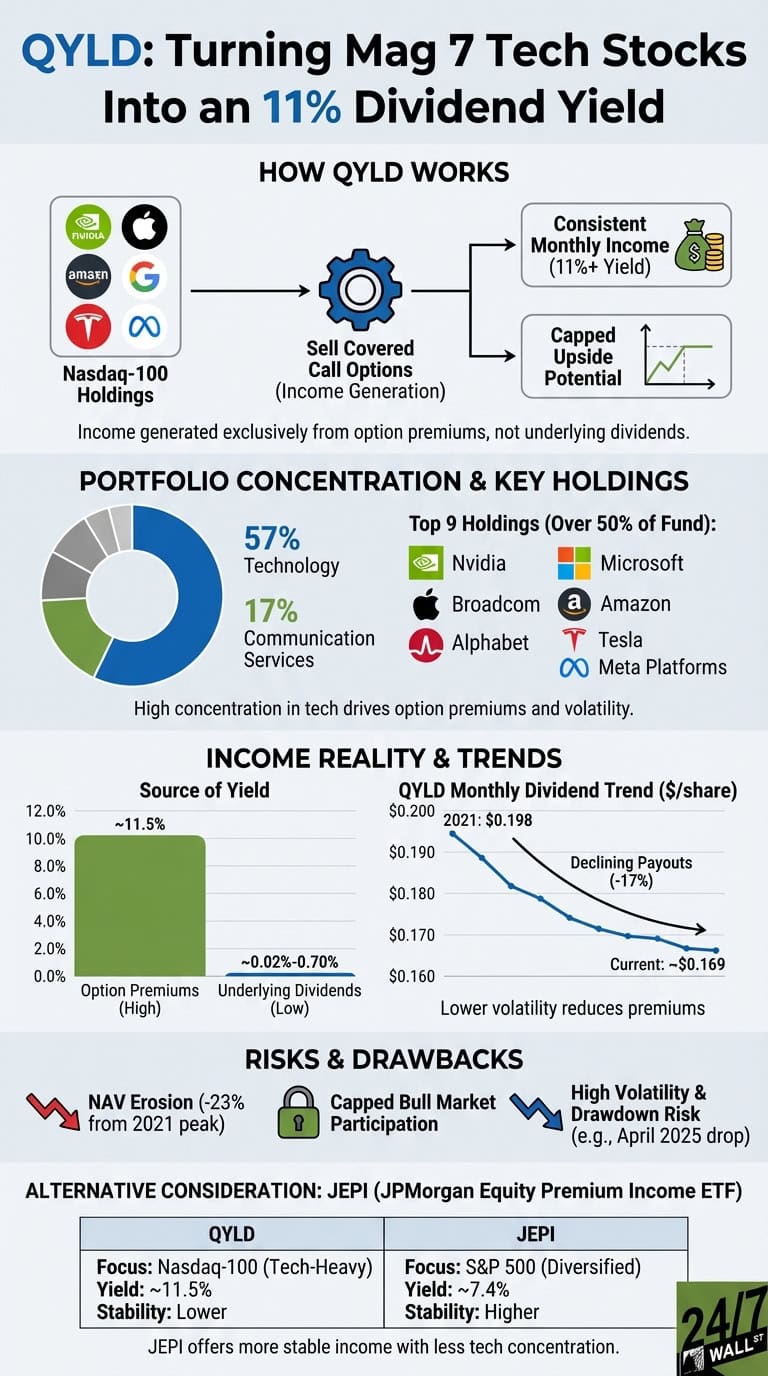
Global X Nasdaq 100 Covered Call ETF (NASDAQ:QYLD) transforms the Nasdaq-100’s top technology stocks into an 11% monthly dividend by selling covered call options against its holdings. Unlike traditional dividend ETFs, QYLD generates income exclusively through option premiums. The fund sells near-the-money call options on its entire portfolio each month, collecting premiums from buyers who purchase the right to buy shares at specific strike prices. This strategy produces consistent monthly income but caps upside participation when tech stocks rally sharply.
The fund’s $8 billion portfolio concentrates heavily in technology at 57% of the total ETF, and communication services at 17%. The top holdings – Nvidia, Apple, Microsoft, Broadcom, Amazon, Alphabet, Tesla, and Meta Platforms – represent over half the fund and drive most option premium generation.
Evaluating Income Sustainability
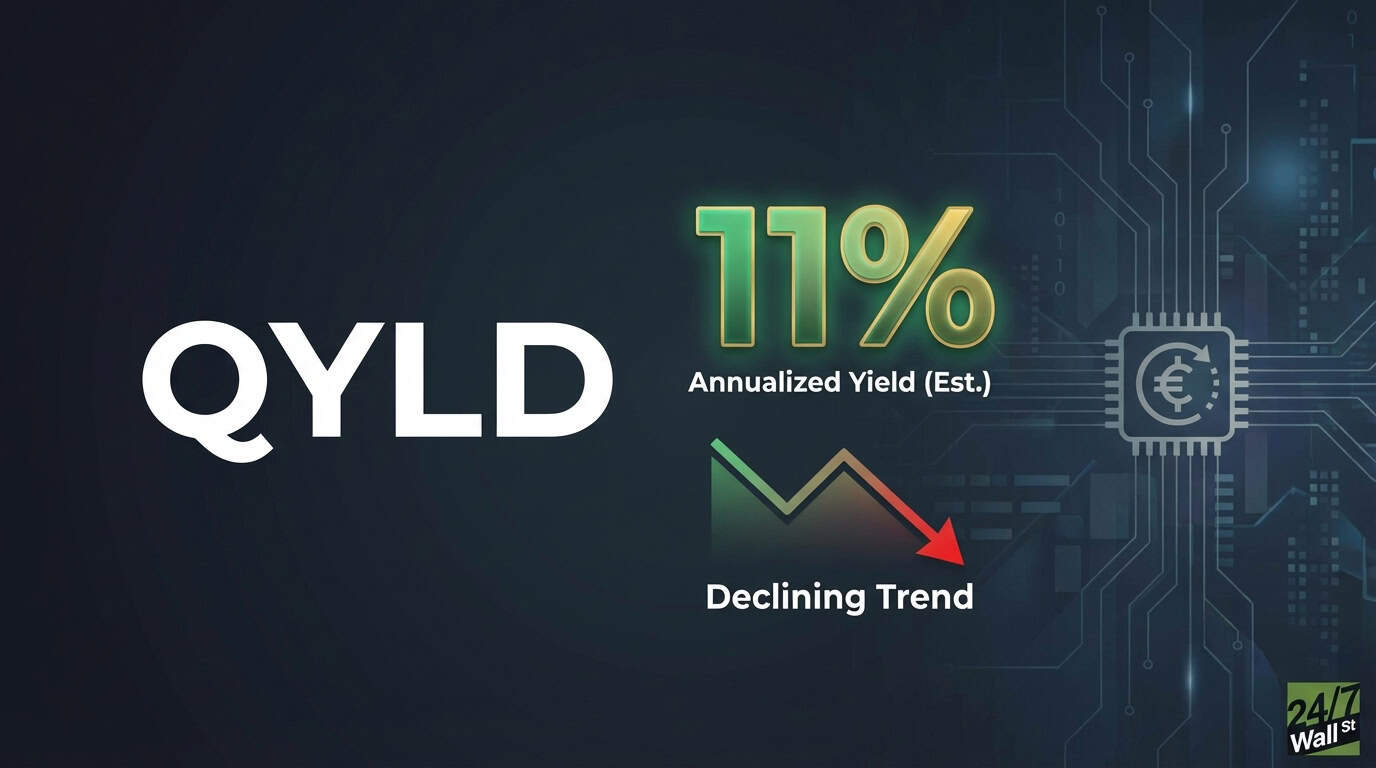
QYLD’s 11.5% yield depends entirely on market volatility, not underlying dividends. The fund’s top holdings pay minimal natural yields: NVDA offers just 0.02%, AAPL 0.37%, and MSFT 0.70%. Amazon pays no dividend. This means QYLD’s monthly distributions fluctuate based on option premium levels, which compress during low-volatility periods.
Recent dividend history reveals declining payouts. Monthly distributions averaged $0.198 in 2021 but have dropped 17% to approximately $0.169 currently. This decline reflects lower implied volatility in tech stocks as markets stabilized following pandemic-era swings. When volatility decreases, call options command lower premiums, directly reducing QYLD’s distributable income.
The fund’s structure also creates total return concerns. While delivering high current income, QYLD’s net asset value has eroded 23% from its December 2021 peak of $22.82 to the current $17.54. This capital depreciation occurs because covered calls cap participation in bull market rallies. When tech stocks surge—as they did throughout 2023-2024—QYLD surrenders upside gains beyond strike prices. Investors receive steady income but miss appreciation that Invesco QQQ Trust (NASDAQ:QQQ) holders capture fully.
The concentration in highly valued tech stocks adds risk. NVDA trades at 46 times earnings with a beta of 2.28, creating extreme volatility that generates premiums but exposes the fund to sharp drawdowns. The April 2025 drop to $14.48 demonstrated this downside vulnerability.
Income reliability remains strong—QYLD has paid monthly since 2013 without interruption. However, distribution amounts fluctuate with market conditions, and the declining trend suggests caution for investors expecting stable 11% yields indefinitely.
Alternative to Consider
JPMorgan Equity Premium Income ETF (NASDAQ:JEPI) offers a more diversified approach to option income generation. Rather than concentrating in tech-heavy Nasdaq stocks, JEPI writes calls on a broader S&P 500-based portfolio with lower volatility stocks. The fund currently yields approximately 7.4% with more stable monthly distributions and less exposure to mega-cap tech concentration risk. JEPI combines equity-linked notes with covered calls, providing flexibility to adjust option strategies based on market conditions while maintaining consistent income generation.
Contact [email protected] for any questions or corrections.