CAVA Group (NYSE: CAVA | CAVA Price Prediction) and Chipotle Mexican Grill (NYSE: CMG) both reported Q3 2025 earnings in late October and early November. CAVA posted 19.9% revenue growth but missed EPS estimates by 7.7%, while Chipotle grew revenue 7.5% and met expectations despite margin pressure.
One Grows Fast, One Grows Profitably
CAVA delivered $292.24 million in revenue, narrowly beating estimates, with same-store sales up 1.9%. The company opened 17 new restaurants and maintained a 37.6% digital mix. Restaurant-level margin compressed to 24.6% from 25.6% a year earlier, driven by higher food, beverage, packaging, and labor costs. Net income fell 17.9% year-over-year to $14.75 million. CEO Brett Schulman emphasized “market share growth” and reinforcing the brand’s “value proposition.”
Chipotle generated $3.0 billion in revenue, slightly missing estimates, with comp sales up 0.3%. The company opened 84 locations, 64 with Chipotlane drive-through formats. Operating margin declined to 15.9% from 16.9%, pressured by labor costs. Net income slipped 1.4% to $382.1 million. CEO Scott Boatwright acknowledged “persistent macroeconomic pressures” but highlighted the brand’s “extraordinary value proposition.” Chipotle’s operating margin remains 2.6 times higher at 16.1% versus 6.3%.

| Metric | CAVA | CMG |
| Revenue Growth YoY | 19.9% | 7.5% |
| Operating Margin | 6.3% | 16.1% |
| Same-Store Sales | +1.9% | +0.3% |
| Digital Mix | 37.6% | 36.7% |
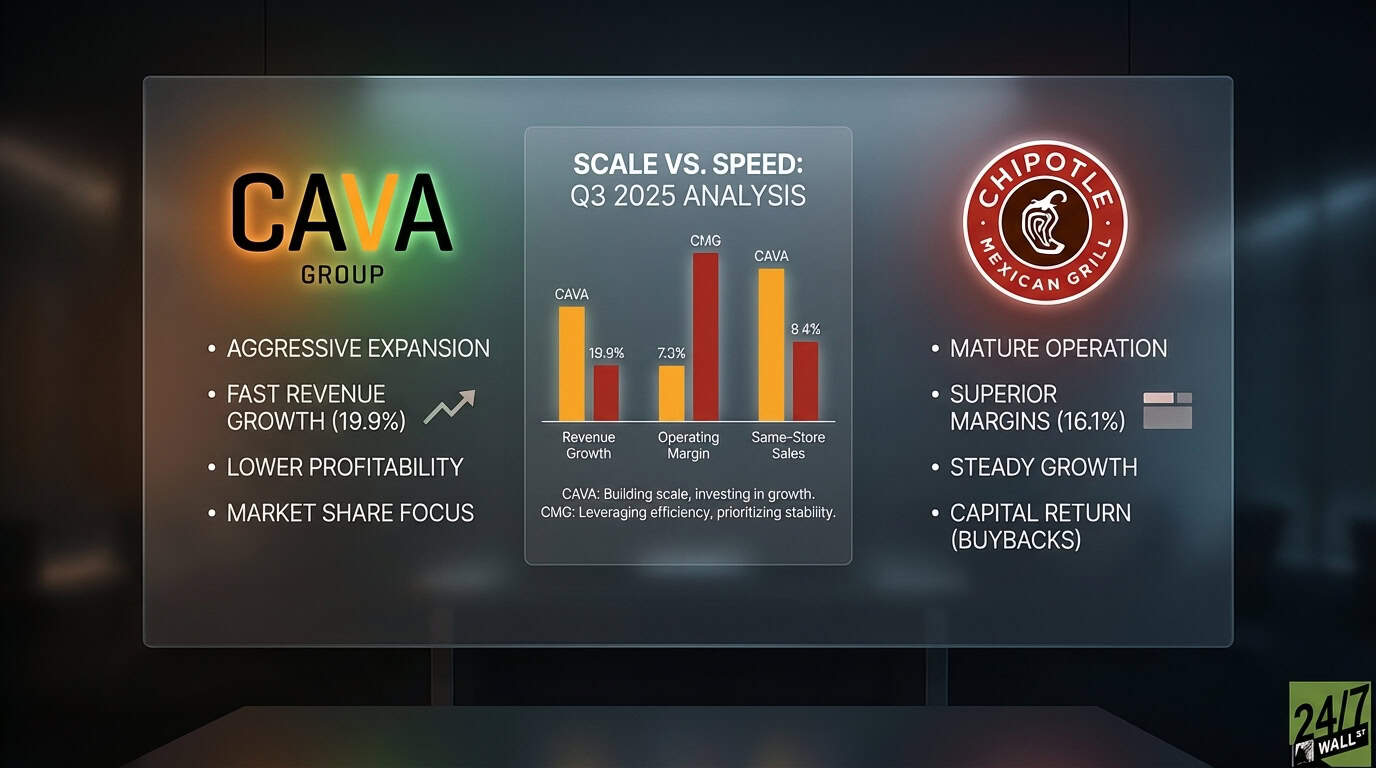
Scale Versus Speed
CAVA is betting on aggressive expansion, targeting 1,000 locations by 2032 from its current base. The Mediterranean fast-casual concept appeals to health-conscious consumers, and the company is gaining market share. But profitability lags. With a 12.1% profit margin and 6.3% operating margin, CAVA is still building operational efficiency. The company trades at 45.8x trailing earnings and 101x forward earnings, pricing in substantial future growth despite recent earnings declines.
Chipotle is leaning into its Chipotlane format, which now represents 80% of new openings. The company plans 315-345 new restaurants in 2025 and 350-370 in 2026, including international expansion. Chipotle’s 13.0% profit margin and 16.1% operating margin reflect a mature, efficient operation. The stock trades at 30x trailing earnings and 28x forward earnings, a 34% discount to CAVA despite superior profitability. Chipotle also deployed $686.5 million on share buybacks in Q3, something CAVA cannot yet afford.
Labor Costs Test Both Models
Both companies face rising labor expenses. CAVA’s restaurant-level margin compression and Chipotle’s operating margin decline both trace back to wage inflation. The difference is scale. Chipotle’s larger footprint and established supply chain provide more leverage to absorb cost increases. CAVA is still building that infrastructure. CAVA’s 1.9% comp growth suggests better traffic momentum than Chipotle’s 0.3%, but Chipotle’s average check grew 1.1%, indicating pricing power.
Chipotle Offers Greater Operational Stability
CAVA’s 19.9% revenue expansion and growth trajectory appeal to growth-focused investors willing to tolerate volatility. The stock’s beta of 2.5 confirms higher risk. Chipotle’s combination of steady growth, superior margins, and capital return reflects a more mature operation. The 16.1% operating margin provides management room to navigate cost pressures without sacrificing profitability. The 30x P/E compares favorably to CAVA’s 45.8x, especially given Chipotle’s positive earnings trajectory versus CAVA’s 20% quarterly earnings decline. Both stocks hit extreme oversold levels in November, with RSI readings near 18, and have since recovered to neutral territory around 51-52. That synchronized selloff suggests sector-wide pressure, not company-specific failure. Key factors to monitor include whether CAVA can stabilize margins while maintaining growth, and whether Chipotle’s Chipotlane format can reignite comp sales. Chipotle’s operational maturity provides lower risk for stability-focused investors.
Contact [email protected] for any questions or corrections.