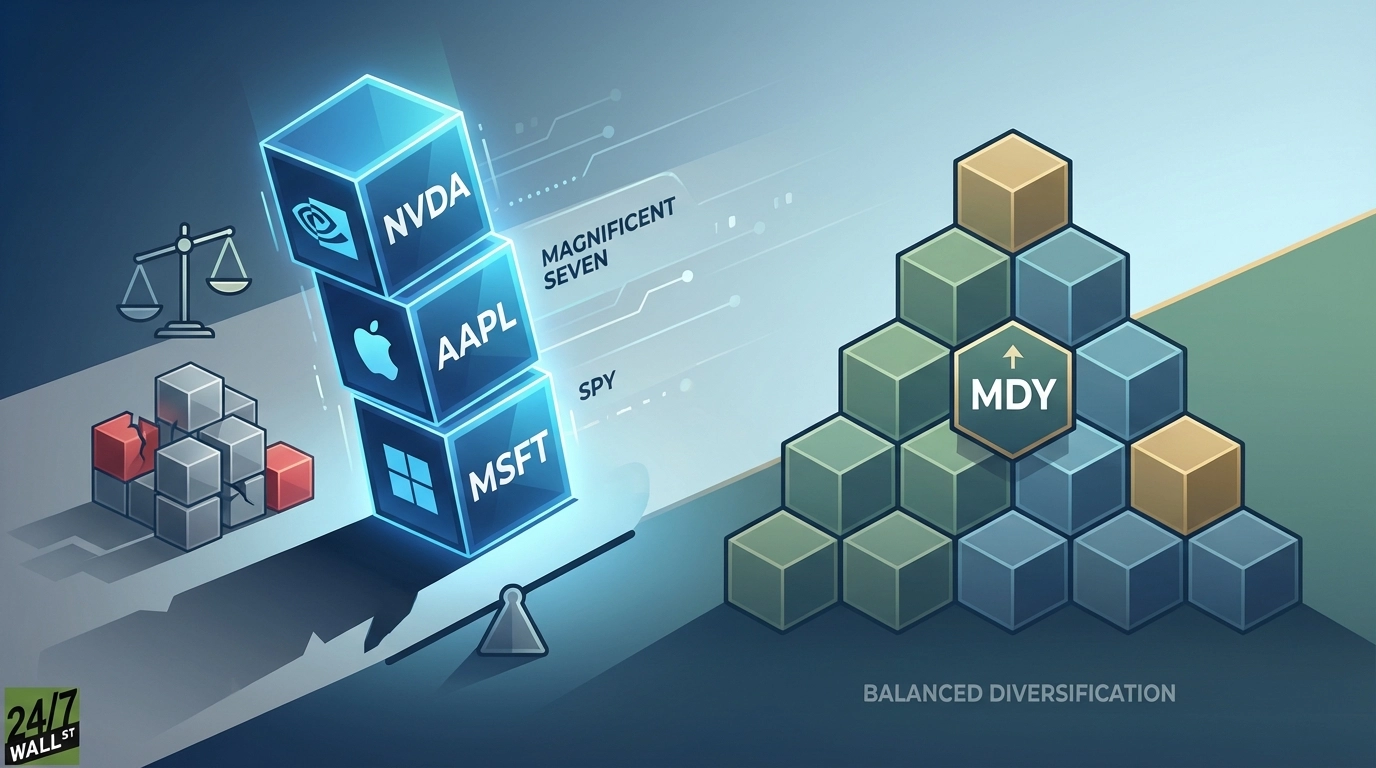
The SPDR S&P 500 ETF Trust (NYSEARCA:SPY) tells a story of increasing concentration. The S&P 500 has become a technology-dominated index, with information technology representing over a third of its weight. This concentration intensifies at the top, where just three mega-cap tech companies control more than a fifth of the entire index’s value—creating a portfolio structure that rises and falls with the fortunes of NVIDIA (NASDAQ:NVDA | NVDA Price Prediction), Apple (NASDAQ:AAPL), and Microsoft (NASDAQ:MSFT). For investors concerned about this mega-cap dominance, the SPDR S&P MidCap 400 ETF Trust (NYSEARCA:MDY) offers a compelling alternative.
The Concentration Problem Is Real
The Magnificent Seven’s dominance reshaped the S&P 500 in 2025, driving these tech giants to comprise roughly a third of the index’s market cap. This concentration created hidden portfolio risk—when these seven stocks surged, they delivered returns that significantly outpaced the broader index, making investors increasingly dependent on a handful of companies to drive their portfolio performance. The result is a market where diversification has given way to concentration, and where a stumble by any of these mega-caps can ripple through millions of portfolios.
MDY’s structure prevents any single company from dominating returns. The largest holding represents just 1.08% of the portfolio, ensuring that no individual stock failure can derail performance. This balanced approach stands in stark contrast to SPY, where the top 10 holdings command over 20% of the index and create concentrated risk.
Different Sectors, Different Risk Profile
MDY’s sector allocation reveals its diversification advantage. Industrials lead the portfolio, followed by financials and information technology, creating a balanced approach that provides exposure to economic growth without the tech-heavy concentration that defines large-cap indexes. Holdings like Comfort Systems USA (NYSE:FIX), Huntington Bancshares (NASDAQ:HBAN), and Ryder System (NYSE:R) represent companies tied to different economic drivers—construction services, regional banking, and transportation logistics.
Performance That Competes
MDY’s five-year track record demonstrates that mid-caps can deliver substantial returns even while trailing the mega-cap-driven surge in SPY. The performance gap tells the story of SPY’s tech concentration advantage during the AI boom—when mega-cap tech stocks surged, SPY captured those gains through its heavy weighting in the Magnificent Seven. But recent performance suggests the narrative is shifting. Through mid-January 2026, MDY’s year-to-date gain more than tripled SPY’s return as investors rotated away from concentrated mega-cap exposure toward the diversification that mid-caps provide.
The ETF charges a competitive expense ratio for broad mid-cap exposure and offers institutional-grade liquidity backed by a three-decade track record since its 1995 inception.
The Tradeoffs to Consider
Mid-cap stocks carry higher volatility than their large-cap counterparts, requiring investors to accept greater price swings in exchange for diversification benefits. This volatility stems from the cyclical nature of mid-cap businesses—when housing markets cooled in 2025, companies like Builders FirstSource (NYSE:BLDR) saw earnings cut in half as construction activity slowed. Despite MDY’s low 16% portfolio turnover suggesting a stable, buy-and-hold approach, individual holdings face business risks that established mega-caps have largely outgrown.
Investors also sacrifice the momentum that has driven large-cap tech. When mega-cap growth accelerates, MDY will likely lag. The five-year performance gap reflects this dynamic—SPY’s tech concentration delivered superior returns during the AI boom.
Who Should Avoid MDY
Investors with short time horizons should look elsewhere. Mid-cap volatility requires patience to weather sector rotations and economic cycles. Those seeking maximum growth exposure during technology bull markets will find MDY’s diversified approach limiting. The ETF’s 13% tech allocation means it won’t capture the full upside when mega-cap names surge.
Consider IJH as an Alternative
The iShares Core S&P Mid-Cap ETF (NYSEARCA:IJH) tracks the same index as MDY but charges just 0.05%—less than one-quarter of MDY’s expense ratio. For long-term holders, this 0.19 percentage point difference compounds significantly. IJH also offers comparable liquidity with over $90 billion in assets. The primary tradeoff is IJH’s shorter track record, having launched in 2000 versus MDY’s 1995 inception.
MDY serves investors seeking to reduce mega-cap concentration without abandoning U.S. equity exposure, but the cost advantage of alternatives like IJH deserves consideration for fee-conscious portfolios.