Super Micro Computer Live: Complete Coverage Of SMCI’s Q2 Earnings
Live Updates
Rack-Scale Capacity Is Ramping Faster Than Expected
The Rack-Scale PnP slide (page 5) quietly reinforces the credibility of the $40B FY26 guide.
Key details:
-
6,000 racks/month capacity by year-end FY26
-
3,000 DLC racks/month
-
150kW racks already shipping in volume, with 250kW/500kW coming
-
63MW of facilities worldwide
This matters because it shows:
-
Q2 wasn’t just backlog release
-
Physical capacity is being built to sustain the run-rate
-
The guide isn’t purely demand-driven — it’s operationally underwritten
That’s a big reason the stock can be up 8% even with margins falling.
DCBBS Is Moving From Pitch to Production
One of the most important signals in the deck is that DCBBS is no longer conceptual.
On the CEO slide (page 3), management explicitly says they are “starting to ship production DCBBS SKUs in volume for key customer engagements.” That’s a meaningful shift from prior quarters, where DCBBS was discussed mostly as a framework or roadmap.
This helps explain:
-
Why revenue scaled so violently in Q2
-
Why margins are temporarily collapsing (full-stack, rack-scale builds are margin-light early)
-
Why investors are willing to look past 6% gross margins for now
Last Thought Before the Call
This quarter answered the demand question decisively, the AI infrastructure orders are real, large, and converting. That’s why the stock is up sharply.
But it did not answer the profitability question.
For now, the market is choosing to reward:
-
Revenue scale
-
Guidance confidence
-
Proof that last quarter’s miss was timing-related
- Margins retracting is a big story to listen for in the call
Future quarters will determine whether this rally sticks, or whether margins pull the story back into question.
Guidance Update
SMCI still up 8.5% after-hours.
Update on guidance:
- Q3 FY2026: Net sales ≥ $12.3B, GAAP EPS ≥ $0.52, non-GAAP EPS ≥ $0.60
- FY2026: Net sales ≥ $40.0B (big step-up vs. prior framing)
Numbers Have Arrived- Stock up 8%
Super Micro is up 8% after reporting a huge Q2 FY2026 top-line beat and raising its full-year revenue outlook, which is exactly what the market needed after last quarter’s “timing” miss. The catch is margin quality: gross margin fell again to 6.3% (from 9.3% last quarter), keeping the profitability debate very alive.
| Metric | Actual | Consensus | Beat / Miss |
|---|---|---|---|
| Revenue | $12.7B | $10.34–$10.44B | 🟢 Beat |
| EPS (Normalized / Non-GAAP, diluted) | $0.69 | $0.48–$0.49 | 🟢 Beat |
| GAAP EPS (diluted) | $0.60 | (not your tracked consensus) | — |
| Gross Margin (GAAP) | 6.3% | (not provided) | 🔴 Deteriorated |
This is a credibility reset quarter on the one thing investors demanded: conversion.
-
Revenue jumping to $12.7B versus $5.0B in Q1 strongly supports management’s prior argument that delayed/shifted deals were pushed into Q2.
-
The company didn’t just beat — it guided higher: FY2026 net sales now expected to be at least $40.0B, well above the prior “$33B+” narrative you highlighted pre-print.
-
Q3 guide of $12.3B+ also implies the demand cycle is continuing, not a one-quarter catch-up.
The red flag that still matters: margins
Gross margin dropping to 6.3% is the main negative. It reinforces the concern that large AI infrastructure wins are coming with aggressive pricing / mix pressure / ramp costs. In other words: yes, the orders are real — but the economics are still getting worse.
Maybe a Password Reset Issue?
Under 10 minutes to the start of the conference call and either IR is locked out of their systems or management is going to ride right into the call without sharing numbers. We shall see.
Will post updates here of the conference call and/ or numbers if we get them in the next few minutes.
15 Minutes Till Conference Call-- Still No Numbers
SMCI is expected to kick off its conference call at 5 pm EST and we are still awaiting earnings. Will post updates as we see them here.
What Was Concerning Last Quarter
1. The Miss Was Too Big to Hand-Wave
Last quarter’s revenue shortfall wasn’t marginal — it was more than $1 billion below guidance. Management framed it as a timing issue tied to design win upgrades and customer readiness, but the scale of the miss damaged credibility. For a company operating at SMCI’s velocity, that kind of gap raises questions about forecasting, execution, or both.
2. “Design Wins” Replaced “Shipments” in the Narrative
Management leaned heavily on $12B+ in new design wins and a $13B backlog, but the language shift mattered. Investors heard a lot about:
-
Wins
-
Pipelines
-
Demand visibility
…and less about:
-
Actual shipments
-
Revenue conversion
-
Near-term delivery schedules
That reinforced the fear that orders are slipping forward, not just briefly delayed.
3. Margins Collapsed at the Worst Possible Time
Gross margin falling to ~9.3%, the lowest level in years, was arguably the most troubling signal. Management pointed to:
-
Mix shift toward large AI infrastructure deals
-
Competitive pricing
-
Ramp inefficiencies
But the takeaway was uncomfortable: AI scale came with margin pain, and there was no clear timeline for recovery.
This introduced a bigger question:
Is SMCI gaining AI exposure at the expense of profitability?
4. Operating Costs Are Rising Faster Than Confidence
Operating expenses jumped sharply as SMCI scaled headcount and infrastructure ahead of demand. That’s fine if revenue converts cleanly — but paired with a revenue miss and margin compression, it made the model feel fragile.
5. Guidance Was Maintained, But Not Reinforced
Keeping the $33B+ full-year revenue target sounded supportive on the surface, but without clear evidence of near-term catch-up, it felt more like hope than proof. The market walked away thinking:
-
The bar stayed high
-
The path to hit it wasn’t fully explained
Still Waiting For SMCI Numbers
Now pushing toward 4:30 pm EST and still waiting on the official earnings numbers to drop. Will post here once they arrive.
By The Numbers
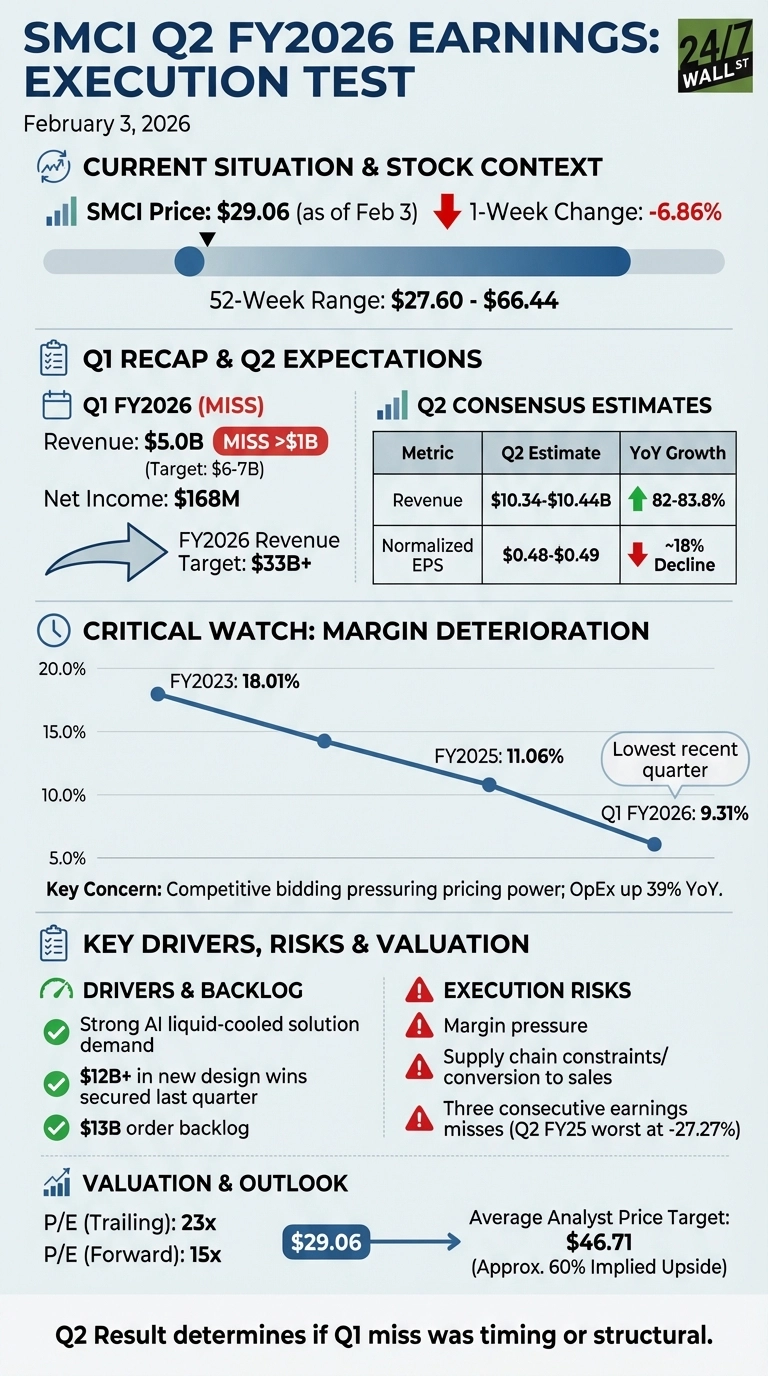
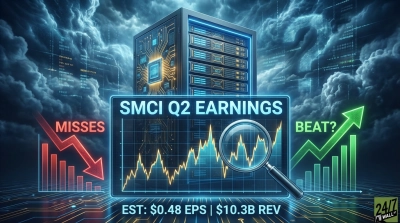
Super Micro Computer (NASDAQ: SMCI | SMCI Price Prediction) reports second-quarter fiscal 2026 results after market closes today. After missing guidance by more than $1 billion in Q1, this report will test whether management can execute on the $12 billion in new design wins they secured last quarter.
A Quarter to Prove Execution
Last quarter was rough. Revenue of $5.0 billion fell short of the $6-7 billion guidance range after design win upgrades pushed revenue into Q2. Net income came in at just $168 million. Management maintained their full-year target of at least $33 billion in revenue, but investors need proof that the delayed orders are actually converting.
Since that report, shares have struggled. The stock trades around $29.06, down 6.86% over the past week and sitting near the bottom of its $27.60-$66.44 52-week range. The company has now missed analyst estimates three consecutive quarters, with Q2 fiscal 2025 delivering the worst miss at -27.27%.
Consensus Estimates
| Metric | Current Quarter (Q2 FY2026) | YoY Growth | Full Year (FY2026) |
|---|---|---|---|
| Revenue | $10.34-$10.44B | 82-83.8% | $33B+ |
| Normalized EPS | $0.48-$0.49 | ~18% decline | Not disclosed |
Margins Will Tell the Real Story
I’ll be watching gross margins more than the top line. The company’s margin profile has deteriorated sharply, falling from 18.01% in fiscal 2023 to 11.06% in fiscal 2025. The most recent quarter showed margins of just 9.31%, the lowest in years.
Analysts at BofA Securities have expressed concern that competitive bidding on large AI infrastructure deals is pressuring pricing power. Operating expenses also jumped 39% year-over-year as the company scales. If margins don’t stabilize or improve this quarter, the revenue growth story loses credibility.
The key question is whether the AI liquid-cooled solution demand management highlighted last quarter is translating into actual orders. Design wins mean nothing if they don’t convert to revenue with acceptable margins. The $13 billion order backlog sounds impressive, but execution has been the problem.
This Quarter Resets Credibility
After three straight misses, management needs to deliver on their guidance. The stock trades at 23x trailing earnings but only 15x forward earnings, suggesting the market expects recovery. Analysts have an average price target of $46.71, implying roughly 60% upside, but that assumes the company can prove it can scale profitably.
If SMCI shows that Q1’s miss was truly a timing issue and margins are stabilizing, sentiment could shift quickly. If they deliver another shortfall or guide cautiously, investors will question whether the AI infrastructure boom is benefiting this company at all.
Contact [email protected] for any questions or corrections.


Joel South covers large-cap stocks, dividend investing, and major market trends, with a focus on earnings analysis, valuation, and turning complex data into actionable insights for investors.
He brings more than 15 years of experience as an investor and financial journalist, including 12 years at The Motley Fool, where he served as an investment analyst, Bureau Chief, and later led the Fool.com investing news desk. He has also co-hosted an investing podcast and appeared across TV and radio discussing market trends.
© 24/7 Wall St.