The promise sounds almost too good: invest your nest egg in JPMorgan Equity Premium Income ETF (NYSEARCA:JEPI), collect 8.21% in monthly distributions, and live comfortably off the income. For retirees tired of bond yields that barely keep pace with inflation, JEPI has become a popular alternative. But retiring on this ETF alone is more complicated than the headline yield suggests.
The Covered Call Trade You Need to Understand
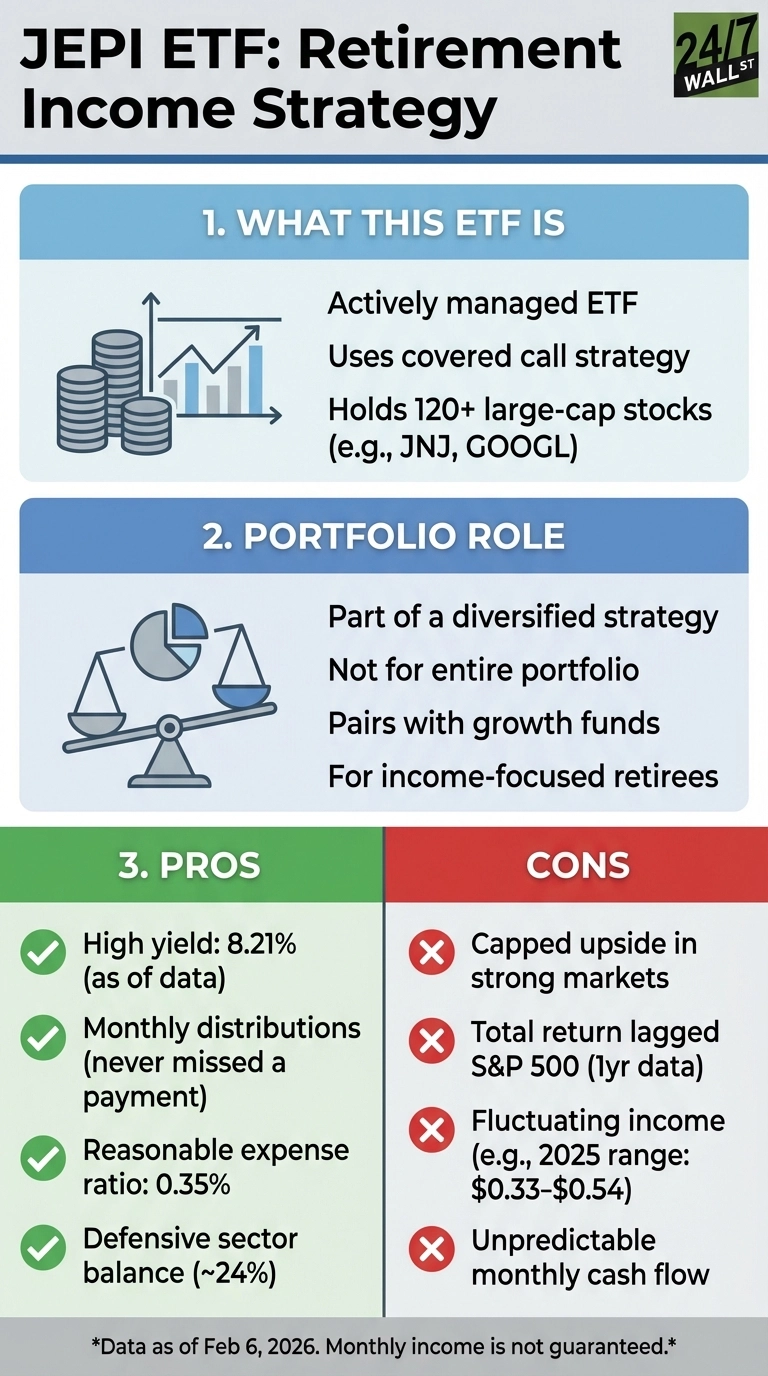
JEPI generates its elevated yield by holding around 120 large-cap stocks while systematically selling call options on those positions. When you sell a call option, you collect a premium upfront but cap your upside if the stock rallies past the strike price. This is the fundamental tradeoff: higher current income in exchange for limited participation in market gains.
The strategy works well in sideways or moderately rising markets. The $41.5 billion fund holds quality names like Johnson & Johnson (NYSE:JNJ | JNJ Price Prediction), Alphabet (NASDAQ:GOOGL), and Microsoft (NASDAQ:MSFT), providing a stable base. But during strong bull runs, JEPI lags significantly behind broader market returns. That gap widens over time and matters for long retirements.
The covered call strategy‘s limitation becomes clear when examining recent performance. JEPI returned 8.49% over the past year, lagging the S&P 500’s 13.47% gain. This performance gap reflects the trade-off inherent in selling call options—you collect premium income today but sacrifice participation when stocks rally strongly.
Dividend growth funds take a different approach. Schwab U.S. Dividend Equity ETF (NYSEARCA:SCHD) captured 17.49% returns by focusing on quality dividend payers without capping upside through options. This shows retirees must choose between maximizing current income versus preserving growth potential for longer retirements.
The Income Isn’t as Steady as It Looks
Monthly distributions from JEPI fluctuate based on market volatility, creating budgeting challenges for retirees with fixed expenses. When markets become turbulent, option premiums increase and distributions can spike significantly. During calmer periods, income drops back down.
Recent 2025 payments illustrate this variability, with monthly distributions ranging from $0.33 to $0.54 per share—a swing that makes it difficult to plan for mortgage payments, insurance premiums, and healthcare costs that don’t fluctuate with market conditions. The fund has never missed a payment since its May 2020 inception, but consistency and reliability are different things.
Where JEPI Actually Fits
JEPI works best as one component of a diversified retirement income strategy, not the entire portfolio. Pairing it with dividend growth funds provides balance between current income and long-term growth potential. SCHD offers lower yield but better total return and dividend growth over time.
The 0.35% expense ratio is reasonable for an actively managed strategy, and the fund’s size provides operational stability. For retirees who can tolerate income fluctuations and want to supplement other income sources like Social Security or pensions, JEPI serves a useful role. But relying exclusively on its 8% yield means accepting capped growth potential and unpredictable monthly cash flow – two significant compromises for a multi-decade retirement.