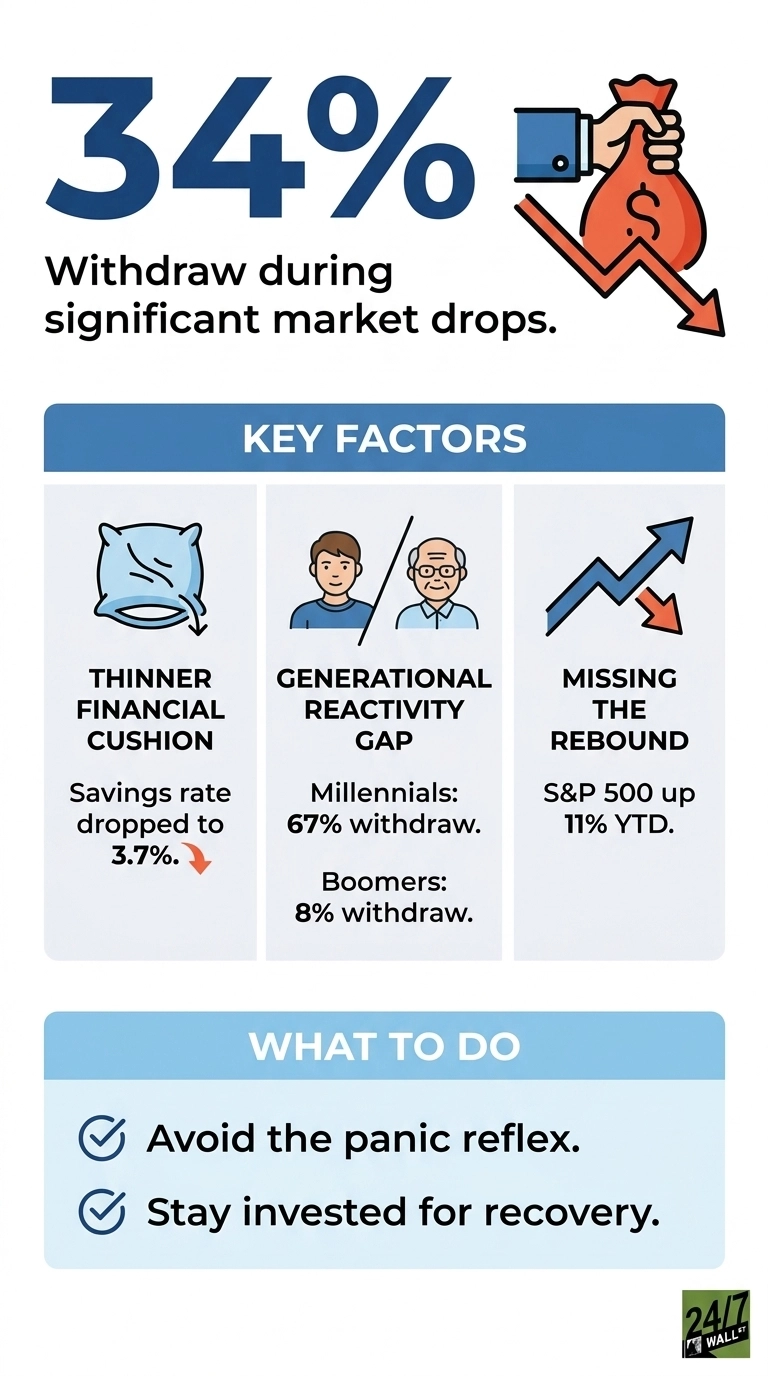
A new behavioral finding from the Allianz Center for the Future of Retirement’s 2026 Annual Retirement Study shows that 34% of Americans typically withdraw money from investments to avoid further losses during a significant market drop, and 57% feel anxious about their financial future when retirement accounts suffer losses. The study, fielded in January 2026 with a nationally representative sample of 1,000 individuals, lands at a moment when markets actually delivered the kind of stress that triggers that reflex.
The VIX, Wall Street’s fear gauge, peaked at 31 on March 27, 2026, well into the territory the index defines as high fear. It stayed elevated through early April before normalizing to 16 as of June 3. Anyone who pulled out of equities during that March stress window missed the rebound. The S&P 500 is up 11% year-to-date and 27% over the past 12 months, which is the cost of reflex decision.
The Anxiety Has A Real Backdrop
Panic-selling has an economic backdrop, with the University of Michigan Consumer Sentiment index falling to 49.8 in April 2026, below the 60 threshold that historically marks recessionary territory, and down from a 12-month peak of 61.7 in July 2025. Initial jobless claims rose to 225,000 for the week ending May 30, an 18.4% increase from a month earlier. Unemployment sits at 4.3%, still low by historical standards but drifting up from the 4.1% reading in June 2025.
The savings cushion is also thinner than it used to be. Consider that the personal savings rate dropped to 3.7% in the first quarter of 2026, down from 6.2% in early 2024. Less cash on the sidelines means more pressure to raid investment accounts when the market wobbles, which is exactly when liquidating does the most damage.
Generations React Differently
The Allianz study found that reactivity to market drops varies sharply by age. Among millennials, 67% immediately check their accounts during volatile periods, and 67% withdraw money to avoid losses. Among boomers, the figures fall to 39% for checking accounts and 8% for withdrawals. Boomers have lived through more drawdowns, which appears to dull the reflex. Younger investors have fewer reference points for what a normal correction looks like and shorter histories of recovery.
The Contradiction At The Center
The most revealing data point in the study is the internal contradiction: 44% of Americans believe they need to keep nearly all of their retirement savings in the stock market to avoid falling behind. At the same time, 59% worry that having nearly all savings in stocks makes them vulnerable to losing too much money. The same person can hold both views. Growth anxiety pushes allocation up, and loss anxiety pushes it back down. When the VIX moves above 30, loss anxiety wins.
The preference data tracks that conflict, with 74% of Americans saying they would rather have financial products that protect against major losses, even if it means giving up bigger gains, and 77% say a guaranteed income stream would decrease their anxiety about spending in retirement. Stated preference favors protection. Actual allocation, for many, leans heavily on equities. The gap is where panic-selling occurs.
What The Data Actually Costs
Selling during a drawdown locks in the loss and forfeits the recovery. The core PCE price index rose to 129.63 in April 2026 from 126.1 in June 2025, which means cash held on the sidelines is also losing purchasing power. The investor who sells equities during a March VIX spike and parks the proceeds in cash takes two losses: the realized loss and the inflation drag while waiting for a signal to re-enter that rarely arrives clearly.
The gap between what investors say they want and what they actually do when markets move is one of the most expensive problems in retirement planning. The Allianz figures document a population that is anxious, contradictory, and reactive at exactly the moments when reacting costs the most. The data documents how many have already been sold, and how rarely that decision pays off.
Contact [email protected] for any questions or corrections.