The Alerian MLP ETF (NYSEARCA:AMLP | AMLP Price Prediction) offers retirees a 7.9% yield through master limited partnerships in energy infrastructure. The fund has significantly increased distributions as natural gas demand surged and pipeline operators benefited from higher utilization rates following the pandemic recovery and European energy crisis, with payouts growing substantially as energy infrastructure assets proved their resilience.
How AMLP Generates Income
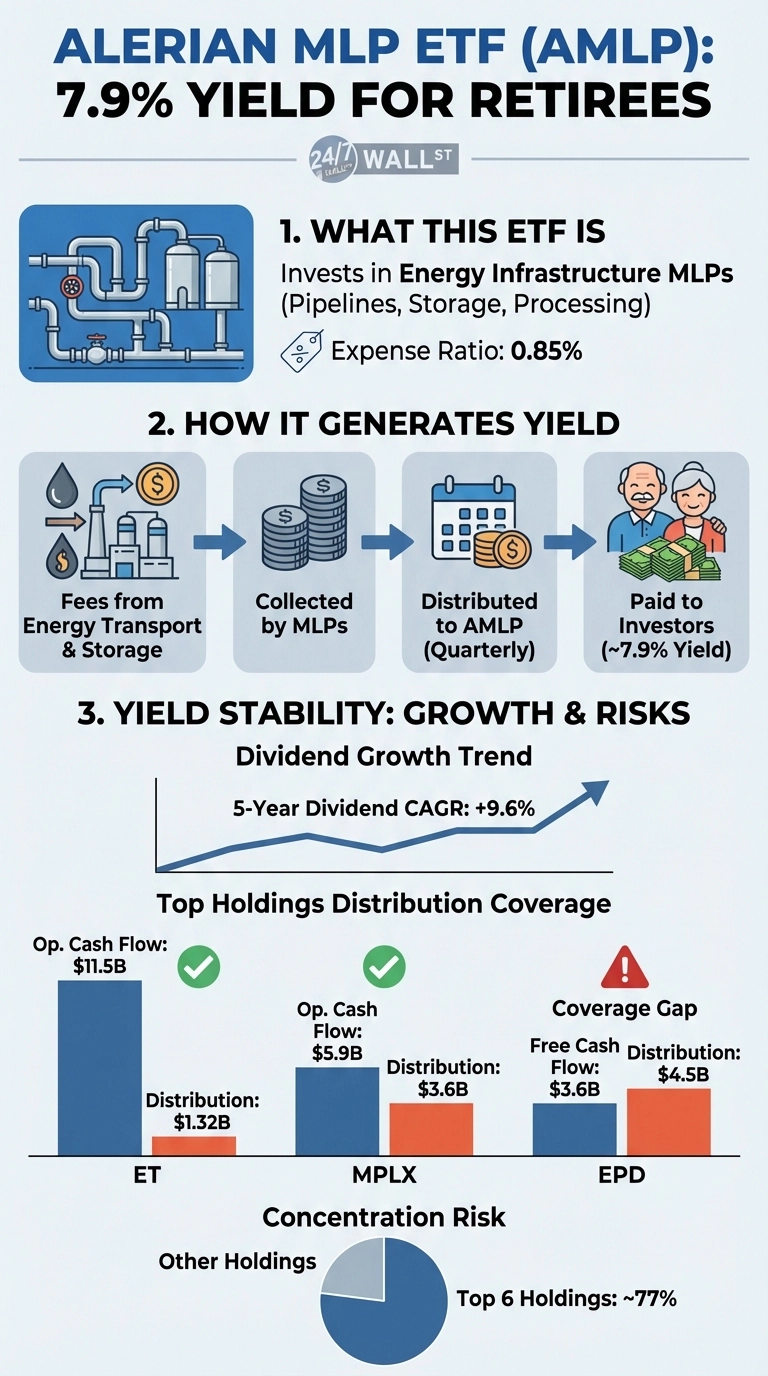
AMLP invests in MLPs that own pipelines, storage facilities, and processing plants. These assets collect fees for transporting and storing oil, natural gas, and refined products, creating predictable cash flows that support quarterly distributions. The ETF passes these distributions to shareholders after deducting its 0.85% expense ratio.
The portfolio is highly concentrated, with the top 6 holdings representing approximately 77% of assets. AMLP’s distribution sustainability depends heavily on whether these core holdings maintain their payouts.
Distribution Safety: Evaluating the Top Holdings
Three MLPs drive the fund’s income: Energy Transfer (NYSE:ET) at 13%, Enterprise Products Partners (NYSE:EPD) at 13%, and MPLX (NYSE:MPLX) at 12%. Together, these three holdings account for 38% of the portfolio, making their distribution sustainability critical to the fund’s overall income stability.
Distribution safety varies significantly among the three MLPs that drive 38% of portfolio income. Energy Transfer demonstrates the strongest coverage, with $11.5 billion in operating cash flow comfortably supporting its $1.32 annual distribution. MPLX follows a similarly conservative approach, generating $5.9 billion in operating cash flow against a $3.6 billion distribution requirement.
Enterprise Products Partners presents a concerning pattern—the partnership distributed $4.5 billion to unitholders while generating only $3.6 billion in free cash flow. This coverage gap represents a structural weakness that could pressure future distributions if the trend continues.
Total Return Considerations
AMLP has delivered strong total returns as energy infrastructure rebounded from chronic underinvestment when oil price crashes and ESG concerns starved the sector of capital. This outperformance reflects investor recognition that these assets generate stable cash flows regardless of commodity price volatility, though the rally may limit upside potential for new buyers at current levels.
The Verdict
AMLP’s 7.9% yield reflects both opportunities and risks in the MLP sector. The distribution has grown steadily from 2021 through 2025, and two of the three largest holdings show adequate coverage. However, Enterprise Products Partners’ inability to cover its distribution from free cash flow represents a structural weakness in the portfolio. The fund’s concentration—with one-third of assets in three MLPs—means the sustainability of these core holdings directly determines the fund’s income stability. The ETF’s 0.85% expense ratio and K-1 tax reporting requirements are additional considerations for income-focused investors.