Vanguard stands as the premier provider of exchange-traded funds (ETFs) and mutual funds, delivering low-cost access to virtually any investment objective an investor may have. Its index-based approach minimizes fees while covering broad markets, sectors, and styles with transparency and efficiency.
With seemingly endless options available across its lineup, investors face a wide array of choices. Yet in the current environment, one ETF stands out as the single most important holding for many portfolios: the Vanguard Value ETF (NYSEARCA:VTV).
Holdings Reveal the Difference
The Value ETF tracks the CRSP US Large Cap Value Index, focusing on large-capitalization value stocks. It holds positions in a diversified set of companies, with recent data indicating around 312 stocks in total. Rather than the large tech stocks found propping up the portfolios of other ETFs, such as the Vanguard S&P 500 ETF (NYSEARCA:VOO) or the Vanguard Total Stock Market ETF (NYSEARCA:VTI), its largest positions emphasize traditional value sectors rather than high-growth momentum.
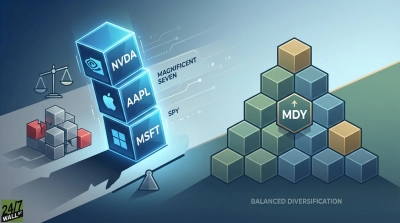
Because they are market-cap-weighted funds, they exhibit heavy concentration in the largest stocks. For example, the S&P 500 ETF — which obviously tracks the S&P 500 — has top positions dominated by the Magnificent 7: Nvidia (NASDAQ:NVDA | NVDA Price Prediction), Apple (NASDAQ:AAPL), Microsoft (NASDAQ:MSFT), Amazon (NASDAQ:AMZN), Alphabet (NASDAQ:GOOG)(NASDAQ:GOOGL), and Tesla (NASDAQ:TSLA), which account for about 34% of VOO.
Similarly, the Total Stock Market ETF, which theoretically provides exposure to thousands of U.S. stocks across all market caps, still shows significant overlap in these mega-cap names. The Magnificent 7 represents roughly 30% of the portfolio, meaning performance in both VOO and VTI remains heavily influenced by a small group of technology giants.
In contrast, the top holdings of the Value ETF are:
| Stock | Percentage of VTV Portfolio |
| JPMorgan Chase (NYSE:JPM) | 3.25% |
| Berkshire Hathaway (NYSE:BRK-B) | 3.04% |
| Exxon Mobil (NYSE:XOM) | 2.42% |
| Johnson & Johnson (NYSE:JNJ) | 2.22% |
| Walmart (NYSE:WMT) | 2.12% |
In fact, the full top 10 positions represent approximately 20.8% of the portfolio, so it is influenced by no one stock or group of stocks.
Performance Edge in Recent Markets
These differences in construction have driven a notable performance divergence in performance in 2026. Year-to-date, the Value ETF has returned approximately 7.7%, comparing favorably to the S&P ETF at 1.5% and the Total Stock Market ETF at 1.8%.
The outperformance stems from market rotation. The Magnificent 7 have declined from 18% (Microsoft) to — at best — a 5.6% gain by Nvidia, with the group as a whole weighing on cap-weighted indexes. Meanwhile, the median S&P 500 stock has risen around 6.8%, the equal-weighted S&P 500 has advanced notably, and broader segments have outperformed the concentrated leaders.
The Value ETF also benefits from its sector allocations, with financial services accounting for 22% of the portfolio, industrials at 16.7%, healthcare at 14.3%, and consumer discretionary at 9.1%. This positioning has captured gains in these segments amid the shift away from mega-cap tech.
Key Takeaway
The technology sector faces repricing pressures tied to artificial intelligence expectations, particularly among software and related companies. While select firms continue to demonstrate AI-driven advancements, the broader group has lagged significantly in 2026. The Magnificent 7 have underperformed the S&P 500, dragging cap-weighted benchmarks near flat or slightly positive, even as 493 of the 500 index constituents and the median stock have posted stronger gains. This highlights the risks in momentum-driven concentration, where overreliance on a few high-valuation names can amplify volatility if expectations adjust or broader sector rotation persists.
The Vanguard Value ETF’s diversified value exposure — with limited concentration in any single stock or the Magnificent 7 — has delivered relative stability and outperformance amid this shift. Its ultra-low expense ratio of 0.03% minimizes costs, supporting long-term compounding. By emphasizing undervalued large-cap stocks with solid fundamentals across multiple sectors, the ETF provides a defensive core for portfolios navigating potential turbulence from AI-related repricing or market corrections.
In an environment where broad market momentum appears vulnerable, the Value ETF offers a balanced, low-cost way to maintain equity exposure with reduced reliance on the narrow group driving recent headlines. For many investors seeking a robust defense today, it stands out as a foundational holding grounded in safety and growth.