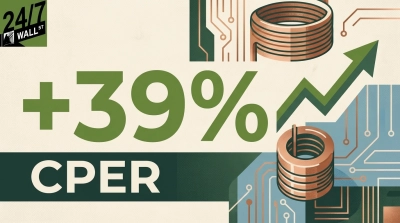
CPER is up roughly 28% over the past year, outpacing the S&P 500’s 15.5% gain over the same period, and the structural forces behind that move are only getting louder. United States Copper Index Fund (NYSEARCA:CPER) is one way U.S. investors can access copper price movements through a futures-based ETF without buying contracts directly. Understanding what drives CPER from here requires looking past the price chart.
The fund tracks NYMEX and COMEX copper futures contracts and carries an expense ratio of 1.06%. It does not hold physical copper, and that distinction matters enormously.
The Macro Force That Will Shape Copper’s Next Move
The biggest macro driver for CPER over the next 12 months is the structural demand surge tied to electrification and AI infrastructure. Venture capitalist Chamath Palihapitiya called copper “the best Artificial Intelligence investment for 2026” and predicted it will go “absolutely parabolic.” On Reddit, a post titled ‘Copper ETF vs physical copper?’ on r/investing drew 37 comments debating copper’s role in AI infrastructure investment, reflecting the broader community interest in the space.
S&P Global projects a copper deficit of more than 10 million metric tons by 2040 as energy transition demand rises roughly 50%, while global mine production is expected to peak by 2030 and then decline.
On the supply side, the world’s largest copper producer, Codelco, has already lowered its output forecasts due to declining ore grades and operational setbacks. These aren’t temporary disruptions. They represent a structural tightening that gives the long-term demand story real teeth.
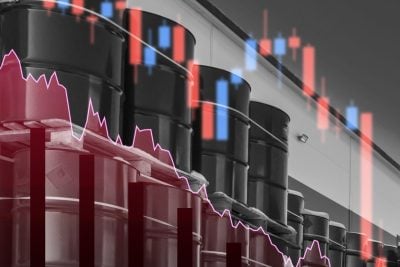
The risk worth watching is tariff policy. When a 50% copper tariff was announced in mid-2025, CPER surged to record highs, then plunged roughly 19% when refined copper was later exempted. That kind of whipsaw can overwhelm any fundamental thesis in the short term.
The ETF Mechanic Most Investors Miss
Because CPER holds futures rather than physical copper, it is exposed to a structural drag called contango. When futures markets are in contango, the price of copper for future delivery is higher than today’s price, forcing the fund to sell expiring contracts and buy more expensive ones each month. This roll cost erodes returns relative to spot copper prices, meaning CPER can underperform the commodity it tracks even when copper prices are rising. The CME Group’s copper futures curve provides the clearest picture of current market structure.
If the copper market shifts into backwardation, where near-term contracts trade above longer-dated ones, CPER would actually benefit from rolling, turning that structural headwind into a tailwind.
What to Watch Over the Next 12 Months
If the structural supply deficit tightens faster than more skeptical analyst models anticipate and the futures curve moves into backwardation, CPER’s returns would likely reflect those gains. The reverse is equally true: a tariff policy reversal or demand disappointment from China could compress prices quickly, and contango drag would compound those losses.
Contact [email protected] for any questions or corrections.