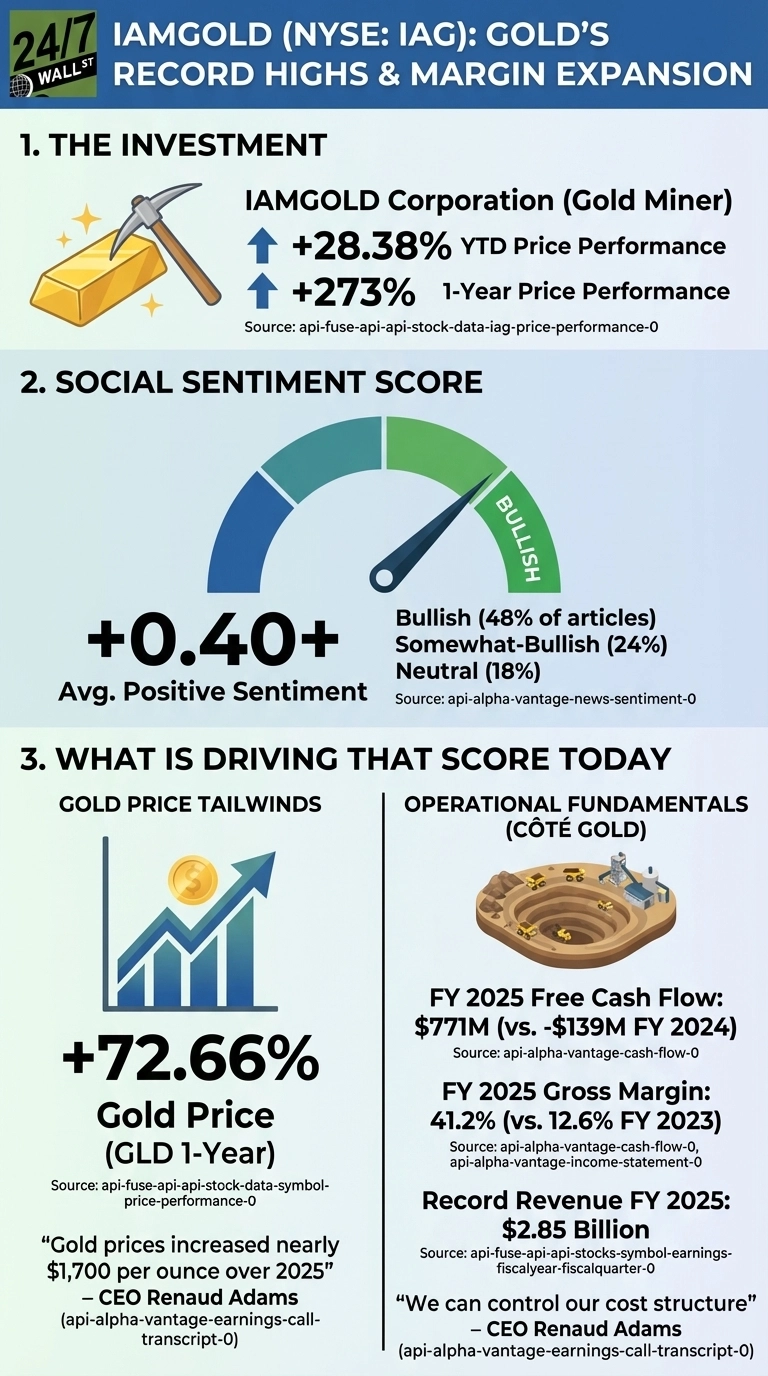
One of the standout performers in the gold mining space this year, IAMGOLD (NYSE:IAG), has seen its shares jump 28.38% year-to-date and an extraordinary 273% over the past twelve months. The question analysts and observers are asking: Is this a fundamentals story, or is IAMGOLD simply riding gold’s coattails?
The honest answer is both as gold itself is up 72.66% over the same one-year period via the SPDR Gold Shares (NYSEARCA:GLD) ETF, meaning IAG has delivered roughly four times gold’s return. That kind of outperformance suggests something real is happening at the operational level.
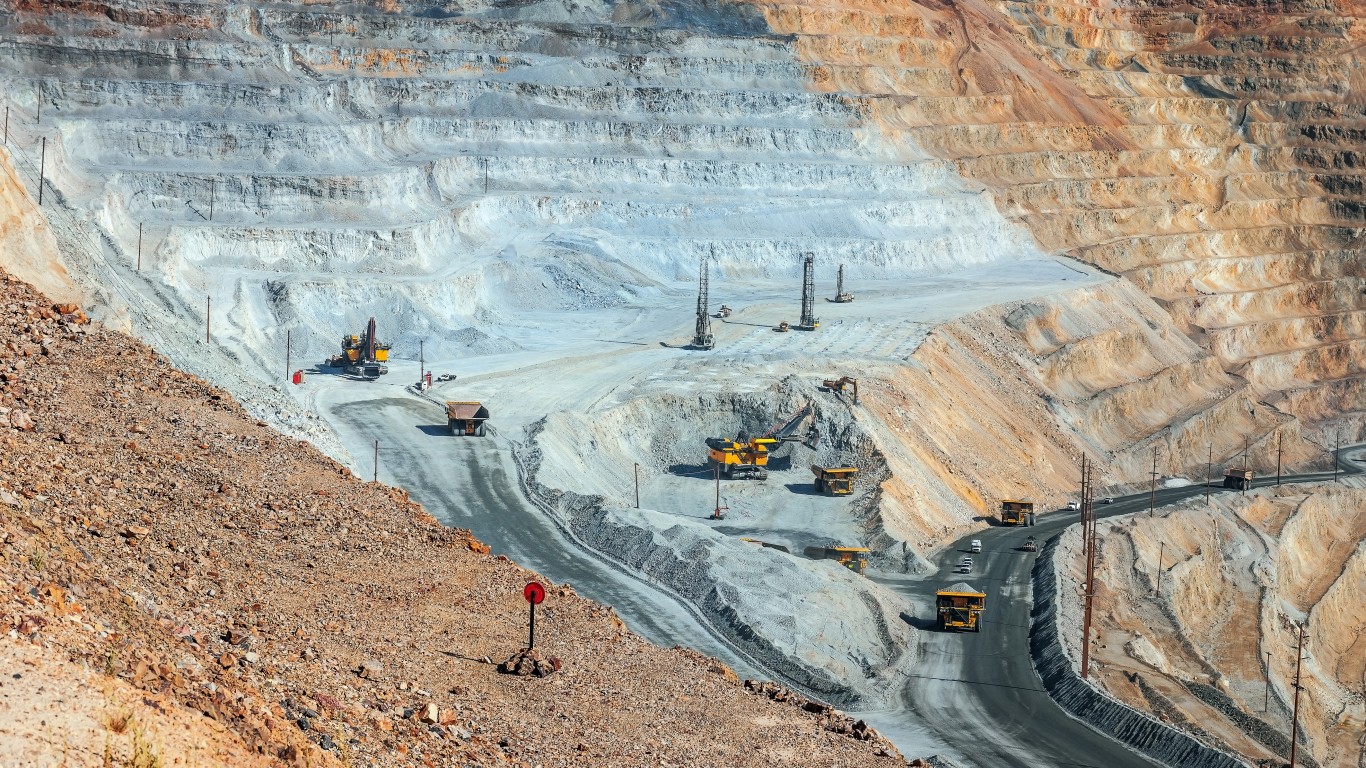
The Côté Gold mine is the clearest explanation. After years of development spending that pushed free cash flow deeply negative, IAMGOLD posted full-year 2025 revenue of $2.85 billion and adjusted EBITDA of $1.5 billion, with operating cash flow exceeding $1 billion, including $702 million in Q4 alone. Gross margin expanded from 12.6% in 2023 to 41.2% in 2025, a shift that tracks closely with Côté reaching nameplate throughput.
Côté Gold Is Changing IAMGOLD’s Cost Profile
CEO Renaud Adams acknowledged the gold price tailwind but pointed to what the company can actually control: “While we cannot control the gold price, we can control our cost structure and ensure that cost improvement opportunities come down with our production product.” The plan to eliminate the temporary aggregate crushing circuit by mid-2026 is expected to reduce processing costs by $4 to $5 per tonne, a concrete operational lever independent of gold prices.
The free cash flow swing is the most compelling data point. IAMGOLD generated $771 million in free cash flow in 2025 after three consecutive years of negative FCF while Côté was under construction. That cash funded the repayment of the entire $300 million second-lien term loan and the $100 million share buyback program.
Key Risks and Institutional Signals
Institutional investors have taken notice, with Vanguard increasing its stake to 22.7 million shares and TD Asset Management growing its position by 43.5%. The contrarian signal is a director selling 31,000 shares at C$32.79 to C$32.91 in late February, reducing his holding by more than 60%.
The key risk is straightforward: IAMGOLD’s 2026 AISC guidance of $2,000 to $2,150 per ounce against a gold price assumption of $4,000 leaves a healthy margin, but that buffer shrinks fast if gold retreats. The operational improvements are real, but they were built on a gold price that has nearly doubled in two years. The Côté expansion technical report, due in Q4 2026, will offer the clearest picture yet of whether the cost trajectory holds independent of commodity luck.