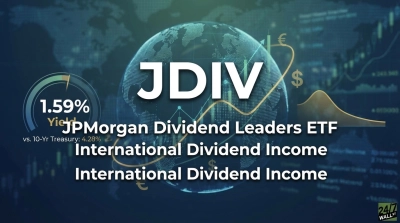
JPMorgan Dividend Leaders ETF (NYSEARCA:JDIV) launched in September 2024 with an appealing premise: a curated portfolio of global dividend leaders. The name implies income. The reality is a 1.59% yield at a time when the 10-year Treasury sits at 4.20%. That gap is hard to ignore for income-focused investors.
| Metric | Value |
|---|---|
| Dividend Yield | 1.59% |
| Net Expense Ratio | 0.47% |
| Net Assets | $9.9 million |
| Inception Date | September 25, 2024 |
| 10-Year Treasury Yield | 4.20% |
| Fed Funds Rate | 3.75% |
A 1.59% Yield Is Not What “Dividend Leaders” Should Mean
The yield gap is striking. The 10-year Treasury currently yields 4.20%, meaning investors accept significantly less yield to own this ETF. Even the Fed Funds Rate at 3.75% dwarfs what JDIV pays. For an income-oriented product, that is a meaningful hurdle to clear on total return alone.
The distribution history shows real inconsistency. JDIV paid $0.35988 per share in June 2025, dropped to $0.16771 in September, and $0.11728 in March 2025. Those swings make income planning difficult for investors who rely on predictable cash flows.
The Holdings Tell a Different Story Than the Name
The top three positions are Taiwan Semiconductor (6.26%), Microsoft (4.37%), and Broadcom (3.49%). These are excellent companies, but growth-oriented technology names, not high-yield dividend stalwarts. Meta Platforms, which only recently initiated a dividend and yields well under 1%, also sits in the top 15 at 1.96% of the portfolio.
Classic dividend payers like Johnson & Johnson, AbbVie, and McDonald’s are present but represent smaller slices. The portfolio leans into dividend growth rather than current income, a legitimate strategy that conflicts with what the name implies.
The Cost Structure Does Not Help the Case
JDIV charges 0.47% annually. Compare that to Schwab U.S. Dividend Equity ETF (NYSEARCA:SCHD), which charges just 0.06% and yields 3.39%. The fee and yield differences between the two funds are notable for investors comparing dividend ETF options. SCHD also carries $85.9 billion in assets versus JDIV’s $9.9 million.
| Metric | JDIV | SCHD |
|---|---|---|
| Dividend Yield | 1.59% | 3.39% |
| Expense Ratio | 0.47% | 0.06% |
| Net Assets | $9.9M | $85.9B |
| 1-Year Price Return | +12.79% | +13.81% |
The Total Return Argument Only Goes So Far
JDIV is up 12.79% over the past year, which is respectable. But SCHD matched that with a 13.81% one-year gain while paying more than twice the yield and charging a fraction of the fee. The yield shortfall relative to total return is a consideration for income-focused investors.
JDIV is not a bad ETF. Its global diversification and dividend growth approach may appeal to long-horizon investors. Income investors should know what they are getting: a dividend growth fund with a modest current yield, not a high-income vehicle.
Contact [email protected] for any questions or corrections.