NNN REIT’s 36-Year Dividend Streak Meets Its Toughest Test Yet

Photo of David Beren
By David Beren Published

Quick Read

  • National Retail Properties (NNN) raised its dividend for 36 consecutive years through two recessions and the pandemic, now yielding 5.6% at $42.99 with a 70% AFFO payout ratio and 2026 guidance of $3.52-$3.58 per share representing 3.2% growth. The $931M in 2025 acquisitions at 7.4% cap rate carry 97% escalators while Q4 occupancy recovered to 98.3%, though impairment losses jumped 4x year-over-year to $28.6M signaling underlying tenant stress despite headline occupancy.

  • NNN’s fortress dividend and 10.2-year weighted lease term provide structural support, but 80 basis points of occupancy improvement came primarily from selling vacant assets rather than re-leasing them, and insider CEO selling without offsetting purchases alongside board transitions inject uncertainty into an otherwise methodical story.

  • If you're focused on picking the right stocks and ETFs you may be missing the bigger picture: retirement income. That is exactly what The Definitive Guide to Retirement Income was created to solve, and it's free today. Read more here
This post may contain links from our sponsors and affiliates, and Flywheel Publishing may receive compensation for actions taken through them.
NNN REIT’s 36-Year Dividend Streak Meets Its Toughest Test Yet

© TierneyMJ / Shutterstock.com

Few REITs can claim what NNN REIT (NYSE:NNN) has quietly built over three and a half decades: a dividend raised every single year since 1990, through two recessions, a global pandemic, and the sharpest rate-hiking cycle in a generation. With occupancy having improved to 98.3% in Q4 2025 and the stock trading near $42.46 as of March 20, the question is whether this is a structural floor or a temporary ceiling.

The Occupancy Story Is More Nuanced Than the Headline

The 98.3% figure marks an 80-basis-point sequential recovery from Q3 2025’s 97.5%, itself the low point after tenant stress from Frisch’s Restaurants and Badcock Furniture, which rejected leases for 32 properties, pushing vacancies to roughly 90 properties at their peak. CEO Steve Horn framed the recovery plainly: “Our occupancy is up 80 basis points from last quarter to 98.3%, which is in line with our long-term average of roughly 98%.” Most of that gain came from selling vacant assets rather than re-leasing them, a distinction the CFO was candid about on the earnings call.

The full-year impairment picture adds context: $28.6 million in impairment losses in 2025 versus $6.6 million in 2024, a 4x-plus jump reflecting real tenant credit deterioration even as headline occupancy held near historical norms. Same-store rental income grew just 0.4% in Q4 2025, or 1.1% excluding bankruptcy-affected properties.

The Dividend Fortress Has 36 Years of Proof

NNN raised its dividend through the 2008 financial crisis, holding at $0.375 per quarter through 2009 before increasing again in 2010, and through the 2020 pandemic, nudging from $0.515 to $0.52. The current quarterly rate of $0.60 per share yields approximately 5.65% at today’s price, compared with the 10-year Treasury at 4.38%. That spread of roughly 127 basis points above the risk-free rate is the core income argument for the stock.

The payout is well covered: AFFO payout ratio is 65.7%, with 2026 AFFO guidance of $3.52 to $3.58 per share, representing approximately 3.2% growth. Horn’s stated long-term goal is “mid-single digit growth over the long term.”

Valuation and What Analysts See

Looking at what analysts believe is next for NNN, UBS raised its price target to $45 from $43 on March 9 while maintaining a Neutral rating. The analyst consensus target sits at $45.23, implying modest upside from current levels. Of 17 analyst ratings, 10 are Hold, 4 are Buy or Strong Buy, and 3 are Strong Sell. The stock trades at a P/E of roughly 21.9x with a five-year beta of 0.83, reflecting its historically lower volatility relative to the broader market.

One risk worth watching: significant insider selling by CEO Stephen Horn with no offsetting insider purchases, alongside a board leadership transition. Neither is disqualifying on its own, but they add uncertainty to an otherwise methodical story.

NNN’s $931 million in record 2025 acquisitions at a 7.4% initial cap rate, with 97% of annualized base rent carrying built-in escalators, gives the portfolio structural momentum. Whether that momentum is already priced in remains the question the market has not yet decisively answered.

An infographic titled 'The 36-Year Fortress: Is NNN's 98% Occupancy the Ultimate Recession Shield?' presents NNN REIT's financial data. It is divided into four sections. Section 1, 'NNN REIT SNAPSHOT,' displays key metrics: Stock Price $42.99 (as of March 20, 2026), Current Occupancy 98.3% (Q4 2025), a 36 CONSECUTIVE YEARS Dividend Increase Streak, Current Dividend Yield 5.6%, and Weighted Average Remaining Lease Term 10.2 YEARS. Section 2, 'OCCUPANCY & TENANT HEALTH TRENDS,' features a line graph showing occupancy percentages from Q1 2025 (97.7%) to Q4 2025 (98.3% after a low of 97.5% in Q3 2025), and bar charts for 2024 ($6.6 MILLION) and 2025 ($28.6 MILLION) Impairment Losses. Section 3, 'THE 36-YEAR DIVIDEND FORTRESS,' is a timeline illustrating dividend history from 1990, through the 2008-2009 Financial Crisis and 2020 Global Pandemic, to the Current Quarterly Dividend of $0.60. It also shows a 70% AFFO Payout Ratio (Q4 2025) and 2026 AFFO Guidance ($3.52-$3.58 per share). Section 4, 'VALUATION, ANALYST VIEWS & GROWTH,' includes a pie chart titled 'Analyst Ratings' with a total of '17 Analyst Ratings', showing segments for 4 BUY/STRONG BUY (Positive), 10 HOLD (Neutral), and 3 STRONG SELL (Negative), as well as a P/E Ratio of ~21x, a Beta of 0.82, and an Analyst Consensus Price Target of $45.23. Details on Growth Momentum for 2025 Acquisitions ($931 MILLION) and Rent Escalators (97% with built-in increases) are provided, along with identified Risks such as insider selling and tenant stress.
24/7 Wall St.
This infographic provides a detailed snapshot of NNN REIT’s financial performance, highlighting its 98.3% occupancy, 36-year streak of dividend increases, and analyst sentiment as of March 20, 2026.

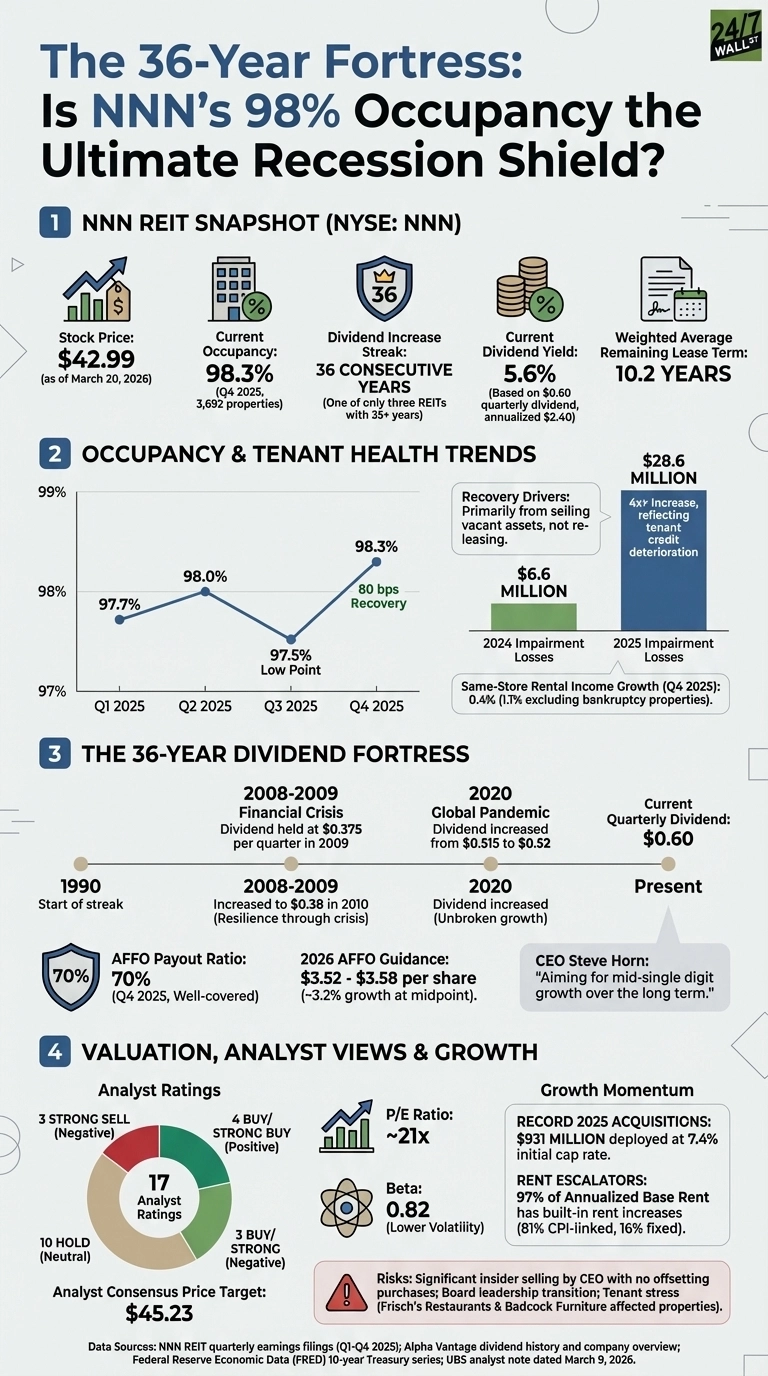
Data Sources: NNN REIT quarterly earnings filings (Q1-Q4 2025); Alpha Vantage dividend history and company overview; Federal Reserve Economic Data (FRED) 10-year Treasury series; UBS analyst note dated March 9, 2026.

Photo of David Beren
About the Author David Beren →

David Beren has been a Flywheel Publishing contributor since 2022. Writing for 24/7 Wall St. since 2023, David loves to write about topics of all shapes and sizes. As a technology expert, David focuses heavily on consumer electronics brands, automobiles, and general technology. He has previously written for LifeWire, formerly About.com.

As a part-time freelance writer, David’s “day job” has been working on and leading social media for multiple Fortune 100 brands. David loves the flexibility of this field and its ability to reach customers exactly where they like to spend their time. Additionally, David previously published his own blog, TmoNews.com, which reached 3 million readers in its first year.

In addition to freelance and social media work, David loves to spend time with his family and children and relive the glory days of video game consoles by playing any retro game console he can get his hands on.

Featured Reads

Our top personal finance-related articles today. Your wallet will thank you later.

Continue Reading

Top Gaining Stocks

ALB Vol: 2,898,719
+$10.86
+6.93%
$167.56
PLTR Vol: 57,503,716
+$10.16
+6.74%
$160.84
NCLH Vol: 24,239,338
+$1.17
+6.17%
$20.12
MHK Vol: 1,346,194
+$5.62
+5.84%
$101.83
RCL Vol: 3,828,936
+$15.31
+5.81%
$278.96

Top Losing Stocks

EL Vol: 9,878,489
-$6.63
7.72%
$79.29
ENPH Vol: 5,869,325
-$3.35
7.59%
$40.76
FICO Vol: 460,617
-$64.29
5.70%
$1,063.33
CNC Vol: 9,827,468
-$1.59
4.62%
$32.81
MU Vol: 54,804,580
-$18.55
4.39%
$404.35