Gabelli’s 10.5% Yield Comes With a Hidden Cost Retirees Should Know

Photo of David Beren
By David Beren Published

Quick Read

  • Gabelli Equity Trust (GAB) maintains a 10.5% yield through a 10% distribution policy on average net asset value, funded by portfolio dividends, realized capital gains, and return of capital when needed; the fund launched a $170.6M rights offering in early 2026 to expand its asset base and share count. SPDR S&P 500 ETF Trust (SPY) has outperformed GAB on price return, gaining 18% versus GAB’s 13% over the past year, with GAB trailing by about 1-2% annually over five and ten-year periods due to its value-oriented tilt and limited mega-cap tech exposure.

  • GAB’s distribution consistency depends on equity market returns generating sufficient dividends and realized gains to sustain the 10% policy, and its 17% leverage at 3.75% borrowing costs creates a structural risk if markets decline sharply or if new capital from the rights offering deploys at lower returns than the existing portfolio.

  • The analyst who called NVIDIA in 2010 just named his top 10 AI stocks. Get them here FREE.

This post may contain links from our sponsors and affiliates, and Flywheel Publishing may receive compensation for actions taken through them.
Gabelli’s 10.5% Yield Comes With a Hidden Cost Retirees Should Know

© Worawee Meepian / iStock via Getty Images

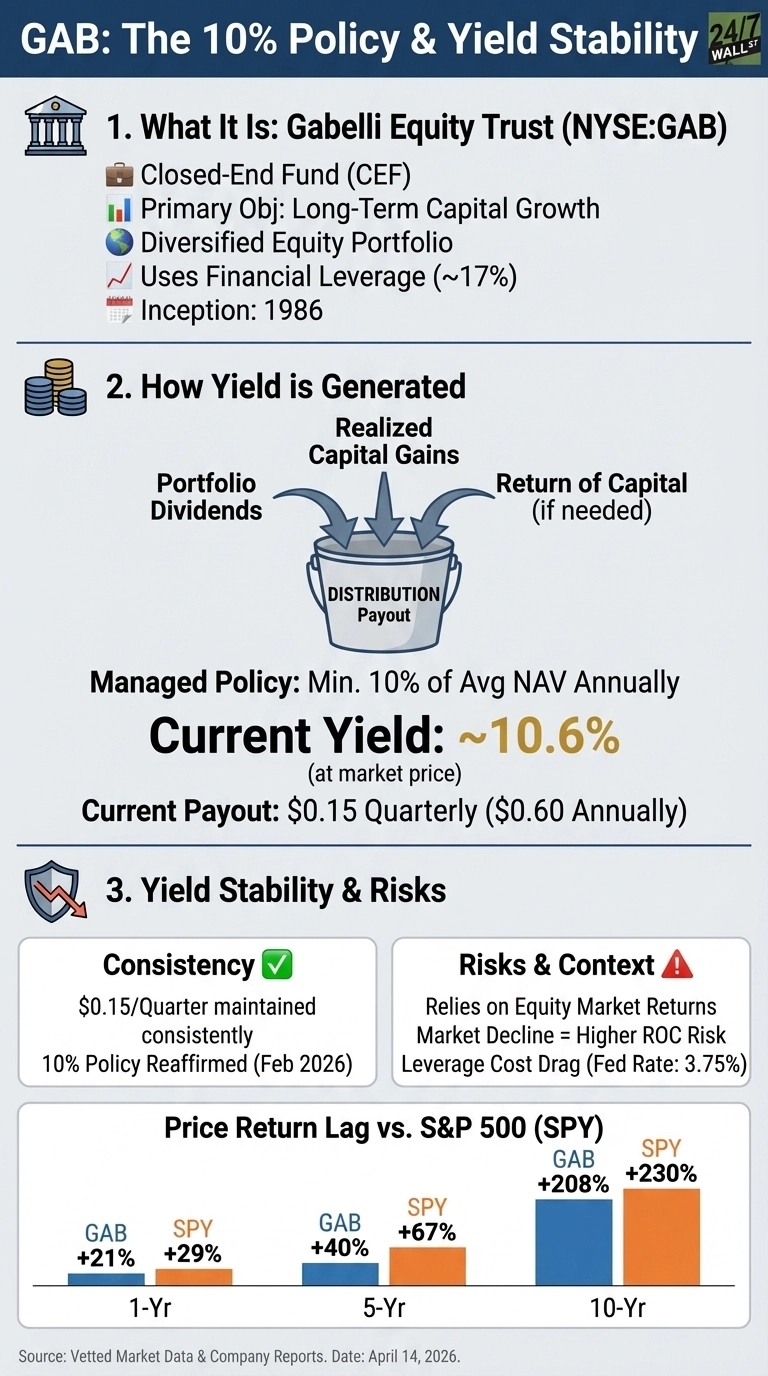
A closed-end management name focusing on long-term capital, Gabelli Equity Trust (NYSE:GAB) has committed to paying at least 10% of its average net asset value annually since its inception in 1986, a policy that yields roughly 10.5% at current prices. That headline number draws income investors, but the mechanics beneath it are more complex.

How GAB Generates Its Distributions

GAB is a closed-end management investment company whose primary investment objective is long-term capital growth, with income as a secondary objective. The fund holds a diversified equity portfolio across sectors, including Financial Services (14%), Equipment and Supplies (9%), Food and Beverage (7%), Diversified Industrial (6%), and Entertainment (5%), with top holdings that include Berkshire Hathaway, AMETEK, American Express, Mastercard, and Deere & Co.

Income flows from three sources: dividends on portfolio holdings, realized capital gains from trading, and return of capital when those first two fall short. The fund’s policy commits to distributing 10% of average NAV annually, regardless of what the portfolio actually earns. The November 2025 press release illustrated this directly. Based on quarter-end NAVs of $5.24, $5.15, $5.41, and $5.61, the 10% policy-mandated distribution would equal $0.54 annually. The fund declared $0.60 per share annually, with quarterly payments of $0.15, slightly above the baseline. The Q1 2026 distribution announcement confirmed the composition: primarily return of capital.

The 2026 Rights Offering

In early 2026, GAB launched a transferable rights offering. The original subscription price of $5.50 per share was reduced to $5.00 per share on March 31, 2026, and the expiration was extended to April 21, 2026. The offering involves 31.1 million new common shares, with estimated net proceeds of approximately $170.6 million.

Rights offerings expand the share count and asset base simultaneously. If new assets earn at the same rate as existing ones, per-share distributions can be maintained. The risk is dilution if new capital is deployed at lower returns than the existing portfolio.

Leverage and Expenses

GAB is a leveraged fund. Total debt stands at $347 million, representing 17% effective leverage, with a total expense ratio of about 2%, including roughly 0.3% in interest expense. The fund’s expense ratio is 1.6% before financing costs.

With the Fed Funds Rate at 3.75% and the 10-year Treasury yielding around 4.3%, leverage costs remain a drag. The Fed cut rates by 75 basis points over the past year, providing modest relief, but the portfolio must clear expenses and interest before distributions become self-funding. Total return has been strong: the trailing 12-month NAV total return reached 20%.

Price Performance vs. the S&P 500

On price return alone, GAB trails the S&P 500 across most measured periods. GAB gained roughly 13% over the past year versus about 18% for the SPDR S&P 500 ETF Trust (NYSEARCA:SPY). Over five years, GAB returned roughly 7%, compared with about 12% for SPY. Over 10 years, GAB returned roughly 12%, compared with about 14% for SPY on an annualized basis. Adding back cumulative distributions narrows that gap significantly. The fund carries a value-oriented tilt with limited exposure to mega-cap technology, which has led the S&P 500 over the same periods.

 
An infographic titled 'GAB: The 10% Policy & Yield Stability' by 24/7 Wall St. The infographic is divided into four sections. Section 1, 'What It Is: Gabelli Equity Trust (NYSE:GAB)', describes GAB as a Closed-End Fund (CEF) with a primary objective of long-term capital growth, a diversified equity portfolio, use of financial leverage (~17%), and an inception year of 1986. Section 2, 'How Yield is Generated', features a diagram showing portfolio dividends, realized capital gains, and return of capital (if needed) flowing into a 'Distribution Payout' bucket. It states a managed policy of 'Min. 10% of Avg NAV Annually', a 'Current Yield: ~10.6% (at market price)', and a 'Current Payout: $0.15 Quarterly ($0.60 Annually)'. Section 3, 'Yield Stability & Risks', has two subsections: 'Consistency' (green checkmark icon) stating '$0.15/Quarter maintained consistently' and '10% Policy Reaffirmed (Feb 2026)'; and 'Risks & Context' (red exclamation icon) mentioning 'Relies on Equity Market Returns', 'Market Decline = Higher ROC Risk', and 'Leverage Cost Drag (Fed Rate: 3.75%)'. The final section, 'Price Return Lag vs. S&P 500 (SPY)', is a bar chart comparing GAB and SPY performance. For 1-Yr, GAB is +21% (blue bar) and SPY is +29% (orange bar). For 5-Yr, GAB is +40% (blue bar) and SPY is +67% (orange bar). For 10-Yr, GAB is +208% (blue bar) and SPY is +230% (orange bar). The source is 'Vetted Market Data & Company Reports' and the date is 'April 14, 2026'.
24/7 Wall St.
This infographic illustrates Gabelli Equity Trust’s (GAB) 10% distribution policy, how its yield is generated, and its historical price return performance against the S&P 500 (SPY).

Year to date in 2026, GAB shares are down about 5%, while SPY is roughly flat at up 0.6%. The fund currently trades at a discount to NAV of about 4.6%, narrower than its 5-year average discount of nearly 7%.

Distribution Consistency and Risk

The $0.15 quarterly distribution has been maintained without interruption. The five most recent quarterly payments, from March 2025 through March 2026, were all exactly $0.15 per share. Insider Mario J. Gabelli purchased 500,000 shares in December 2025.

The structural risk is straightforward: when equity markets fall sharply, realized capital gains dry up, and return of capital becomes a larger share of each distribution. A prolonged downturn could erode NAV and pressure the distribution itself. The VIX recently spiked above 30 in late March 2026 before normalizing to the low 20s.

What the Distribution Policy Means for Income Investors

Overall, GAB’s 10% managed distribution policy depends on equity market returns generating enough in dividends and realized gains to avoid persistent NAV erosion. The 2026 rights offering adds capital but also expands the obligation to sustain per-share distributions. GAB fits income investors who accept equity market exposure as the price of a high yield. Those comparing it to the S&P 500 on a total-return basis will find that the fund has generally lagged, with the distribution bridging only part of that gap.

Data Sources

Photo of David Beren
About the Author David Beren →

David Beren has been a Flywheel Publishing contributor since 2022. Writing for 24/7 Wall St. since 2023, David loves to write about topics of all shapes and sizes. As a technology expert, David focuses heavily on consumer electronics brands, automobiles, and general technology. He has previously written for LifeWire, formerly About.com. As a part-time freelance writer, David’s “day job” has been working on and leading social media for multiple Fortune 100 brands. David loves the flexibility of this field and its ability to reach customers exactly where they like to spend their time. Additionally, David previously published his own blog, TmoNews.com, which reached 3 million readers in its first year. In addition to freelance and social media work, David loves to spend time with his family and children and relive the glory days of video game consoles by playing any retro game console he can get his hands on.

Continue Reading

Top Gaining Stocks

MU Vol: 51,642,733
DAL Vol: 16,214,004
AXON Vol: 1,529,668
COIN Vol: 10,680,747
TDG Vol: 470,477

Top Losing Stocks

KMX Vol: 13,473,160
AKAM Vol: 8,644,569
APA
APA Vol: 7,769,291
WFC Vol: 32,161,351
CHTR Vol: 2,428,725