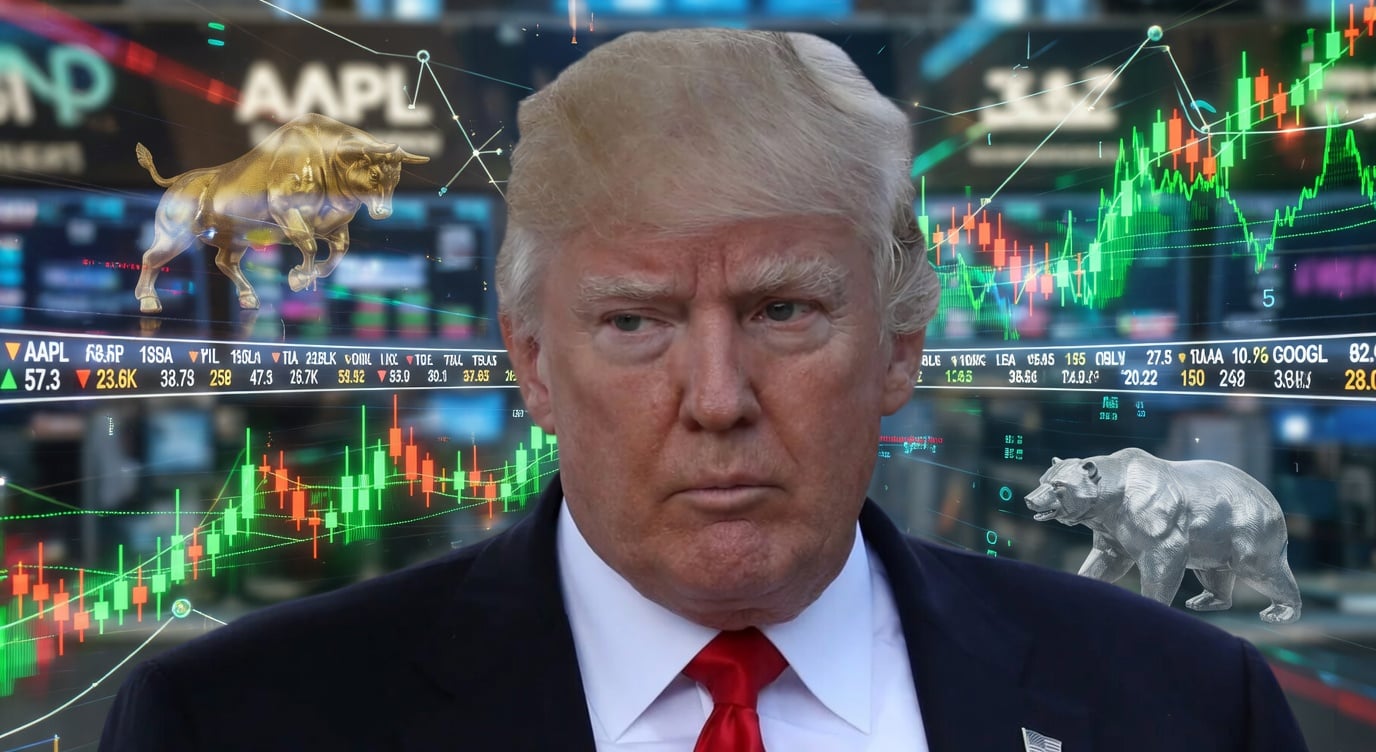
President Donald Trump’s second term has delivered a stock market rally few investors expected would survive the turbulence thrown at it. Tariff battles rattled global trade. The so-called “SaaS-pocalypse” crushed once-highflying software stocks. Treasury yields climbed above 5% more than once. Yet each pullback eventually gave way to another rebound, pushing the S&P 500 to fresh record highs.
That resilience has been remarkable, but what if the market’s biggest risk isn’t tariffs, inflation, or even geopolitics — but simple valuation math?
More than 150 years of market history suggests that risk is becoming difficult to ignore.
This Valuation Ratio Is Flashing a Rare Warning
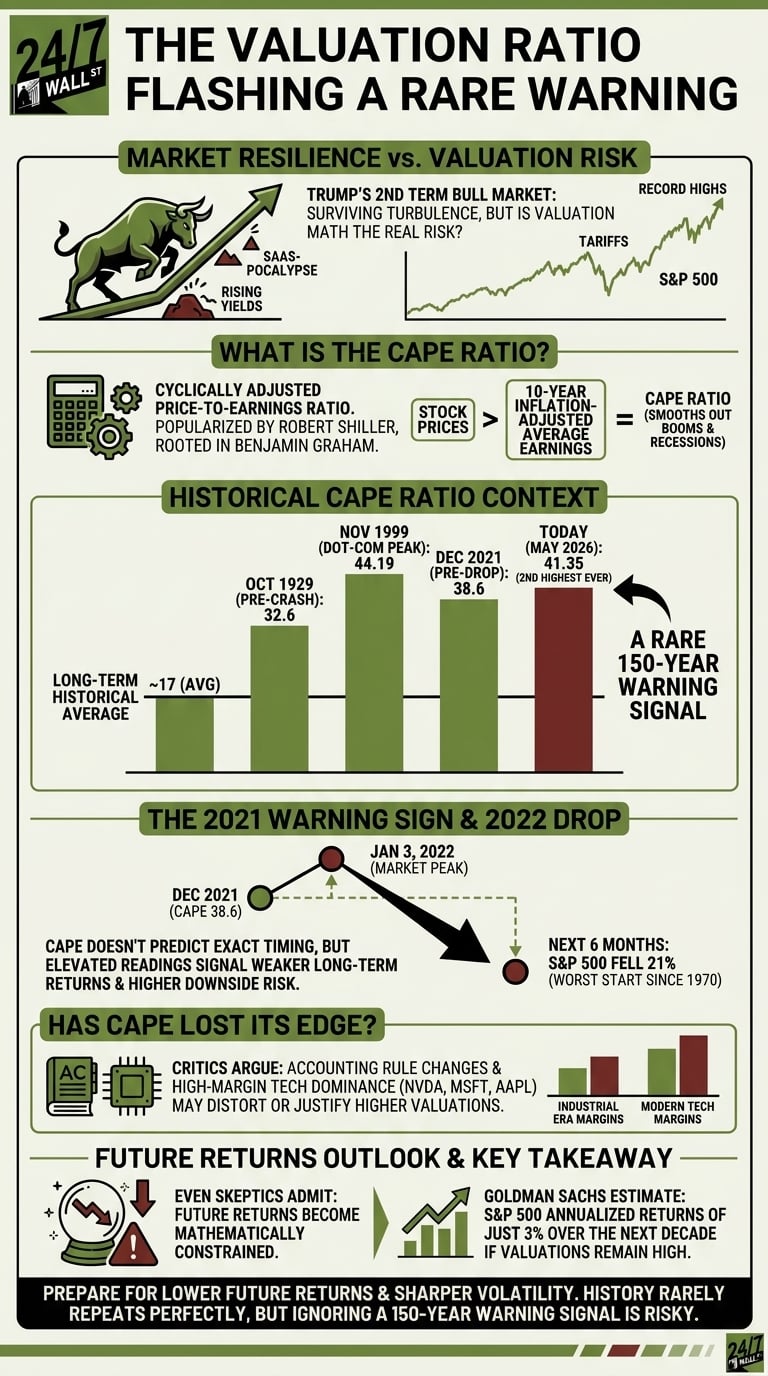
The warning sign comes from the cyclically adjusted price-to-earnings ratio, better known as the CAPE ratio. The metric was popularized by Nobel Prize-winning economist Robert Shiller, though its roots trace back to value-investing pioneer Benjamin Graham.
Unlike a standard P/E ratio that compares stock prices to one year of earnings, the CAPE ratio uses inflation-adjusted average earnings over the prior 10 years. The idea is simple: smooth out temporary booms and recessions to get a clearer picture of whether stocks are expensive or cheap.
Shiller backtested the metric using market data stretching back to the 1870s. The long-term average CAPE ratio for the S&P sits around 17.
Today, the CAPE ratio stands at 41.35, the second-highest reading in recorded market history. Only November 1999’s dot-com bubble peak was higher at 44.19.
For perspective:
| Period | CAPE Ratio |
| Historical average | ~17 |
| October 1929 | 32.6 |
| December 2021 | 38.6 |
| May 2026 | 41.35 |
That December 2021 reading matters because the market peaked just days later on Jan. 3, 2022. Over the next six months, the S&P 500 fell 21% — the worst start to a year since 1970.
Let’s be clear: CAPE does not predict exact timing. Markets can remain expensive longer than investors expect. The late 1990s proved that. But historically, elevated CAPE readings have consistently pointed to weaker long-term returns and higher downside risk.
Regardless of how you look at it, 41 times cyclically adjusted earnings is historically rare territory.
 History’s rarest warning signal is back—and it predicts the most stagnant decade for stocks since the 1970s.
Why Some Investors Think CAPE Has Lost Its Edge
Granted, not everyone believes the CAPE ratio carries the same predictive power it once did. Critics argue accounting-rule changes implemented during the 2000s and 2010s distorted reported earnings, especially during recessions. Under modern GAAP standards, companies now recognize certain losses faster than they once did, which can depress the 10-year earnings average that CAPE relies on.
Others point to the growing dominance of high-margin technology companies like Nvidia (NASDAQ:NVDA | NVDA Price Prediction), Microsoft (NASDAQ:MSFT), and Apple (NASDAQ:AAPL) that generate profit margins and free cash flow levels industrial-era companies could not match. In that sense, today’s market arguably deserves higher valuations than markets from the 1950s or 1970s.
That said, even many CAPE skeptics admit valuations still matter eventually. Surprisingly, some of the strongest defenders of modern tech valuations also acknowledge that future returns become mathematically constrained when investors pay premium prices. Goldman Sachs estimated earlier this year that the S&P 500 could generate annualized returns of just 3% over the next decade if valuations remain near current levels.
In other words, even if the market avoids a crash, history suggests forward returns may disappoint investors accustomed to the post-2023 rally.
Key Takeaway
In short, Trump’s second-term bull market has survived nearly every stress test thrown at it — tariffs, inflation scares, software-stock collapses, and rising rates among them. The market’s resilience has rewarded investors who stayed patient during each sell-off.
But valuation risk is now impossible to dismiss. The CAPE ratio sitting at 41.35 does not guarantee an imminent bear market. It does, however, place today’s market alongside only a handful of periods that eventually ended painfully for investors — including 1929, 2000, and 2022.
When all is said and done, smart investors should probably prepare for lower future returns and sharper volatility, even if the bull market has a little more room left to run. History rarely repeats perfectly on Wall Street, but it rhymes often enough that sharp investors ignoring a 150-year warning signal do so at their own risk.
Contact [email protected] for any questions or corrections.