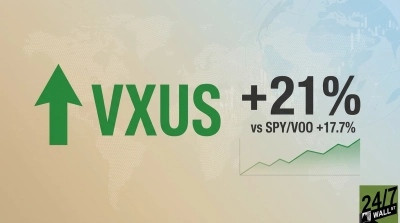
For five years, the case for international diversification has felt theoretical. Vanguard Total International Stock Index Fund ETF Shares (NASDAQ:VXUS) is the cleanest way to own roughly half of global market capitalization, yet U.S. investors who held it watched the S&P 500 pull away year after year. That has shifted in 2026. VXUS is up about 10% year to date, while the Vanguard S&P 500 ETF (NYSEARCA:VOO) has returned roughly 8% over the same stretch. The gap is small, but for VXUS holders it is the first meaningful YTD lead over the S&P 500 since 2021.
What VXUS Is Built to Do
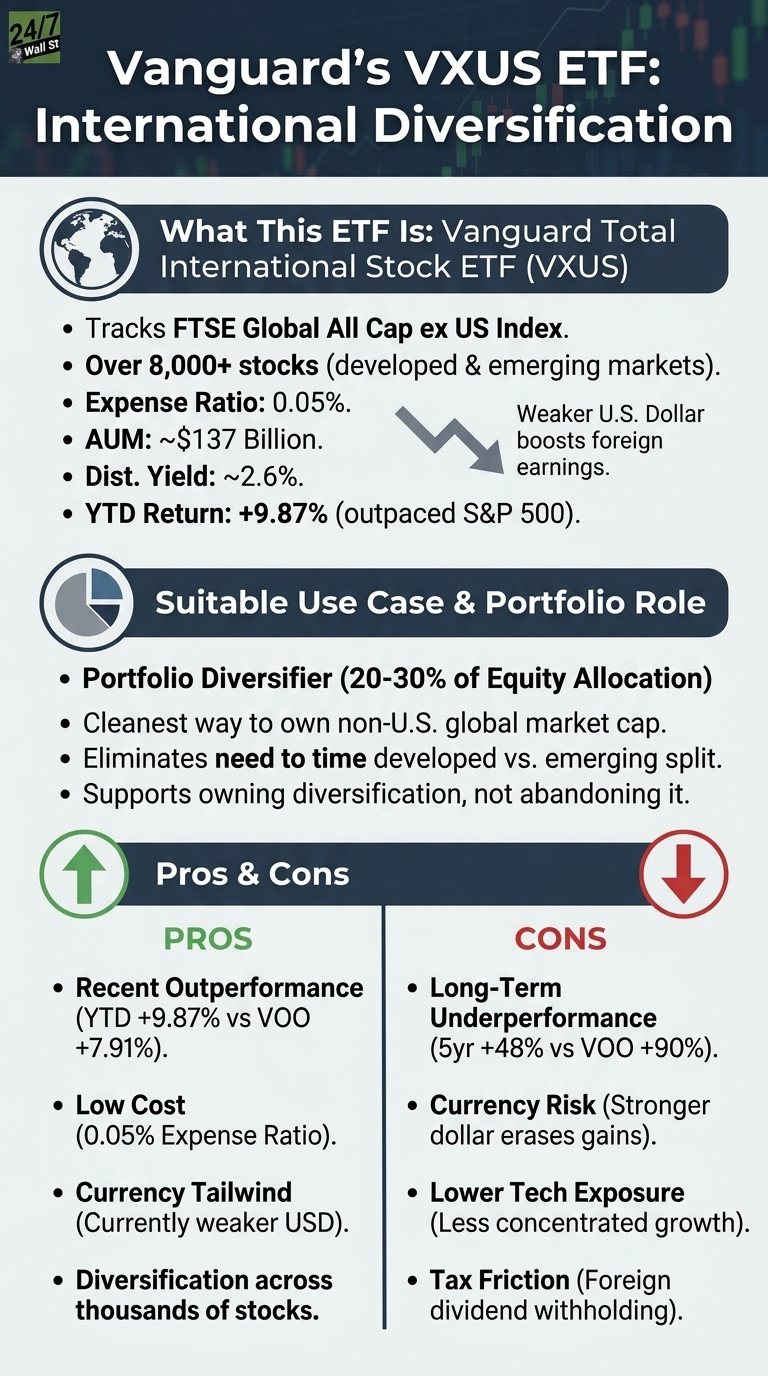
VXUS tracks the FTSE Global All Cap ex US Index, holding more than 8,000 stocks across developed and emerging markets outside the United States. It charges 0.05% in annual expenses, manages roughly $137 billion, and pays a distribution yield near 2.6%. The return engine is straightforward: dividends from foreign companies plus price appreciation, translated back into dollars. That currency translation is half the story right now.
The US dollar has strengthened against the euro, moving from a 12-month low of $1.198 per euro on January 27, 2026, to roughly $1.16 per euro in mid-May. A stronger domestic currency mechanically compresses the value of international earnings for US investors when translated back into corporate reporting, completely separate from how the underlying foreign businesses are executing. On the domestic side, the trade deficit narrowed to $60.3 billion in March 2026, after expanding to $72.9 billion in December, suggesting a similar economic environment.
Does the Fund Actually Deliver?
Year-to-date performance is encouraging, but a longer view tempers the story. Over five years, VXUS has returned about 51.3% against the S&P 500 proxy’s roughly 85.4%. Ten-year cumulative numbers widen the gap even further, with VXUS at roughly 145% versus a staggering 313.8% for VOO. An investor who held VXUS for a decade secured real returns, but ultimately walked away with less than half of what a plain S&P 500 index fund delivered. The fund delivered exactly what it promised: broad non-U.S. exposure. Even so, the opportunity cost of that international promise has been remarkably steep.
The Slice Underneath
VXUS bundles developed and emerging markets together. Vanguard sells those pieces separately: Vanguard FTSE Developed Markets ETF (NYSEARCA:VEA) is up nearly 11% YTD, while Vanguard FTSE Emerging Markets ETF (NYSEARCA:VWO) is up about 8%. Developed markets are doing the work in 2026, driven largely by Japanese corporate reform and a European industrial revival. Investors who want only that exposure can buy VEA at a similar expense ratio. VXUS makes sense for those who do not want to time the developed-versus-emerging split.
What You Trade Away
- Currency risk runs both ways. The dollar’s weakness, which has been boosting returns, now reverses when the Federal Reserve diverges hawkishly. A stronger dollar erases foreign gains before they reach a U.S. brokerage account.
- Lower long-term growth. International indexes lean toward financials, industrials, and materials. They lack the concentrated technology exposure that drove S&P 500 returns from 2016 through 2024.
- Tax friction. Foreign dividend withholding reduces the effective yield, with the loss partially recoverable as a tax credit in taxable accounts but not in IRAs.
Who Should Own It
For an investor with an all-U.S. equity sleeve, holding VXUS at 20% to 30% of the equity allocation brings the portfolio closer to global market-cap weights without requiring a tactical view on which region will win next. Recent short-term outperformance does not automatically vindicate years of trailing performance, and there is no factual basis here to predict that a structural rotation will continue. Even so, VXUS does its job at a lower price tag than most competitors, and the macro backdrop of a softer dollar alongside improving non-U.S. earnings supports owning the diversification rather than abandoning it. VOO remains the simpler vehicle for investors seeking traditional U.S.-style compounding from a single fund.
Contact [email protected] for any questions or corrections.