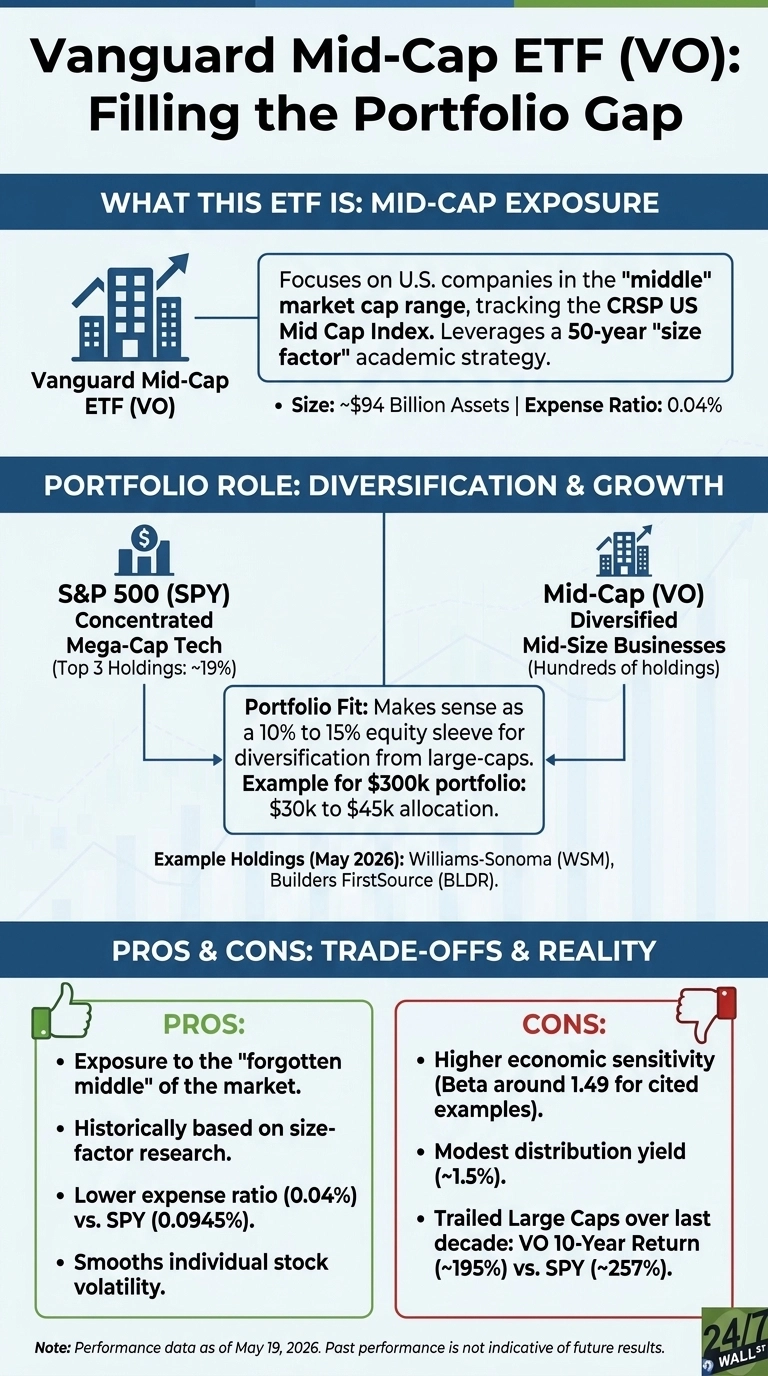
Most retirees who own an S&P 500 index fund hold a portfolio dominated by mega-cap technology, with mid-sized businesses getting almost no weight despite making up a meaningful share of corporate America. That gap is the reason the Vanguard Mid-Cap ETF (NYSEARCA:VO) exists, and with roughly $94 billion in assets and a 0.04% expense ratio, VO fills the forgotten middle of the market-cap spectrum by leveraging size-factor research that academics have been writing about for half a century.
The role VO is built to play
VO tracks the CRSP US Mid Cap Index, which holds U.S. companies with market values between $2 billion and $20 billion. Think names like Williams-Sonoma (NYSE:WSM | WSM Price Prediction), with a market cap near $20.22 billion, or Builders FirstSource (NYSE:BLDR) at $7.14 billion. These are mature, profitable businesses past the startup stage but still small enough to compound earnings faster than a $3 trillion megacap. The return engine is simple: own a few hundred of them, weight by market cap, and collect a distribution yield near 1.5% along the way.
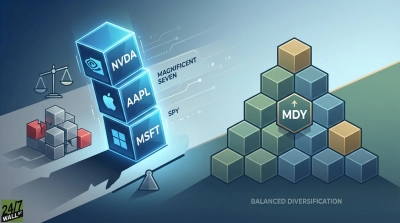
The strategy matters because the SPDR S&P 500 ETF (NYSEARCA:SPY) has become a concentrated bet. Its top three holdings, NVIDIA, Apple, and Microsoft, account for about 19% of the fund. An investor holding only SPY and a bond fund has effectively zero exposure to the size category that fifty years of factor research identified as a structural source of return.
Testing the promise against reality
Over the past decade, mid-caps have trailed large-caps. VO returned about 195% over the past decade, while SPY returned about 257%. The five-year picture is similar: VO gained about 43% against SPY’s about 77%. The trailing year tells the same story, with VO up about 13% versus SPY’s 23%.
The headline claim that mid-caps are quietly beating the index doesn’t hold in this window. The size premium is real over multi-decade academic samples, but the AI-driven mega-cap rally has been the dominant force in markets since 2016. Individual mid-caps illustrate the dispersion inside the category. Williams-Sonoma compounded about 768% over the same ten-year stretch, while Builders FirstSource gained about 470% before giving back roughly 44% in the past year on housing weakness. VO smooths that volatility by holding hundreds of names.
What you give up and what you get
Investors evaluating mid-cap allocations need to consider three distinct structural tradeoffs. The category carries a much higher level of systemic economic sensitivity than large-cap benchmarks. For instance, the five-year beta for both Williams-Sonoma and Builders FirstSource sits at 1.49, meaning these mid-cap companies generally amplify broad market moves in both directions. Allocating here also requires sacrificing the heavy concentration in artificial intelligence that has powered the standard S&P 500 index. Furthermore, the baseline dividend yield is modest, which frames VO primarily as a growth vehicle rather than an income producer.
At a fee of just 0.04%, VO remains significantly cheaper than SPY’s 9.45-basis-point expense ratio. Prominent active and passive competitors in the space include the iShares Core S&P Mid-Cap ETF and the SPDR S&P MidCap 400. Both alternative products track different underlying benchmarks and apply strict quality screens, which alter their overall performance profiles relative to Vanguard’s broader index replication.
Who this fits
Allocating 10% to 15% of an equity portfolio to VO serves as a highly effective sleeve for investors who hold an S&P 500 fund as their foundation and want explicit exposure to the missing middle market. This specific target corresponds to an allocation of $30,000 to $45,000 within a standard $300,000 equity portfolio. Anyone expecting mid-cap companies to lead the next decade purely because they outpaced large-caps in earlier cycles should temper their expectations, because performance data over the last ten years demonstrates the exact opposite trend. Ultimately, the case for adding VO to a portfolio rests firmly on structural diversification rather than on chasing past performance.
Contact [email protected] for any questions or corrections.