
The Global X NASDAQ 100 Covered Call ETF (NASDAQ:QYLD) advertises a trailing distribution yield around 12%, which is roughly ten times what the broad market pays. That headline is what drew income-focused investors into QYLD when it launched in 2013, and it is still what keeps roughly $8.13 billion in assets parked there today. The harder question, and the one this article tests, is what a QYLD shareholder has actually earned compared with simply owning the underlying index.
What QYLD is built to do
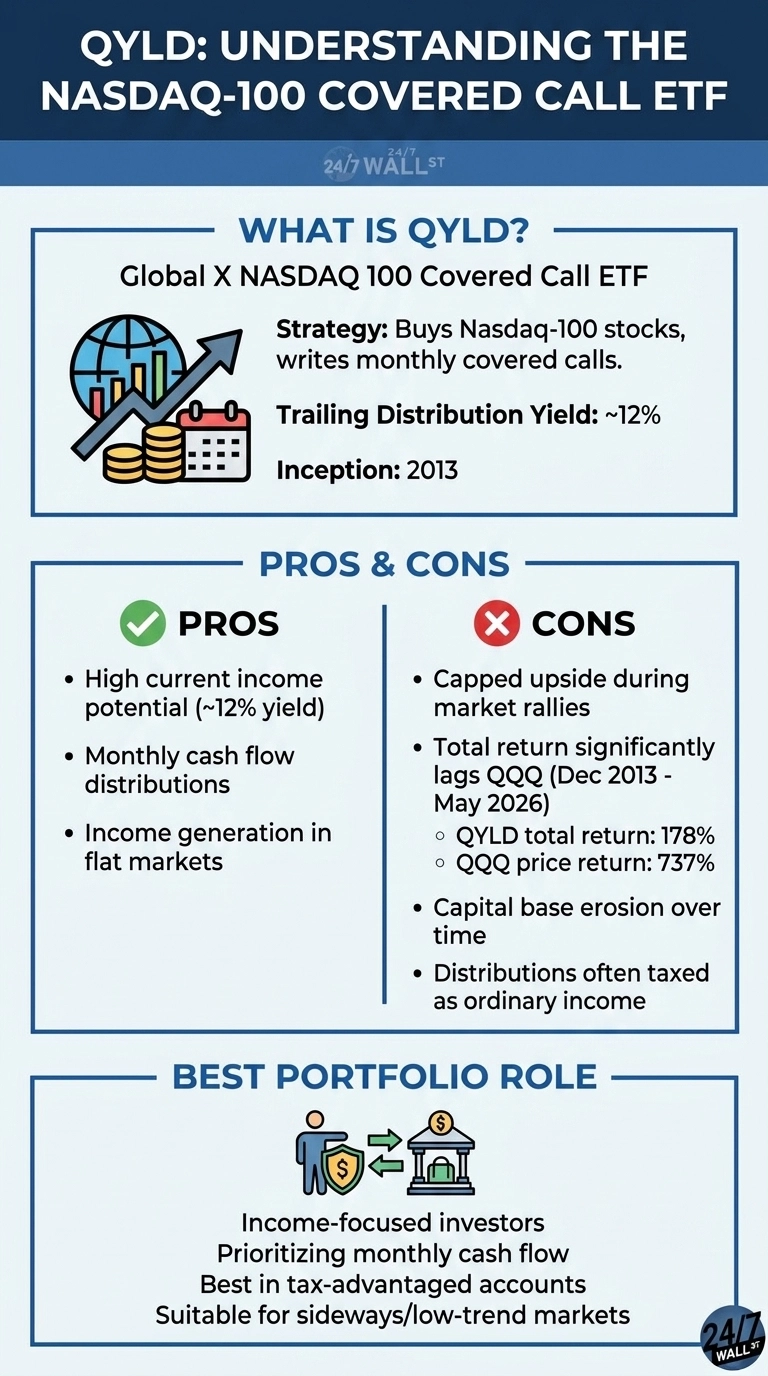
QYLD mirrors the Nasdaq-100 and systematically sells at-the-money call options against its underlying equity basket each month, capturing premium income and routing the vast majority of it to shareholders via monthly checks. The entire architecture operates as a rigid, rules-based strategy, which anchors its core investor appeal by turning baseline equity volatility into scheduled cash flow. The vehicle levies a 0.60% annual expense ratio, manages 102 individual tech-heavy equities, and has distributed $2.1320 per share over the trailing 12-month period.
The massive structural drawback of writing rigid at-the-money options is that any monthly market appreciation above the strike price is surrendered entirely to the option buyer rather than to the fund. Throughout flat, range-bound, or slightly negative trading environments, that incoming premium cushion compounds beautifully. Conversely, during a roaring tech bull market powered by a few mega-cap growth giants, this hard ceiling on capital upside binds tightly almost every single month.
The reveal: a decade of capped upside
QYLD trades around $18 today, down meaningfully from its $25 launch price. Meanwhile, the Invesco QQQ Trust (NASDAQ:QQQ) has returned 737% on price alone since QYLD’s December 2013 inception, while QYLD’s total return, with distributions reinvested, stands at 178%.
The hypothetical retiree case sharpens the point. A $10,000 investment at QYLD’s launch produced roughly $14,000 in cumulative cash distributions, but the share count is now worth about $6,500. The combined total is near $20,500, against $30,000 or more from QQQ, even with periodic withdrawals. The cash flow felt steady while the capital base eroded.
The mega-caps in the index account for most of the gap. Apple and NVIDIA, two of the largest Nasdaq-100 weights, have posted multi-bagger gains since QYLD’s launch, and every monthly call written against those positions handed the gains above strike to someone else.
Three real tradeoffs
- Capped upside is a structural feature of the strategy. At-the-money calls give up everything above the strike each month, which is why QYLD lags whenever the index trends. QYLD has returned 44% over five years compared to QQQ’s 100% on the trailing window most income investors care about.
- Distributions drift lower over time. Monthly payouts have declined from a 2021 range of $0.188 to $0.233 to a 2026 range of $0.172 to $0.179 as volatility has compressed. The yield label stays fixed while the dollar payouts shrink.
- Tax treatment weighs on taxable accounts. Distributions are largely ordinary income or return of capital, which is why most analyses frame QYLD as best suited for tax-advantaged retirement accounts.
Where the alternatives sit
Two adjacent products address the same income need with different mechanics. The Global X Nasdaq 100 Covered Call & Growth ETF (QYLG) writes calls on half of its portfolio, returning 113% since September 2020 while leaving more upside intact. The JPMorgan Nasdaq Equity Premium Income ETF (NASDAQ:JEPQ) uses an actively managed equity-linked note structure at a 0.35% fee and has returned 83% since its May 2022 inception, with a similar income profile.
Who QYLD fits
QYLD is perfectly suited to an isolated investor who has explicitly determined that immediate monthly cash flow overrides comprehensive total return, anticipates a flat or directionless trading environment, and strictly shelters the asset in a tax-advantaged account. For anyone actively accumulating wealth, or any retiree whose financial survival depends on the underlying capital base expanding alongside automated distributions, a decade of performance data strongly advocates for pure QQQ exposure with programmatic share sales, QYLG, or JEPQ as vastly superior vehicles to extract yield from the Nasdaq-100 footprint.
Contact [email protected] for any questions or corrections.