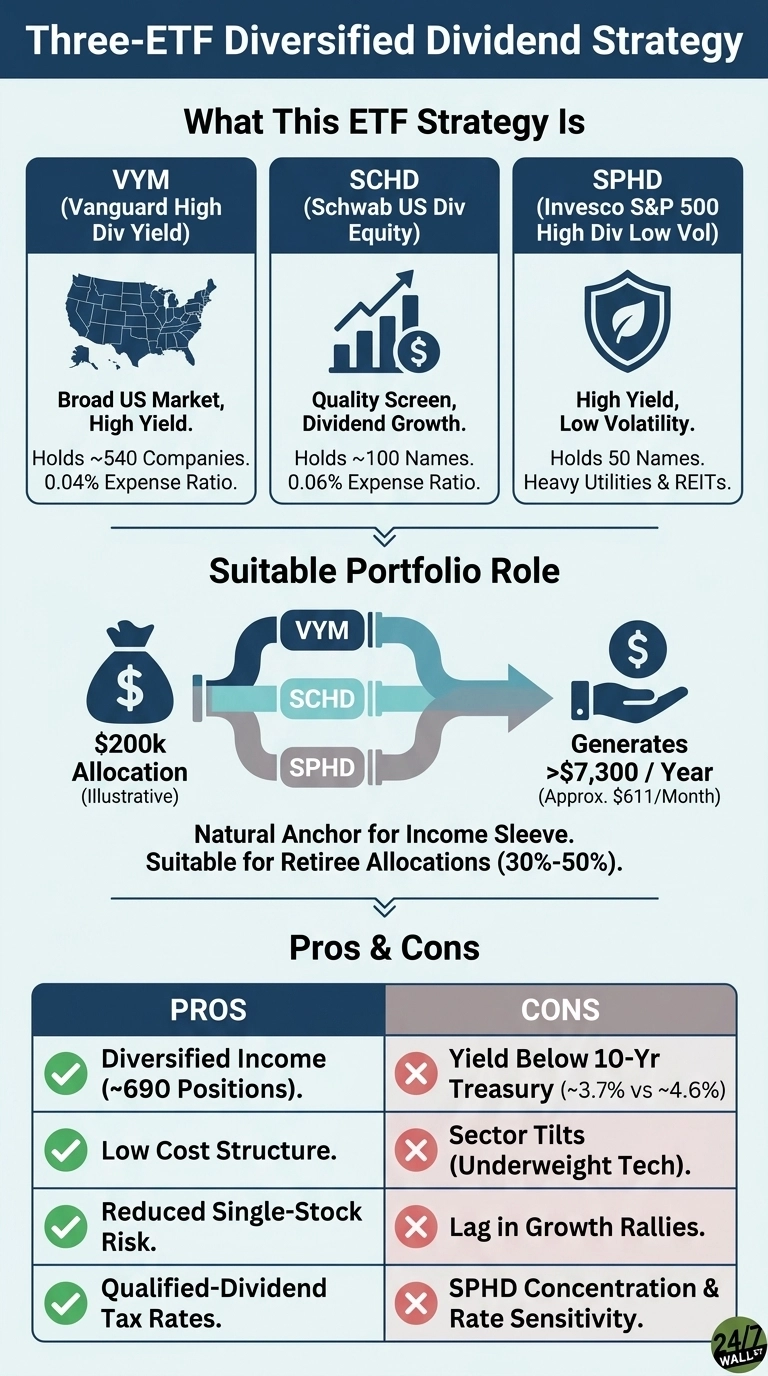
The Vanguard High Dividend Yield ETF (NYSEARCA:VYM | VYM Price Prediction) addresses a specific retirement problem: drawing income from stocks without concentrating the outcome in any one company. VYM holds roughly 540 dividend-paying companies, which makes it a natural anchor for a multi-fund income sleeve. Paired with two complementary dividend ETFs, a $200,000 allocation across VYM and its peers produces roughly $7,300 in annual cash flow spread across about 690 underlying positions.
Splitting $200,000 evenly across VYM at a 2.9% yield, Schwab U.S. Dividend Equity ETF (NYSEARCA:SCHD) at 3.4%, and Invesco S&P 500 High Dividend Low Volatility ETF (NYSEARCA:SPHD) at 4.7% generates roughly $1,933, $2,267, and $3,133 in yearly distributions, which works out to about $611 a month.
What each fund actually does
VYM screens the domestic equity universe for above-average dividend yields and weights allocations by market capitalization, anchoring deep diversification across financial services, healthcare, and stable consumer names. Its current expense ratio is 0.06%, ranking among the absolute cheapest vehicles in the equity income sector. Total per-share distributions reached $3.6651 in 2025, compared to $3.4945 in 2024, demonstrating a highly stable and reliable cash flow stream rather than an aggressively spiking one.
SCHD relies on a different methodology, as it deploys a multi-factor quality filter that measures cash flow-to-debt, return on equity, baseline dividend yield, and annualized five-year cash flow growth before establishing its 100-stock index portfolio. Signature weights feature Bristol Myers Squibb at roughly 3.21%, Merck at 4.13%, and ConocoPhillips hovering near 3.44%. The fund charges a 0.06% fee, while total strategy net assets currently aggregate near $79.8 billion.
SPHD extracts the broader S&P 500, ranks constituents by yield, and isolates the 50 qualifying firms exhibiting the lowest trailing realized volatility. That custom framework manufactures the highest upfront headline yield among these three choices and leans heavily into utilities, real estate investment trusts, and consumer staples. It represents the smallest and most heavily concentrated vehicle within this income basket.
Does the three-fund mix deliver?
VYM has delivered a 29.5% total return over the past year and 75.6% over five years, with shares trading near $157. SCHD simultaneously produced a 26.0% return over the trailing twelve months and a 50.1% return over the same five-year window. The combined basket yield of roughly 3.0% sits noticeably below the 4.61% risk-free rate available on a standard 10-year Treasury. A retiree selecting this equity allocation consciously sacrifices immediate nominal yield in exchange for corporate growth and systematic dividend expansion.
The three funds emphasize different factors (yield, quality, low volatility), so overlap is smaller than the shared category label suggests. Across the 540, 100, and 50 holdings, the combined book covers about 690 unique positions, with the largest single-stock weight in the blended portfolio sitting well below the 4% any one name reaches inside SCHD or SPHD alone.
The tradeoffs
- Yield below cash. A blended 3.7% does not clear the current 4.6% Treasury yield, so part of the case rests on dividend growth and capital appreciation, not income alone.
- Persistent sector tilts. All three funds are underweight technology and overweight financials, healthcare, energy, and staples, which has weighed on the basket’s performance relative to the broad market during AI-led rallies.
- SPHD concentration. With only 50 holdings and heavy exposure to utilities and REITs, SPHD is the most rate-sensitive piece of the mix and the most likely to lag in growth-led markets.
Who this fits
A retiree using this three-fund combination as a 30%-50% income sleeve, paired with a broad-market fund like VTI or VOO for growth, ends up with diversified equity income taxed primarily at qualified dividend rates. Investors expecting capital appreciation that keeps pace with the S&P 500 will see this basket lag in growth-led markets. An equal-weight rebalance once a year keeps any one factor from quietly taking over the income engine.