
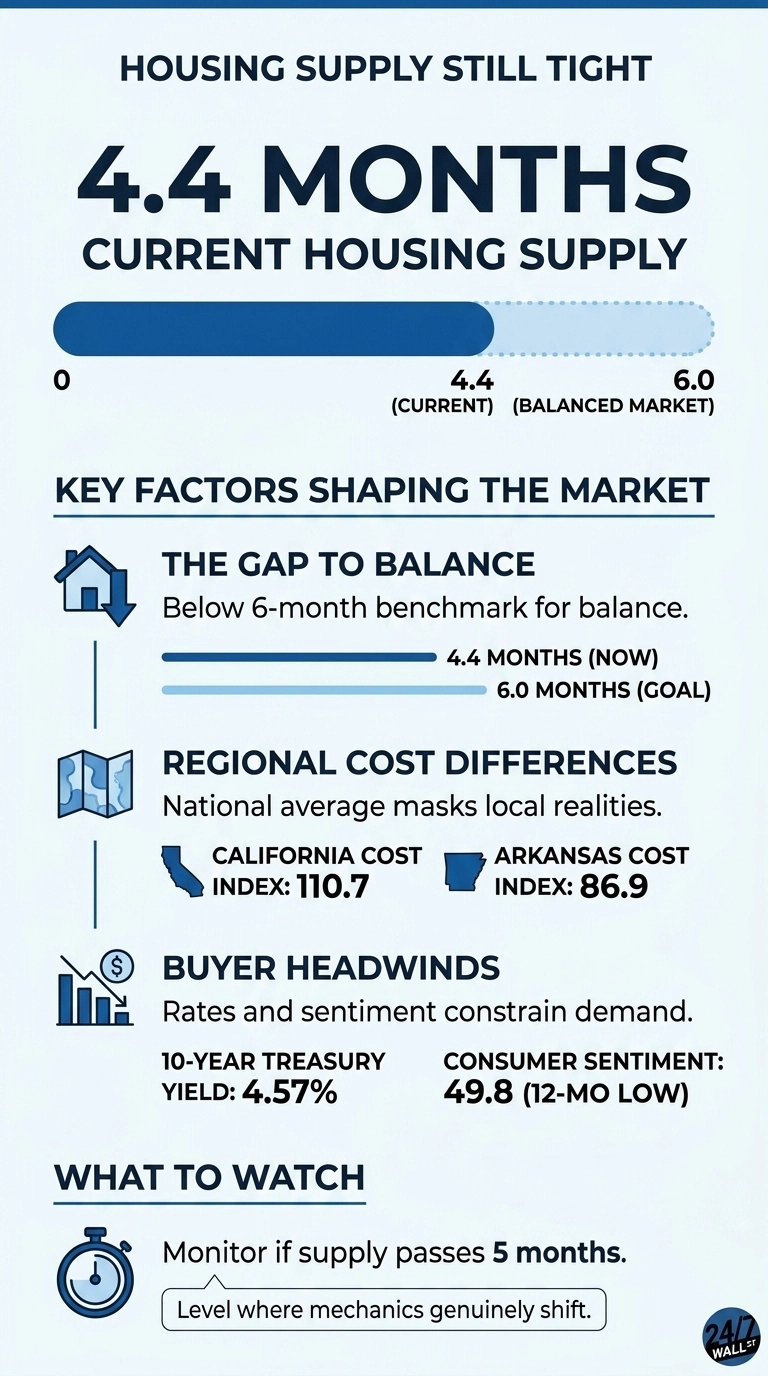
Housing inventory finally moved in the direction buyers wanted in April. The National Association of REALTORS reported that unsold inventory climbed 5.8% from March to 1.47 million units, the largest month-over-month build of the year. The reality is more incremental than that framing suggests. At the current sales pace, those listings translate to 4.4 months of supply, up from 4.2 months in March and 4.3 months a year earlier. A balanced market, the threshold where neither buyers nor sellers hold structural leverage, sits at six months. The country is still well short of that line.
The Supply Illusion and National Scarcity
Months of supply is a simple ratio: how long it would take to sell every listed home if no new listings hit the market and the current sales pace held. Below six months, sellers retain pricing power. Below four, bidding wars become the default. April moved the dial from “tight” toward “snug,” but the underlying scarcity has not broken. NAR Chief Economist Lawrence Yun acknowledged the dynamic directly, noting that “multiple offers, though not as intense as a few years ago, are still occurring” while days on market lengthen as buyers grow more deliberate.
Regional Realities and Pricing Asymmetry
The national figure also masks how unevenly the 4.4 months are distributed. Existing-home sales ran at a seasonally adjusted annual rate of 4.02 million in April, with the South posting a 0.5% monthly gain and the West falling 2.6%. Median prices tell the regional story more bluntly: $619,600 in the West, $510,800 in the Northeast, $366,600 in the South, and $324,500 in the Midwest. A 5.8% inventory bump in a metro where the median home costs over $600,000 does not produce the same buyer relief as the same percentage gain in a $325,000 Midwest market.
Cost of Living and Constrained Corridors
Cost-of-living data from the Bureau of Economic Analysis reinforces why supply gains land differently by region. California’s cost-of-living index sits at 110.7, Hawaii at 110.0, and New York at 107.9, the regions where inventory has been most chronically constrained. Affordable-state buyers in Arkansas (86.9), Iowa (87.8), and Oklahoma (87.8) face lower competitive pressure even with the same national supply level. The headline 4.4 months is an average that papers over markets where the figure is closer to two and others where it is closer to seven.
The Financial Headwinds Restricting Activity
The financing backdrop explains why the inventory improvement is not loosening the market faster. The 10-year Treasury yield closed at 4.57% on May 20, up 31 basis points from a month earlier. Mortgage rates track that benchmark closely, so the financing math got worse for buyers even as more homes hit the market. The Consumer Price Index rose 0.5% in April to 332.4, keeping inflation pressure on monthly budgets, and the personal savings rate slipped to 4.0% in the first quarter from 5.2% a year earlier. Lower savings translate directly to weaker down payment capacity.
Shifting Sentiment and Longer Market Stays
The University of Michigan Consumer Sentiment Index fell to 49.8 in April, a 12-month low and a reading that sits in territory historically associated with recessions. Buyers staring at improved inventory but elevated mortgage rates, sticky inflation, and softer confidence are choosing to wait. That is consistent with NAR’s observation that median time on market stretched to 32 days in April, up from 29 days a year earlier. Homes are sitting on the market longer, which is exactly what should happen when supply rises faster than demand.
Summer Outlook: Meaningful Progress Without Relief
For buyers, the practical read is that 4.4 months is meaningful progress that stops short of relief. Listings are growing, sellers are negotiating more, and price appreciation has slowed to 0.9% year-over-year, the 34th consecutive month of gains, but the smallest in years. For sellers, the leverage is narrower but not gone. The number to watch over the summer is whether supply pushes through five months, the level where the market mechanics genuinely shift. Until then, the inventory headline is real, and the 6-month finish line is still over the horizon.
Contact [email protected] for any questions or corrections.