The Math That Should Terrify Index Investors: AI Chips Account for Nearly All S&P 500 Gains
Here is the data point that should make every passive index investor pause. On Retire SMART Podcast Ep 416, the host laid out the math: “If we removed the Nvidias, the AMDs, so AI chips, these are the chipmaking companies,…

Here is the data point that should make every passive index investor pause. On Retire SMART Podcast Ep 416, the host laid out the math: “If we removed the Nvidias, the AMDs, so AI chips, these are the chipmaking companies, the storage companies, and the companies that are facilitating AI that are publicly traded. And if we remove them from the S&P, the ones that are in that category, we had a 42% return on the S&P over the last 22 months. It goes down to about 16%.”
A 26-point gap. The actual SPDR S&P 500 ETF Trust (NYSEARCA:SPY) has returned 41% over the two years ending May 22, 2026, validating the host’s framing. Strip out AI infrastructure exposure and the index is a market that barely outpaced cash.
How Passive Became a Concentrated AI Bet
SPY’s top holdings reveal the mechanism. NVIDIA is 8% of the index, Microsoft 5%, and Broadcom 3%. In the Invesco QQQ Trust, the concentration is more extreme: NVIDIA alone is 10%, Microsoft 9%, and Broadcom 6%. Market-cap weighting compounded the gains and now compounds the risk.
The two-year price record for these names shows where the index returns actually came from:
| Stock | 2-Year Return | Trailing P/E |
|---|---|---|
| NVIDIA (NASDAQ:NVDA | NVDA Price Prediction) | 102% | 33 |
| AMD (NASDAQ:AMD) | 181% | 156 |
| Broadcom (NASDAQ:AVGO) | 200% | 81 |
| Microsoft (NASDAQ:MSFT) | -1% | 25 |
| Palantir (NASDAQ:PLTR) | 552% | 154 |
The NVIDIA Anchor
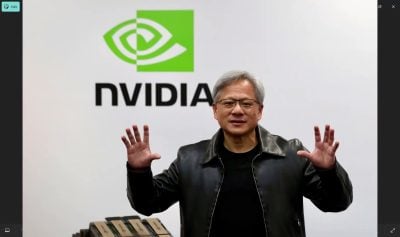
NVIDIA sits at the center of the concentration story with a $5.22 trillion market capitalization. The fundamentals are extraordinary: Q1 FY2027 revenue of $81.6 billion, up 85% year over year, with Data Center networking growing 199%. CEO Jensen Huang told investors in the earnings release that “The buildout of AI factories, the largest infrastructure expansion in human history, is accelerating at extraordinary speed.”
The risk profile is equally pointed. NVIDIA disclosed $119 billion in total supply commitments and Q2 FY2027 guidance now excludes all Data Center compute revenue from China. Reddit sentiment turned bearish on May 23-24, with scores between 30 and 41 despite the earnings beat, capturing the dynamic where strong results have stopped reliably moving the stock higher.

The Valuation Stretch Across the Cohort
AMD trades at a forward P/E of 67 on $762 billion in market cap, with Lisa Su pointing to a Meta partnership for up to 6 GW of Instinct GPUs. Broadcom carries a $1.96 trillion market cap, with CEO Hock Tan targeting $100 billion in AI revenue by 2027. Microsoft is the relative bargain at 25 times trailing earnings, with an AI run rate that crossed $37 billion, up 123% year over year. Palantir is the outlier on multiple at a 154 trailing P/E and 63 times sales, even with a Rule of 40 score of 127%.
The Macro Setup Argues for Risk Review
Three macro signals tighten the retirement angle. The 10-year Treasury yield sits at 5%, near a 12-month high in the 98th percentile, offering risk-free competition for equity allocations. The VIX at 16.76 is below the 12-month average of 18.2, indicating complacency. And University of Michigan consumer sentiment dropped to 49.8 in April 2026, a recessionary reading and a 12-month low.
The host’s directive is the actionable part: “Make sure you understand how much risk your portfolio has because we’ve had great returns at all-time highs, you may be taking more risk now than you’re comfortable taking.” For investors approaching retirement, the operative question is what percentage of an S&P 500 fund, a target-date fund, or a 401(k) default sits in a handful of AI-linked megacaps. If returns over the last two years felt easy, the concentration that produced them is now the position to size deliberately.
Contact [email protected] for any questions or corrections.
Joel South covers large-cap stocks, dividend investing, and major market trends, with a focus on earnings analysis, valuation, and turning complex data into actionable insights for investors.
He brings more than 15 years of experience as an investor and financial journalist, including 12 years at The Motley Fool, where he served as an investment analyst, Bureau Chief, and later led the Fool.com investing news desk. He has also co-hosted an investing podcast and appeared across TV and radio discussing market trends.