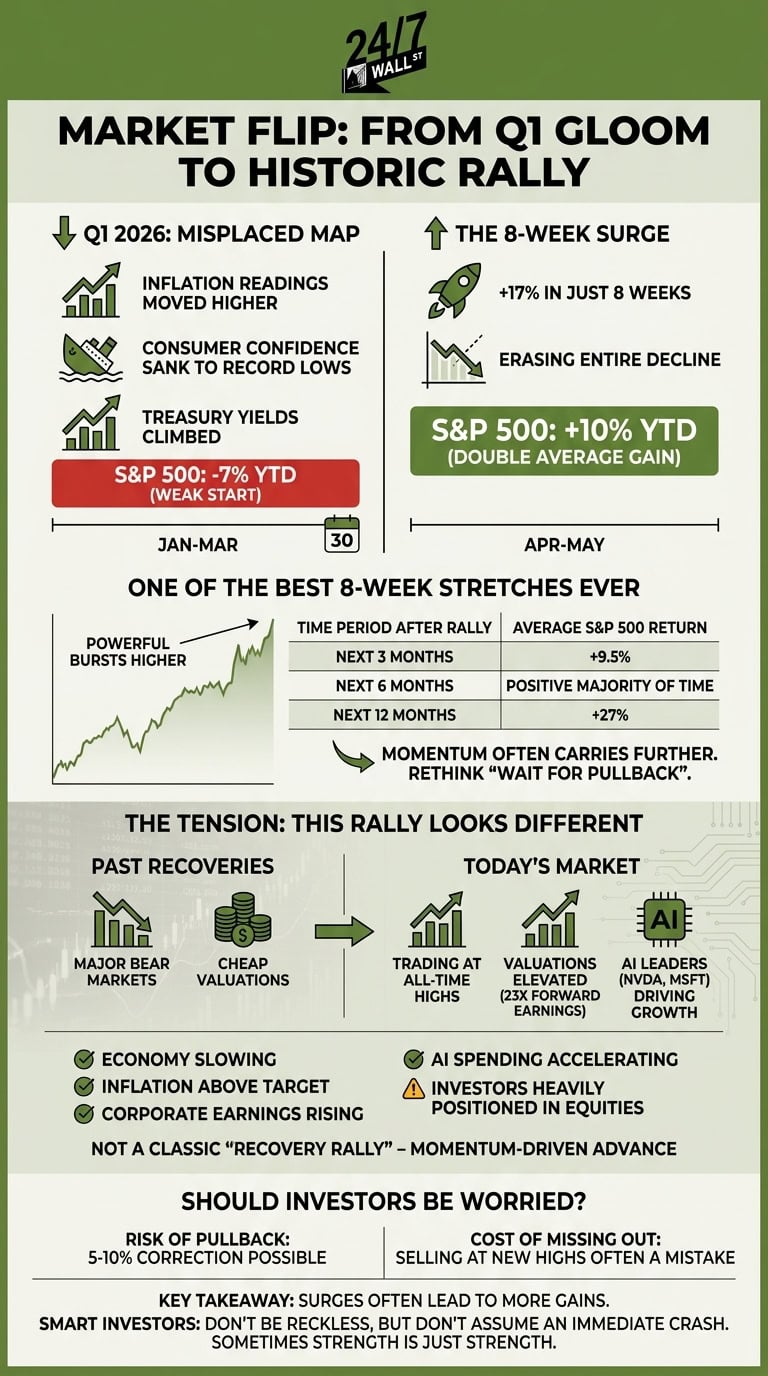
Wall Street spent the first quarter of 2026 looking like it had misplaced the map. Inflation readings from the Bureau of Labor Statistics moved higher, consumer confidence sank to record lows, and Treasury yields climbed as investors questioned whether the Federal Reserve would cut rates at all this year. By March 30, the S&P 500 had fallen 7% year to date — one of the weakest starts to a calendar year in decades.
Then everything flipped. In just eight weeks, the benchmark index surged 17%, erasing the entire decline and pushing the market to a 10% gain for the year. That is more than double the S&P 500’s average gain of roughly 4.5% by this point in a typical year. And despite the holiday-shortened trading week, stocks are still pushing higher.
So the big question investors are asking now is simple: Is this as good as it gets?
One of the Best 8-Week Stretches Ever
The rally has been broad enough to surprise even seasoned investors. Mega-cap technology stocks continued leading higher, but industrials, financials, and small-cap names joined the advance as recession fears faded.
According to data shared by Creative Planning’s Charlie Bilello, the S&P 500 just recorded one of its strongest rolling eight-week rallies in history. Surprisingly, the historical data suggests these powerful bursts higher do not usually mark the end of a bull market. They often mark the middle.
Here’s what the numbers show happened after previous top-tier 8-week rallies:
| Time Period After Rally |
Average S&P 500 Return |
| Next 3 Months | +9.5% |
| Next 6 Months | Positive Majority of Time |
| Next 12 Months | +27% |
That is the kind of data that can make investors rethink the instinct to “wait for a pullback.”
Granted, past performance is no guarantee of future results. Markets do not move on autopilot. But when all is said and done, momentum this strong has historically carried further than most investors expect.
This Rally Looks Different From Past Recoveries
That said, there is an important caveat investors should not ignore.
Many of the historical rallies in Creative Planning’s data came after major bear markets or periods when valuations had collapsed, such as 2009 after the financial crisis or 2020 following the pandemic crash. Stocks were cheap, fear was widespread, and investors were sitting on the sidelines.
That is not the setup today. The S&P 500 is trading at all-time highs, and valuations already reflect a lot of optimism. Based on FactSet data, the index trades around 23 times forward earnings, well above the 10-year average closer to 18. Nvidia (NASDAQ:NVDA | NVDA Price Prediction), Microsoft (NASDAQ:MSFT), and other AI leaders continue driving earnings growth, but investors are paying premium prices for that growth.
Here’s the tension in today’s market:
- The economy is slowing in several areas
- Inflation remains above the Federal Reserve’s target
- Corporate earnings estimates are still rising
- AI spending continues accelerating
- Investors remain heavily positioned in equities
In other words, this is not a classic “recovery rally.” It is a momentum-driven advance happening while valuations are already elevated.
Regardless, markets rarely care whether a rally feels comfortable. They care about liquidity, earnings, and investor positioning. Right now, all three continue supporting higher stock prices.
Should Investors Be Worried About Chasing Stocks Here?
Could the market pull back after such a steep climb? Of course. A 5% to 10% correction would not be unusual after a 17% sprint in less than two months.
But history shows that selling simply because markets reached new highs has often been a costly mistake. According to data from Hartford Funds and Ned Davis Research, most market gains occur during relatively short bursts of momentum — and missing just a handful of the market’s best days can sharply reduce long-term returns.
In any case, investors waiting for the “perfect” entry point may keep finding themselves watching stocks move higher without them.
Key Takeaway
In short, the S&P 500 just completed one of the strongest 8-week rallies on record — and history suggests those surges often lead to more gains, not immediate crashes. The average follow-through of 9.5% over the next three months and 27% over the next year is difficult for investors to ignore.
Still, this rally carries more risk than many of its historical counterparts because valuations are already elevated and stocks sit near record highs. Smart investors do not need to become reckless here, but they also should not assume a powerful rally automatically means the market is about to roll over.
Sometimes strength really is just strength.
Contact [email protected] for any questions or corrections.