The iShares 20+ Year Treasury Bond ETF (NASDAQ:TLT | TLT Price Prediction) has done something this year that surprises a lot of holders. Despite the Federal Reserve cutting rates 75 basis points over the past 12 months to a 3.75% upper bound, TLT is down about 1% year to date and trades near $85. The long end of the curve refuses to cooperate, and that disconnect is the entire TLT story for the next 12 months.
TLT exists to solve one problem: give investors concentrated exposure to the longest-dated U.S. Treasuries the government issues. The fund holds a ladder of 20+ year Treasury bonds, with the top 10 positions making up 44% of net assets and individual weights between 4% and 5%. At 15 basis points, the expense ratio is a non-issue. Everything that happens to this fund is going to be driven by what happens to one number: the 30-year Treasury yield.
The macro factor that matters: the 30-year yield
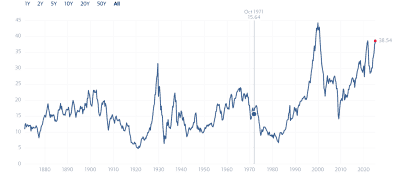
Forget the federal funds rate. The Fed has been parked at 3.75% for roughly five and a half months, and TLT has gone nowhere. The variable that actually moves TLT is the long end. The 30-year Treasury closed May at 5.03% after touching 5.18% on May 19, a 24 basis point swing inside a single month. The 10-year sits at 4.56%, in the 97.6th percentile of its 12-month range.
Long rates are sticky for a reason. Core PCE inflation just printed its highest reading of the past year in March, the 90.9th percentile of its 12-month range, and CPI hit a fresh 12-month high in April at 332.4. Bond investors at the long end are pricing in the possibility that the Fed has cut too soon. Until that question resolves, TLT is fighting gravity.
Keep an eye on the 30-year yield against the 5.00% line. A sustained break below 4.90% would mark the first real signal that disinflation is winning and long-duration Treasuries can rally. A push back through 5.20% would tell you the opposite. The Treasury’s daily yield curve and the BLS PCE release (last Friday of each month) are the two things to bookmark. Check weekly. The last time the 30-year ran above 5% for an extended stretch in 2023, TLT spent the next several months grinding lower.
The fund-specific factor: pure duration, no cushion
TLT owns 20+ year U.S. Treasuries and nothing else: no credit risk, no equity sleeve, no covered-call income strategy, no foreign exchange exposure. It owns 20+ year Treasuries and nothing else. The portfolio’s effective duration sits in the 16 to 17 year neighborhood, which means a 50 basis point move in long rates translates into roughly an 8% move in NAV in the opposite direction. There is no offset.
That is why TLT has lost 28% over five years even as it gained 5% in the past 12 months. Holders need to monitor one thing: the spread between long Treasury yields and inflation expectations. Currently the 10Y-2Y spread is 0.49%, near its 12-month low, and the curve has been flattening since February. A flattening curve with elevated long rates is the worst combination for TLT, because it suggests the market does not yet trust that inflation is contained.
Investors with a different macro view have options. The iShares 1-3 Year Treasury Bond ETF (NASDAQ:SHY) captures front-end yields with a fraction of the duration risk, useful for anyone who wants Treasury exposure without betting on the long end.
What needs to happen for TLT to rally
Watch the 30-year yield and the monthly core PCE release. A sustained 30-year print below 4.90% paired with a core PCE month-over-month reading at or below 0.2% is the combination that puts a real bid under TLT. Until both arrive, the fund’s 100% allocation to 20+ year Treasuries is a pure bet that long rates fall, and the market is still telling you that bet hasn’t paid yet.