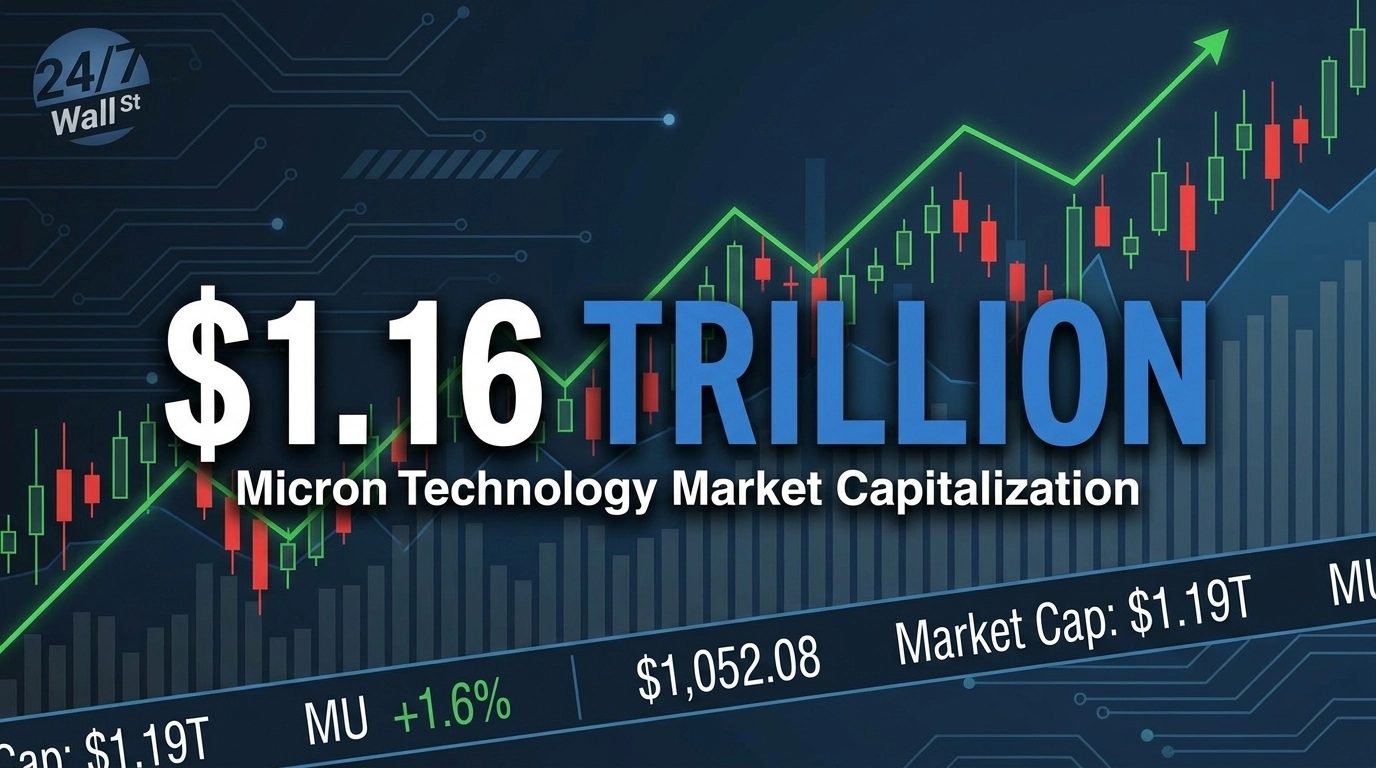
The Number
Micron Technology (NASDAQ:MU | MU Price Prediction) crossed a $1.16 trillion market capitalization and now sits at $1,189,601,487,240 — roughly $1.19 trillion — as of 10:21 AM ET on June 2, 2026. The figure is a live market valuation derived from the closing price of $1,035.50 on June 1, 2026 applied to roughly 1.13 billion shares outstanding. The milestone places Micron within striking distance of Meta Platforms (NASDAQ:META), whose market cap stands at $1,323,941,232,250, a gap of about $134 billion.
What It Means
Micron has rocketed 262.98% year to date in 2026, with shares moving from $285.28 on December 31, 2025 to $1,035.50. Over 12 months the stock is up 998.9%, repricing a company that traded near a $88 billion market cap roughly thirteen months ago. The driver is operational rather than speculative: fiscal Q1 2026 revenue hit $13.64 billion, up 56.6% year over year, with non-GAAP EPS of $4.78 and GAAP gross margin expanding to 56.0% from 38.4%. The Cloud Memory Business Unit alone produced $5.28 billion at 66% gross margins, reflecting how AI-driven high-bandwidth memory demand has compressed industry supply and lifted pricing.
Market Reaction
The repricing has been continuous rather than event-driven. Shares are up 37.88% over one week (May 22 to June 1, 2026) and 90.98% over one month (May 1 to June 1, 2026). Intraday on June 2, MU added another 1.6% to reach $1,052.08. Meta, by contrast, is down 8.96% year to date and 6.98% over the trailing year.

Strategic Outlook
Micron has guided fiscal Q2 2026 revenue to $18.70 billion plus or minus $400 million, non-GAAP EPS to $8.42 plus or minus $0.20, and non-GAAP gross margin to 68.0% plus or minus 1.0%. CEO Sanjay Mehrotra described the outlook as carrying “substantial records across revenue, gross margin, EPS and free cash flow” with order books reportedly extending into 2027. To eclipse Meta from here, Micron needs to gain only about 11.3%. At the trailing one-month pace of 90.98%, that gap closes in under a week. At a 10% monthly rate, it takes roughly 1.1 months, while at 5% monthly, about 2.2 months. Sustaining any of those rates is the open question. Reddit sentiment on r/wallstreetbets has run very bullish, with scores between 88 and 94, while the analyst consensus target sits at $702.98, well below the current quote.
Bottom Line
Micron’s near-$1.19 trillion-plus valuation is grounded in $13.64 billion in quarterly revenue and Q2 guidance pointing to $18.70 billion, with fiscal Q3 results due June 24, 2026. The forward PE of 11x suggests the market is pricing in continued AI-memory tightness, but the next earnings report is the catalyst that will test whether MU can keep narrowing the gap to Meta or stall well short of it.
Contact [email protected] for any questions or corrections.