Investors hold JPMorgan Equity Premium Income ETF (NYSEARCA:JEPI) and NEOS S&P 500 High Income ETF (CBOE:SPYI) for one reason: the fat monthly check. Both funds harvest option premium on top of S&P 500 exposure, and both have paid every month without fail. The question is whether those distributions are durable and whether the price, measured against simply owning SPDR S&P 500 ETF Trust (NYSEARCA:SPY), is worth paying. The short answer: JEPI and SPYI distributions are structurally safe, but the total-return math is not flattering.
How each fund generates income
JEPI runs an actively managed low-volatility slice of the S&P 500 and layers on equity-linked notes that economically replicate selling out-of-the-money S&P 500 calls. The portfolio is concentrated in mega-cap names, with NVIDIA at 7.9%, Apple and Alphabet each at 6.4%, and Microsoft at 5.0% of net assets. Monthly distributions depend on two engines: dividends from underlying holdings and option premium collected via the ELNs, which fluctuates with implied volatility.
SPYI holds the equities directly and writes SPX index options against them. SPX options qualify for Section 1256 60/40 tax treatment, and a meaningful portion of SPYI’s distribution is typically classified as return of capital, which defers taxes rather than eliminating them. The fund manages roughly $6.9 billion in net assets and charges 0.68% annually. JEPI costs 0.35%, and SPY remains the cost leader at 0.0945%.
JEPI: premium income is real, but variable
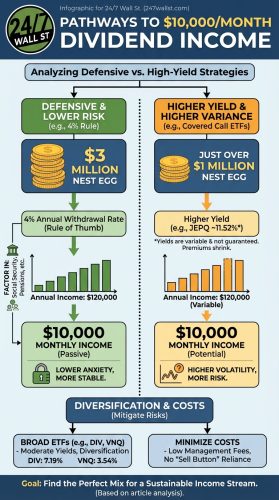
JEPI’s monthly payment swings with volatility. The June 2026 distribution was $0.39 per share, down from $0.54 in June 2025. That is the strategy working as designed. When the VIX compresses, call premiums shrink, and JEPI passes the lower income through to holders. The fund has never missed a monthly payment since 2020, and with shares around $56 and trailing payouts in the high-$4 range, the trailing yield sits in the 8% zone.
The safety case is straightforward. JEPI cannot pay more than it earns from dividends plus net option premium, and the ELN structure forces realized cash before any distribution. There is no debt, no leverage, and no obligation to maintain a fixed payout. Distributions will shrink in low-vol regimes and expand in turbulent ones, but they will not vanish.
SPYI: steady payouts, with a return-of-capital cushion
SPYI’s distribution profile is the opposite of JEPI’s: nearly flat. The June 2026 payment was $0.531, and 2026 monthly distributions have ranged from $0.51 to $0.54. Full-year averages have crept up every year since inception, from $0.48 in 2023 to $0.52 in 2025.
That smoothness is partly engineered. SPYI uses return-of-capital classification to normalize payouts even when option premium fluctuates. NAV has held up well while distributions have been paid. SPYI’s price climbed from $31 at inception in August 2022 to $53, and total return over the past year was 21% before counting distributions paid in cash.
The total-return reality check
Over the past year, SPY returned 24% in price alone, with quarterly dividends on top. JEPI delivered 9% in price appreciation, and SPYI managed 21%. Over five years, SPY rose 79% against JEPI’s 45%. SPY’s quarterly dividend has grown steadily, with $1.99 paid in Q4 2025, the highest in its history.
The covered-call funds cap upside in exchange for current cash. In a bull market, that trade looks expensive. In a flat or choppy market, it looks brilliant.
The verdict
Both JEPI and SPYI have safe distributions in the only sense that matters: the funds are paying out what they earn, not borrowing or eroding NAV to keep checks flowing. JEPI’s payment will move with volatility, so retirees needing a fixed monthly number should expect variance. SPYI delivers smoother cash but at a higher expense ratio and with return-of-capital mechanics that require understanding at tax time. Both funds are doing what they advertise. For pure total return, SPY remains the benchmark to beat.
Contact [email protected] for any questions or corrections.