The S&P 500 Looks Pricey at 22x Earnings. On Cash Flow, It’s a Terrifying 32x.
On a recent episode of Barron’s Streetwise, host Jack Hough answered a listener named William who was nervous about how much money he had made in AI-adjacent names like Dell (NYSE:DELL | DELL Price Prediction) and HPE (NYSE:HPE). Hough’s answer had a number…

On a recent episode of Barron’s Streetwise, host Jack Hough answered a listener named William who was nervous about how much money he had made in AI-adjacent names like Dell (NYSE:DELL | DELL Price Prediction) and HPE (NYSE:HPE). Hough’s answer had a number in it that should probably make everyone else nervous too.
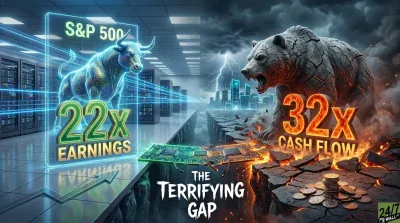
“You can look at the S&P 500 right now and you can say, okay, it trades at 22 times projected 2026 earnings. That’s kind of expensive. But it trades at 32 times projected free cash flow. That’s extraordinarily expensive.” The index is up 9.22% year to date, and the gap between what companies are earning on paper and what they are actually converting into cash is now the most important argument on Wall Street.
The accounting quirk hiding inside the AI boom
Hough’s explanation is worth understanding because it is not complicated. When a hyperscaler spends billions on GPUs and data centers, that capex gets depreciated over years, so only a sliver hits the income statement each quarter. Meanwhile, the companies selling picks and shovels (servers, switches, generators) book the corresponding revenue immediately. So the whole ecosystem’s reported earnings look terrific, while the cash actually leaving the building tells a different story. Hough cited Google’s projected 2025 profit of $173 billion against free cash flow of only $19 billion, and Meta’s $84 billion in earnings against roughly $400 million in cash burn as the shape of the problem.
Those specific figures are directional, and the actual reports rhyme with them. Alphabet (NASDAQ:GOOGL) posted FY2025 free cash flow of $73.3 billion, up just 0.7% year over year, even as capex jumped 74% to $91.4 billion. In Q1 2026 it got worse. FCF collapsed 46.63% to $10.12 billion while capex more than doubled to $35.67 billion. Sundar Pichai then guided 2026 capex to $175 to $185 billion, which is a number that used to be a country’s defense budget. You can read the whole thing in the Q1 2026 8-K.
Meta is running the same experiment
Meta Platforms (NASDAQ:META) reported full-year 2025 free cash flow of $43.6 billion, down 19.39%, even though revenue grew 22.17%. Then management raised 2026 capex guidance to $125 to $145 billion, from a prior range that was already historic.
The Q1 EPS beat of 56.79% looked enormous, but $3.13 of that came from an $8.03 billion tax benefit tied to R&D treatment. Meta shares are down 8.6% year to date, one of the few big names where the market has actually pushed back on the story. Alphabet, meanwhile, is up 15% YTD.
The hard-hat side has already run
Hough’s tactical suggestion was “less big tech, more hard hat and value stocks.” The problem is the market got there first. Dell Technologies reported quarterly revenue growth of 87.5% with AI-optimized server revenue of $16.13 billion, and the stock is up 217% year to date.
Hewlett Packard Enterprise is up 77% YTD on the Juniper networking integration and AI servers. Even Caterpillar (NYSE:CAT), which nobody would confuse with a growth stock, is up 62% YTD because its Power Generation segment rose 41% feeding data center reciprocating engines. Its trailing P/E is now 48x, which is not a value stock multiple.
What to actually do about it
Hough cited a Bank of America mid-year note that kept its S&P 500 target at 7,100, representing roughly a 5% decline from publication, alongside rising odds of a “bear flattener” in rates, historically the second worst phase for stocks in 12-month returns going back to 1976.
For most people, though, his advice was less exciting. “My recommendation is to hurry up and do nothing” for long-term investors. The 32x cash flow multiple is a reminder that when reported earnings are being flattered by the capex of others, the margin for disappointment is thinner than the P/E ratio suggests.
Contact [email protected] for any questions or corrections.
Omor Ibne Ehsan is a writer at 24/7 Wall St. He is a self-taught investor with a focus on growth, cyclical, and dividend equities that have strong fundamentals, value, and long-term potential. He also has an interest in high-risk, high-reward investments such as penny stocks.